
Data lineage helps you understand how data moves through your systems by tracking the relationships between data assets and the processes that transform them. You can view this lineage information as graphs and lists in the Google Cloud console.
This document describes table-level and column-level data lineage granularity, and provides instructions for using graph and list views to explore data lineage in the Google Cloud console.
For details on the underlying data model, see the data lineage information model .
Differences between table-level and column-level lineage
Data lineage lets you trace the origin and transformation path of your data at both the table and column levels.
When to use table-level lineage
Table-level lineage provides a high-level overview of your data pipelines by showing the relationships between entire tables. Use table-level lineage for macro-level tasks such as the following:
-
Data discovery.An analyst building a new dashboard can use table-level lineage to trace a summary table back to its sources and confirm that the data originates from an authoritative database.
-
Migration planning.A database administrator planning to migrate a core database can use table-level lineage to identify every downstream report and dashboard that depends on it.
-
Auditing and governance.A data governor can use table-level and column-level lineage to check how data from a table that contains personally identifiable information (PII) flows through a pipeline.
When to use column-level lineage
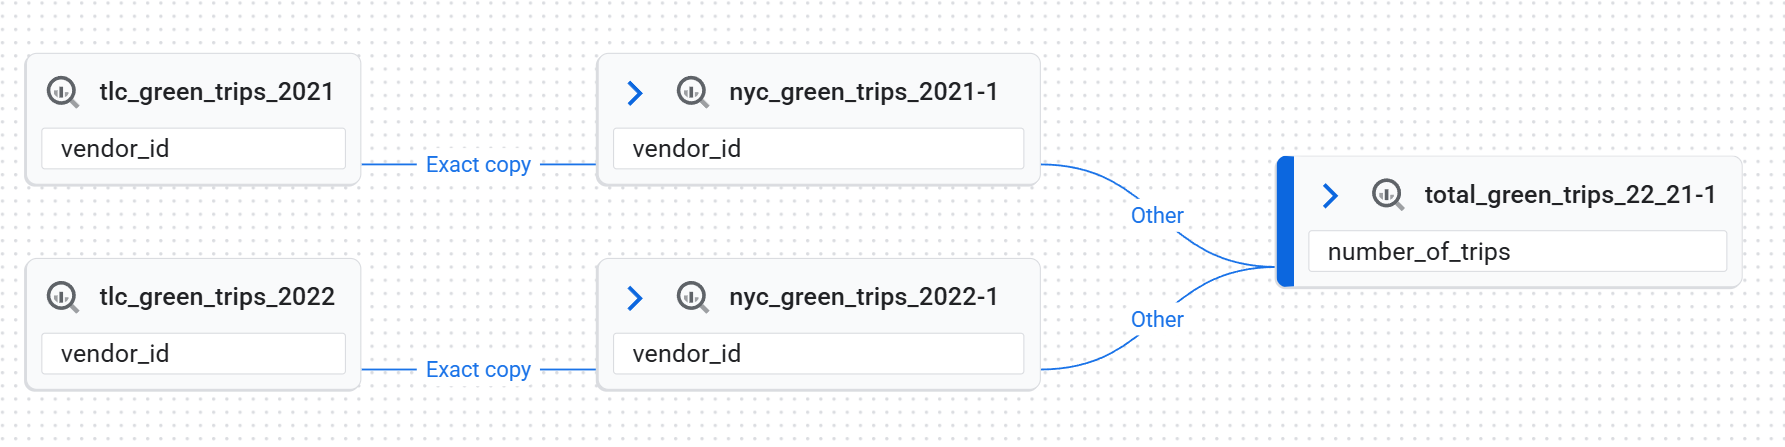
Column-level lineage provides a more granular view by tracking the flow of data between individual columns. In this view, the links within a lineage event represent the relationship between a source column and a target column. Each of these column-level links has a dependency type that describes the transformation:
-
Exact copy: values are copied between columns. -
Other: other types of dependencies between columns.
Use column-level lineage for tasks such as the following:
-
Root cause analysis.If a data analyst finds an incorrect value in a column, they can use column-level lineage to trace it back to the source columns to find the root cause.
-
Impact analysis.Before a data engineer deprecates a column, they can use column-level lineage to find every downstream column that depends on it.
-
Data source verification for metrics.A data analyst can use column-level lineage to identify which source columns are used to calculate a metric without deciphering a complex SQL query.
Column-level lineage is automatically collected for the following types of BigQuery jobs:
For Managed Service for Apache Spark jobs, support depends on the type and version of the Open Lineage dependency used by Managed Service for Apache Spark. The minimum supported version is 1.34. The following are the minimum supported Managed Service for Apache Spark cluster image versions:
- 3.0.3
- 2.3.22
- 2.2.75
- 2.1.107
The following are the minimum supported Managed Service for Apache Spark runtime versions:
- 3.0.3
- 2.3.20
Lineage views in the Google Cloud console
Data lineage in the Google Cloud console lets you interact with lineage information in two ways: you can explore the lineage graph across multiple available regions, or you can use the Lineage explorerpanel to get a more focused view within a specific region. You can also switch between the Graphview and the Listview to analyze data flow at different levels of detail.
Lineage views are available only for Knowledge Catalog (formerly Dataplex Universal Catalog) entries, BigQuery assets, and Vertex AI resources (models, datasets, feature store views, and feature groups).
To see the different views discussed in this document, see Use data lineage with Google Cloud systems .
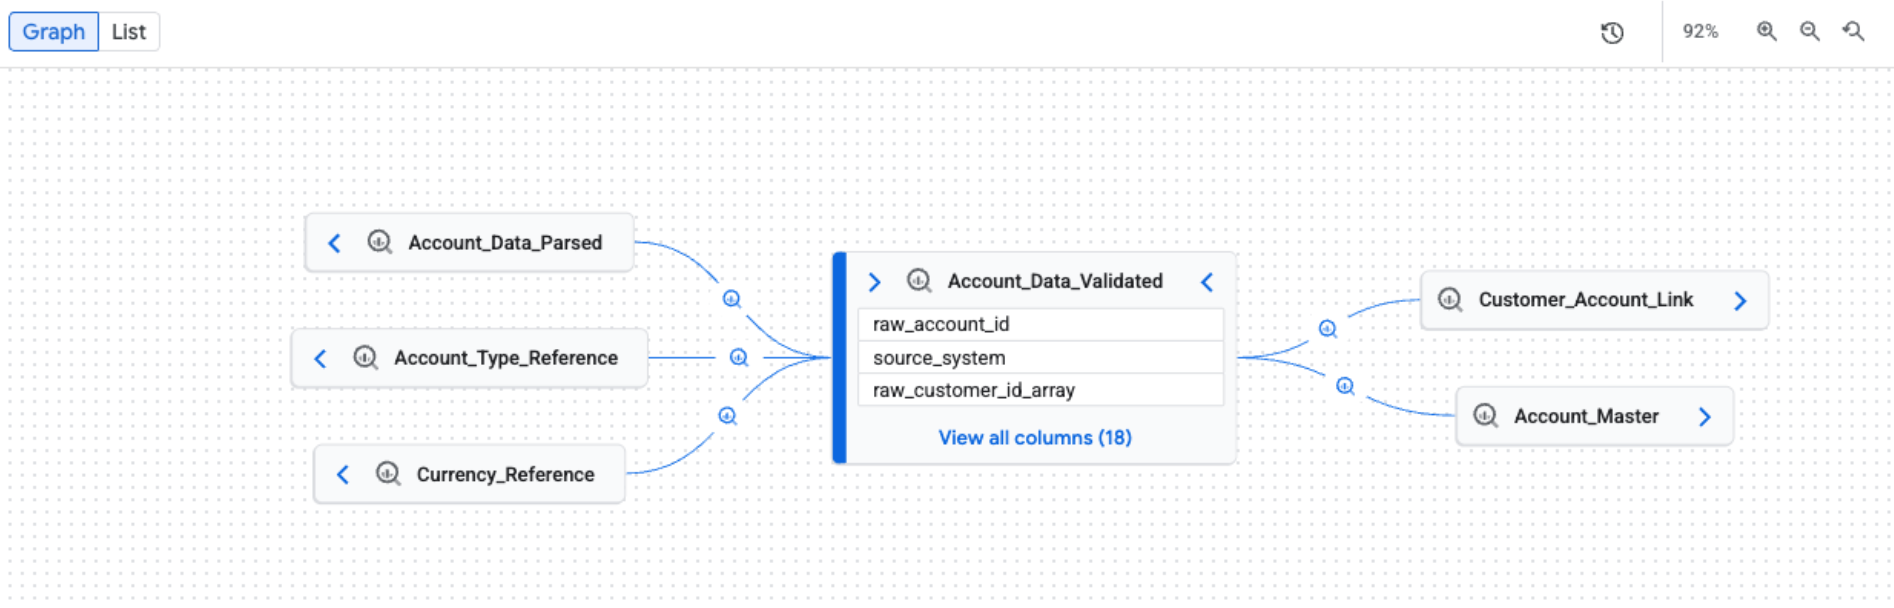
Lineage graph view
The Graphview visualizes data asset flow and relationships across systems and regions, helping you understand data architecture, trace origins and destinations, and identify patterns. These lineage graphs, generated by the Data Lineage API service for a specific Knowledge Catalog entry, show how data is transformed over time, displaying upstream, downstream, or both flows from a selected root entry.
The Data Lineage API automatically receives asset information from supported systems and through API calls for custom sources.
The key elements in the graph are as follows:
-
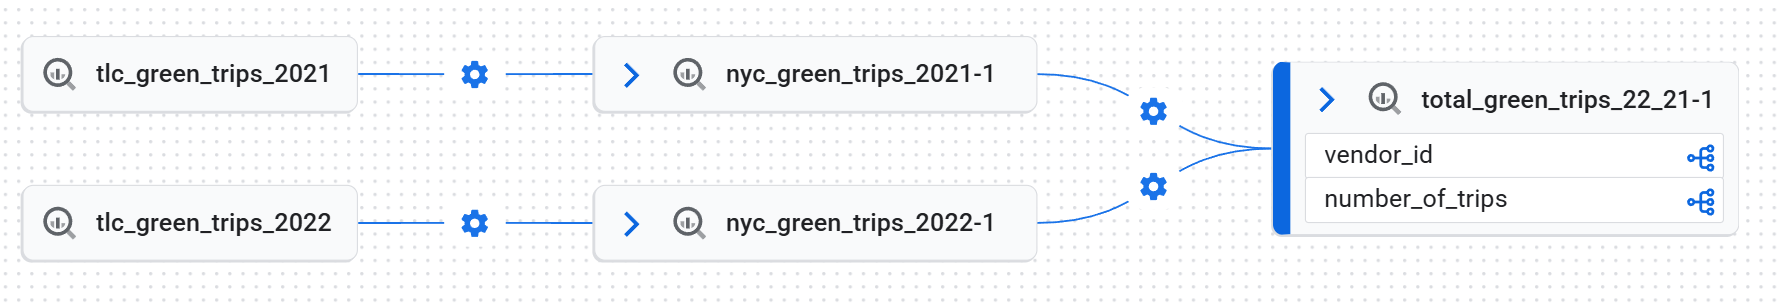
Nodes.Nodes represent the data entities. In a table-level view, a node shows the table name and its columns. In a column-level view, each node represents a specific table and column.
-
Edges.Edges are the lines that connect nodes and represent the processes that occur between them. The appearance of an edge depends on the lineage view:
- In the table-level view, edges have icons to indicate data transformations.
- In the column-level view, edges have labels to indicate data
transformations. For example, an edge label might say
Exact copyto describe how a source column was copied to a target column.
-
Process icons and labels.Process icons and labels appear on edges to provide more information about the transformation.
- Icons.Icons represent the transformation process. When you manually explore the graph, icons on edges represent the source system of the process (for example, BigQuery or Vertex AI). If multiple processes are involved, a 'multiple processes' icon is displayed. If the process source system is unknown, a gear icon is used. When you apply filters, a gear icon is used for all processes.
- Labels.In the column-level lineage view, a label describes the type
of dependency between columns:
Exact copyorOther.
Explore the lineage graph
When you open the Lineagetab, you see the default Graphview. The default view provides a high-level overview across systems and regions, with manual and incremental graph expansion that can load five nodes at a time. Process icons on edges represent the source system or indicate multiple processes.
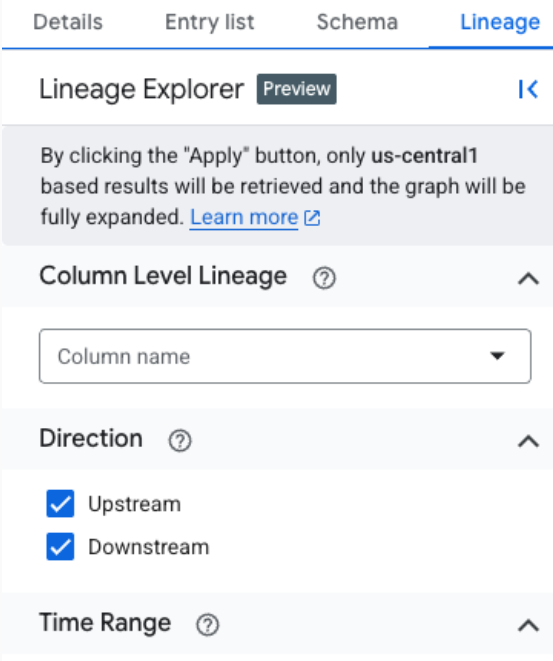
Filter and highlight data lineage views
For large and complex lineage graphs, you can apply filters or highlighting to reduce visual noise and focus on exploring lineage within a specific region. Use the Lineage explorerpanel to set your criteria. When filters are applied, a filter bar appears at the top of the Graphand Listviews, displaying your active filters as chips.
To refine the lineage visualization, you can choose one of the following modes:
-
Highlight: matching nodes are visually emphasized with colors and borders, while the full graph remains visible. This helps to locate specific assets without losing the overall context of the lineage graph.
-
Filter: non-matching nodes are hidden, and the graph is simplified to show only matching nodes and the paths between them. Any non-matching assets that are part of a path between matching nodes are grouped into collapsed nodes. This mode is useful for reducing complexity and focusing only on relevant assets and their direct relationships.
To filter or highlight lineage, use the following criteria:
- Project: filter by Google Cloud project ID.
- System: filter by the system where the data asset is located (for example, BigQuery or Cloud Storage ).
- Entity name: filter by asset name. You can use
*for wildcard searches (prefix and suffix only—for example,*tableortest*). - Subtype: filter by asset subtype (for example,
dashboardormodel). - Column name: filter lineage by column name to see column-level details.
- Direction: show upstream or downstream lineage, or both.
- Time range: filter lineage based on a specific start or end time.
- Dependency type: filter column-level lineage based on dependency type.
Examples of available options include
AllorExact copy.
To further reduce clutter, you can select Hide temporary BigQuery tablesto
hide transient assets created by BigQuery, such as tables in
datasets with names that start with _script
.
The focused view in the Graphview tab automatically expands the graph up to three levels, loading all lineage matching the filter criteria. Lineage explorerfetches up to 10 levels of the lineage graph, but only the first three levels are expanded by default. You can expand the graph to see the remaining levels by clicking the arrows.
The focused view supports both table-level and column-level lineage, including path visualization from any selected node back to the root. In this focused view, a generic gear icon is used for all processes.
To view column-level lineage, use one of the following methods:
-
In a focused Graphview, click the column icon on a table to switch to column-level lineage.
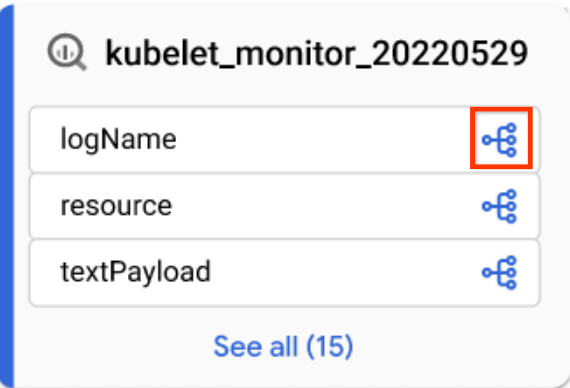
Column icon -
In the default Graphview or focused Graphview, apply a column name in the Lineage explorerpanel.
To remove all filters and return to the default view, click Reset.
To switch between highlight and filter modes, see Refine the lineage visualization .
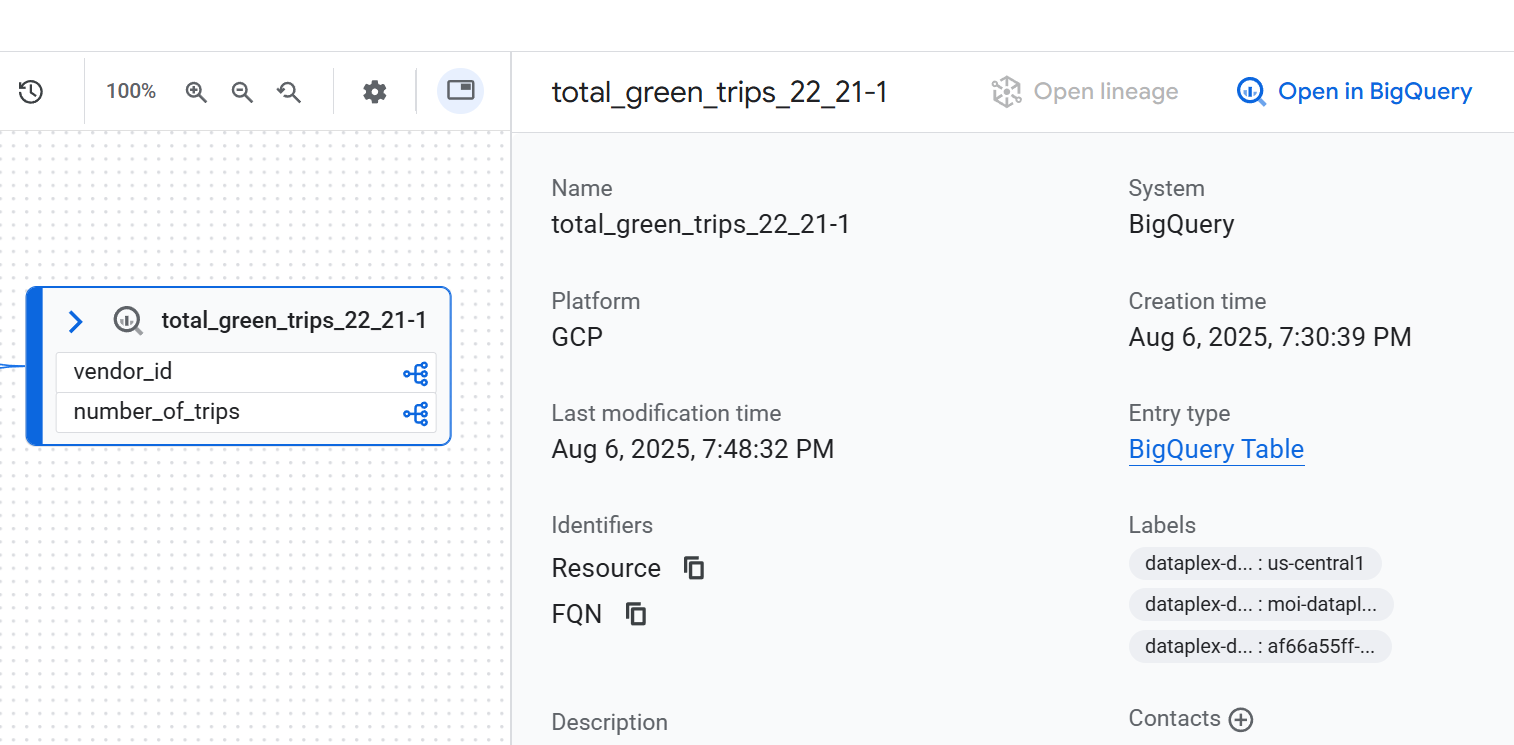
View lineage node details
To see the details of a node, click the node. A side panel appears and displays detailed information about the selected data asset. For example, in a table-level lineage view, clicking a node displays information such as the asset's fully qualified name, type, and other relevant attributes.
View the history of lineage runs
A complete lineage graph is the result of runs from many different jobs. Each job creates a specific link in the graph. Multiple executions are logged as new runs but don't change the static appearance of the graph.
To see the details of these individual executions, click an edge with a process on the graph. In the Querypanel that appears, click the Runstab.
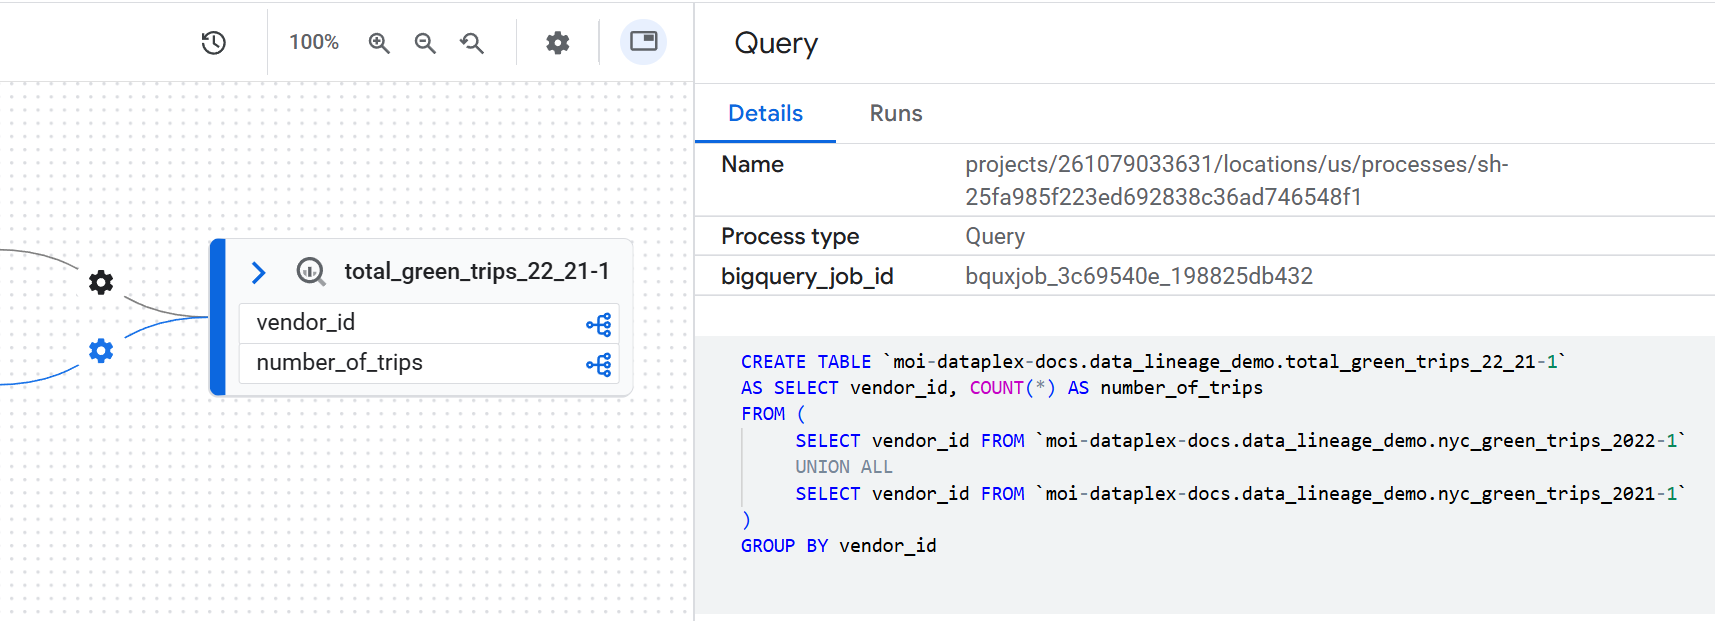
Inspect data transformation logic
To understand the business logic of a transformation without searching for the code, you can view the exact SQL query that ran. To view the SQL code, click an edge with a process on the graph. In the side panel that appears, click the Detailstab.
Visualize a data lineage path
Lineage path visualization helps you trace the path from any selected node in the graph back to the root entry. When you select a node and click Visualize path, the graph highlights only the nodes and processes that form the direct lineage path to the root entry.
To see the lineage path visualization, in the Lineage explorerpanel, apply a filter to create a focused Graphview. Then, in the focused Graphview, select a node. In the details panel for the selected node, click Visualize Path.
Lineage path visualization is available for table-level and column-level lineage. You can also use lineage path visualization in the Listview.
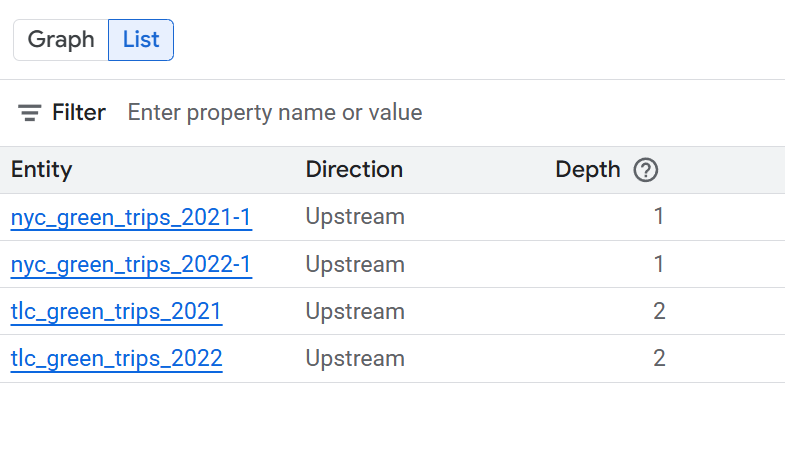
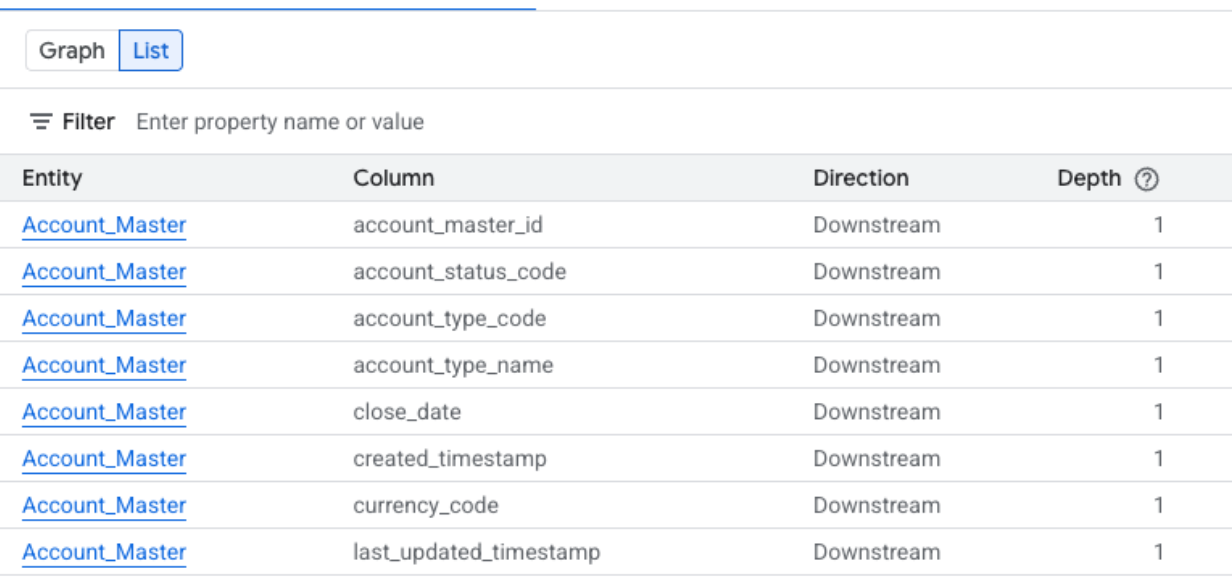
Lineage list view
The Listview offers a tabular, structured representation of lineage, synchronized with the Graphview. It helps you sort, filter, and download data assets. This view is ideal for analyzing source-target relationships, detailing involved assets, and exporting lineage data.
The Listview is available for both table-level and column-level lineage. You can toggle between the following detailed and simplified list views:
-
Simplified list view: this view is useful for getting a condensed, unique list of all assets involved in the lineage. The columns such as System, Project, Entity, FQN(Fully Qualified Name), Direction, and Depthhelp you see all the data assets in the lineage, where they reside, their original source, and their distance from the central asset being analyzed. It is ideal for a high-level overview of all entities participating in the data flow. It is the default view.
-
Detailed list view: this view is designed for analyzing individual source-target relationships. By providing separate columns for Sourceand Target, you can see each specific data transformation link. This view is ideal for tasks requiring a deep understanding of how data moves between specific pairs of assets, such as auditing individual data flows, understanding dependencies between tables, or exporting detailed lineage records for each connection.
Table-level lineage list view
This view shows relationships between tables as a whole. Use the provided filters to select the columns that you require.
Expand the following sections to see the columns available in the table-level list views.
Columns available in simplified table-level list view
- System: the system where the data asset is located. Examples include [BigQuery](/bigquery/docs).
- Project: the Google Cloud project ID containing the data asset.
- Entity: the name of the data asset. Examples include a table name.
- FQN: the Fully Qualified Name (FQN) of the original source entity or column.
- Direction: indicates whether the listed asset is upstream (source) or downstream (target) in the lineage flow.
- Depth: the number of lineage steps from the central asset being analyzed.
Columns available in detailed table-level list view
- Source system: the system where the source data asset is located. Examples include BigQuery.
- Source project: the Google Cloud project ID containing the source data asset.
- Source: the name of the source data asset. Examples include a table name.
- Source FQN: the FQN of the source entity.
- Target system: the system where the target data asset is located. Examples include BigQuery.
- Target project: the Google Cloud project ID containing the target data asset.
- Target: the name of the target data asset. Examples include a table name.
- Target FQN: the FQN of the target entity.
- Direction: indicates whether the listed asset is upstream (source) or downstream (target) in the lineage flow.
- Depth: the number of lineage steps from the central asset being analyzed.
Column-level lineage list view
This view shows relationships between individual columns in the source and target tables. Use the provided filters to select the columns that you require.
Expand the following sections to see the columns available in the column-level list views.
Columns available in simplified column-level list view
- System: the system where the data asset is located. Examples include BigQuery.
- Project: the Google Cloud project ID containing the data asset.
- Entity: the name of the data asset. Examples include a table name.
- Column: the specific column chosen in the Lineage Explorerpanel within the entity.
- FQN: the Fully Qualified Name (FQN) of the original source entity or column.
- Direction: indicates whether the listed asset is upstream (source) or downstream (target) in the lineage flow.
- Depth: the number of lineage steps from the central asset being analyzed.
Columns available in detailed column-level list view
- Source system: the system where the source data asset is located.
- Source project: the Google Cloud project ID containing the source data asset.
- Source FQN: the FQN of the source column.
- Target system: the system where the target data asset is located.
- Target project: the Google Cloud project ID containing the target data asset.
- Target FQN: the FQN of the target column.
- Direction: indicates if the data flow is upstream or downstream.
- Dependency types: describes the nature of the relationship between the columns.
- Depth: the number of lineage steps from the central asset being analyzed.
What's next
-
Learn about lineage sources .
-
Learn how to track data lineage for a BigQuery table copy and query jobs .
-
Learn how to use data lineage with Google Cloud systems .