

This page shows you how to enable Cloud Trace on your agent and view traces to analyze query response times and executed operations.
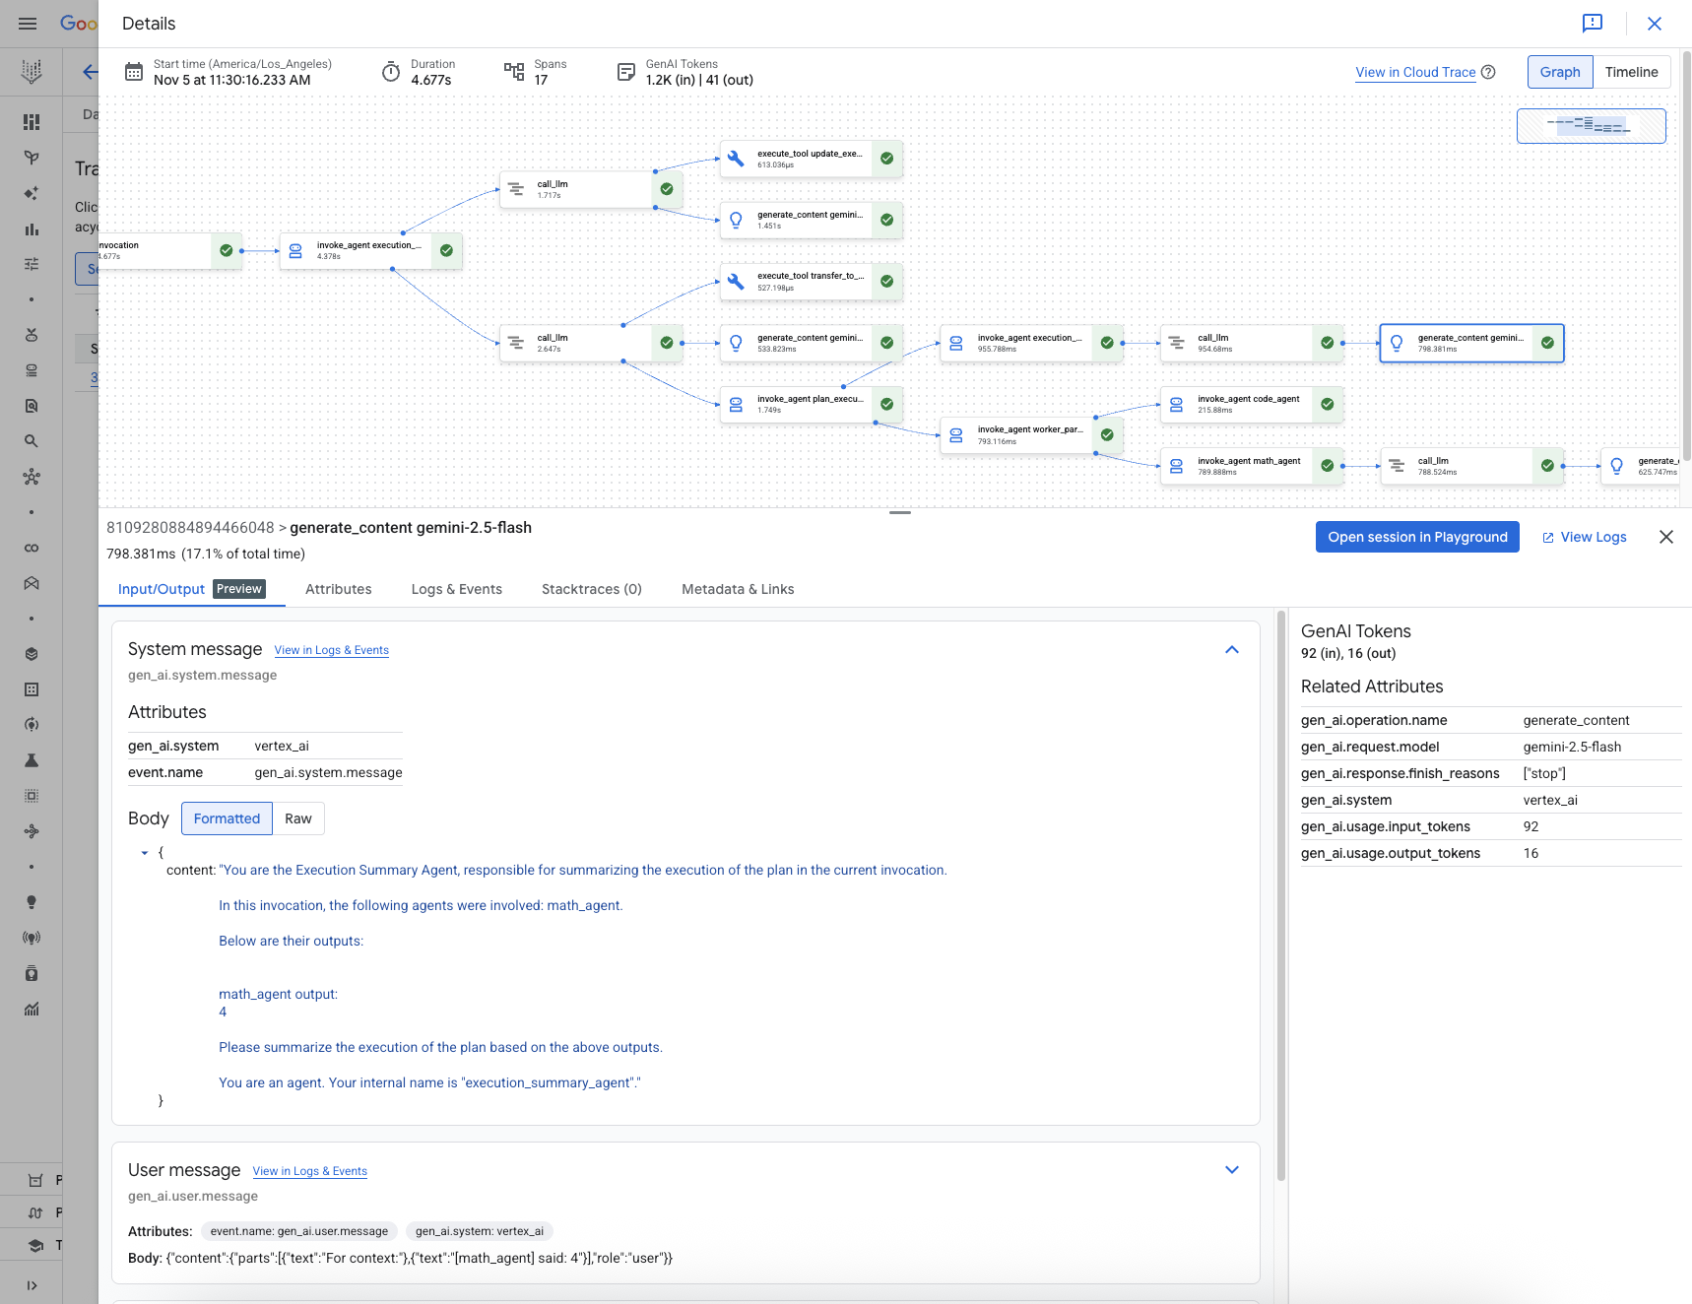
A trace is a timeline of requests as your agent responds to each query. For example, the following chart shows a sample trace from an Agent Development Kit (ADK) agent:
A trace is composed of individual spans , which represent a single unit of work, like a function call or an interaction with an LLM, with the first span representing the overall request. Each span provides details about a specific operation, such as the operation's name, start and end times, and any relevant attributes , within the request. For example, the following JSON shows a single span that represents a call to a large language model (LLM):
  {
 "name"
 :
 "llm"
 ,
 "context"
 :
 {
 "trace_id"
 :
 "ed7b336d-e71a-46f0-a334-5f2e87cb6cfc"
 ,
 "span_id"
 :
 "ad67332a-38bd-428e-9f62-538ba2fa90d4"
 },
 "span_kind"
 :
 "LLM"
 ,
 "parent_id"
 :
 "f89ebb7c-10f6-4bf8-8a74-57324d2556ef"
 ,
 "start_time"
 :
 "2023-09-07T12:54:47.597121-06:00"
 ,
 "end_time"
 :
 "2023-09-07T12:54:49.321811-06:00"
 ,
 "status_code"
 :
 "OK"
 ,
 "status_message"
 :
 ""
 ,
 "attributes"
 :
 {
 "llm.input_messages"
 :
 [
 {
 "message.role"
 :
 "system"
 ,
 "message.content"
 :
 "You are an expert Q&A system that is trusted around the world.
 \n
 Always answer the query using the provided context information, and not prior knowledge.
 \n
 Some rules to follow:
 \n
 1. Never directly reference the given context in your answer.
 \n
 2. Avoid statements like 'Based on the context, ...' or 'The context information ...' or anything along those lines."
 },
 {
 "message.role"
 :
 "user"
 ,
 "message.content"
 :
 "Hello?"
 }
 ],
 "output.value"
 :
 "assistant: Yes I am here"
 ,
 "output.mime_type"
 :
 "text/plain"
 },
 "events"
 :
 [],
 }
For details, see the Cloud Trace documentation on Traces and spans and Trace context .
Before you begin
Before you can collect and write traces, you must enable specific APIs and install dependencies. For more information, see Collect and view multimodal prompts and responses in the Google Cloud Observability documentation.
Write traces for an agent
To write traces for an agent:
ADK
To enable OpenTelemetry for AdkApp
, set the following
environment variables when you deploy the
agent
to
Vertex AI Agent Engine Runtime:
  env_vars
 =
 {
 "GOOGLE_CLOUD_AGENT_ENGINE_ENABLE_TELEMETRY"
 :
 "true"
 ,
 "OTEL_INSTRUMENTATION_GENAI_CAPTURE_MESSAGE_CONTENT"
 :
 "true"
 ,
 }
Note the following:
-
GOOGLE_CLOUD_AGENT_ENGINE_ENABLE_TELEMETRYenables the agent traces and logs, but doesn't include prompts and response data. -
OTEL_INSTRUMENTATION_GENAI_CAPTURE_MESSAGE_CONTENTenables the logging of input prompts and output responses. -
To use trace ingestion, you need to enable the Telemetry API . For more information, see Telemetry (OTLP) API overview
-
To use log ingestion, you need to enable the Logging API For more information, see Cloud Logging API overview .
LangchainAgent
To enable tracing for LangchainAgent
, specify enable_tracing=True
when you develop a LangChain agent
.
For example:
  from

 vertexai.agent_engines

 import
 LangchainAgent
 agent
 =
 LangchainAgent
 (
 model
 =
 model
 ,
 # Required.
 tools
 =
 [
 get_exchange_rate
 ],
 # Optional.
 enable_tracing
 =
 True
 ,
 # [New] Optional.
 )
LanggraphAgent
To enable tracing for LanggraphAgent
, specify enable_tracing=True
when you develop a LangGraph agent
.
For example:
  from

 vertexai.agent_engines

 import
 LanggraphAgent
 agent
 =
 LanggraphAgent
 (
 model
 =
 model
 ,
 # Required.
 tools
 =
 [
 get_exchange_rate
 ],
 # Optional.
 enable_tracing
 =
 True
 ,
 # [New] Optional.
 )
LlamaIndex
Preview
This feature is subject to the "Pre-GA Offerings Terms" in the General Service Terms section of the Service Specific Terms . Pre-GA features are available "as is" and might have limited support. For more information, see the launch stage descriptions .
To enable tracing for LlamaIndexQueryPipelineAgent
, specify enable_tracing=True
when you develop a LlamaIndex agent
.
For example:
  from

 vertexai.preview

 import
 reasoning_engines
 def

 runnable_with_tools_builder
 (
 model
 ,
 runnable_kwargs
 =
 None
 ,
 **
 kwargs
 ):
 from

 llama_index.core.query_pipeline

 import
 QueryPipeline
 from

 llama_index.core.tools

 import
 FunctionTool
 from

 llama_index.core.agent

 import
 ReActAgent
 llama_index_tools
 =
 []
 for
 tool
 in
 runnable_kwargs
 .
 get
 (
 "tools"
 ):
 llama_index_tools
 .
 append
 (
 FunctionTool
 .
 from_defaults
 (
 tool
 ))
 agent
 =
 ReActAgent
 .
 from_tools
 (
 llama_index_tools
 ,
 llm
 =
 model
 ,
 verbose
 =
 True
 )
 return
 QueryPipeline
 (
 modules
 =
 {
 "agent"
 :
 agent
 })
 agent
 =
 reasoning_engines
 .
 LlamaIndexQueryPipelineAgent
 (
 model
 =
 "gemini-2.0-flash"
 ,
 runnable_kwargs
 =
 {
 "tools"
 :
 [
 get_exchange_rate
 ]},
 runnable_builder
 =
 runnable_with_tools_builder
 ,
 enable_tracing
 =
 True
 ,
 # Optional
 )
Custom
To enable tracing for custom agents , visit Tracing using OpenTelemetry for details.
This exports traces to Cloud Trace under the project in Set up your Google Cloud project .
View traces for an agent
For deployed agents, you can use the Google Cloud console to view traces for your agent:
- In the Google Cloud console, go to the Vertex AI Agent Engine
page.
Agent Engine instances that are part of the selected project appear in the list. You can use the Filterfield to filter the list by your specified column.
-
Click the name of your Agent Engine instance.
-
Click the Tracestab.
-
You can select Session viewor Span view.
Click a session or span to inspect trace details, including a directed acyclic graph (DAG) of its spans, inputs and outputs, and metadata attributes.
Quotas and limits
Some attribute values might get truncated when they reach quota limits. For more information, see Cloud Trace Quota .
Pricing
Cloud Trace has a free tier. For more information, see Cloud Trace Pricing .