Single Record chart optionsStay organized with collectionsSave and categorize content based on your preferences.
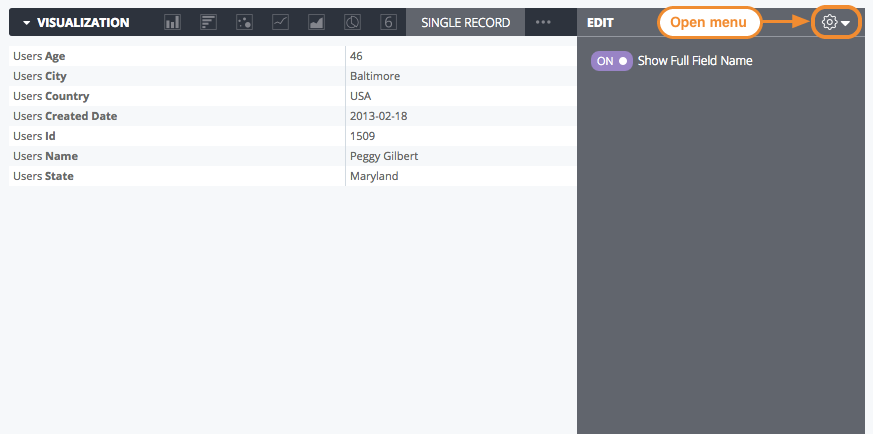
To select a single record chart, click the ellipses (...) on the Visualization menu bar and selectSingle Record. ClickEditin the upper right corner of the visualization tab to format your visualization.
Some of the options that are listed on this documentation page may be grayed out or hidden when they conflict with other settings that you have chosen.
Edit menu options
Show Full Field Name
You can determine whether to show the view name along with the field name for each axis title and series name. WhenShow Full Field Nameis turned off, generally only the field name shows; however, measures of typecountdisplay only the view name instead.
[[["Easy to understand","easyToUnderstand","thumb-up"],["Solved my problem","solvedMyProblem","thumb-up"],["Other","otherUp","thumb-up"]],[["Hard to understand","hardToUnderstand","thumb-down"],["Incorrect information or sample code","incorrectInformationOrSampleCode","thumb-down"],["Missing the information/samples I need","missingTheInformationSamplesINeed","thumb-down"],["Other","otherDown","thumb-down"]],["Last updated 2025-12-17 UTC."],[],[]]