Using your visualization Stay organized with collections
Save and categorize content based on your preferences.
Note:The Community Visualization feature is in Developer Preview. To learn more about upcoming features and improvements during this period, visit the Developer Preview
page.
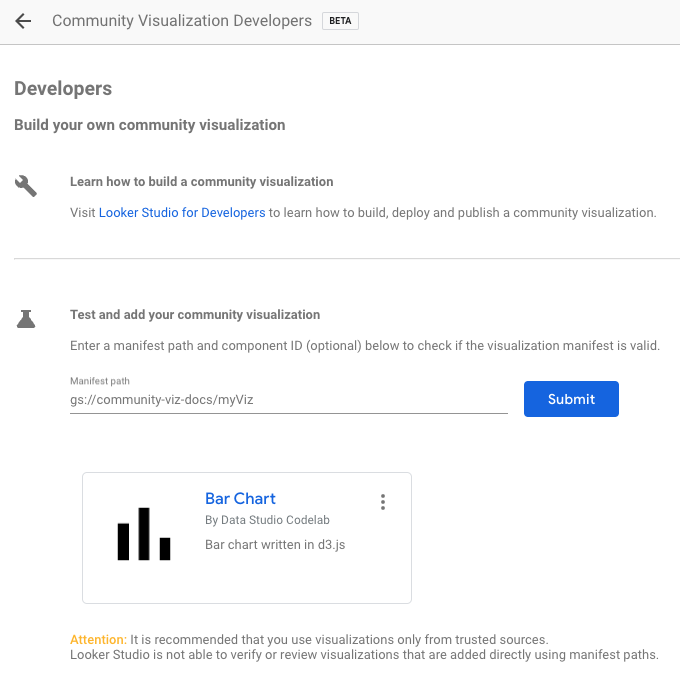
To load a community visualization you've developed, use the location of the
manifest file prefixed by gs://
.
- Edit your report
- In the toolbar, click Community visualizations and components
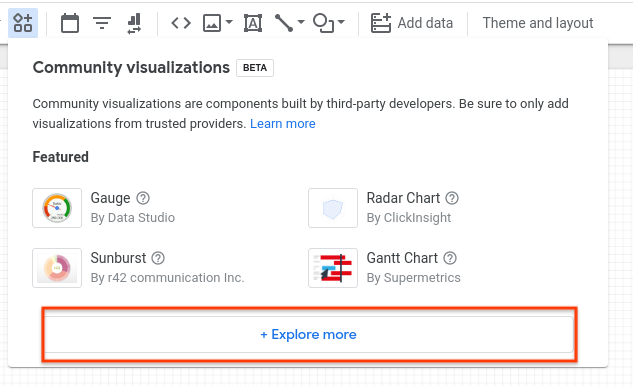
- In the dialog, click Explore moreto open the Community Gallery shade
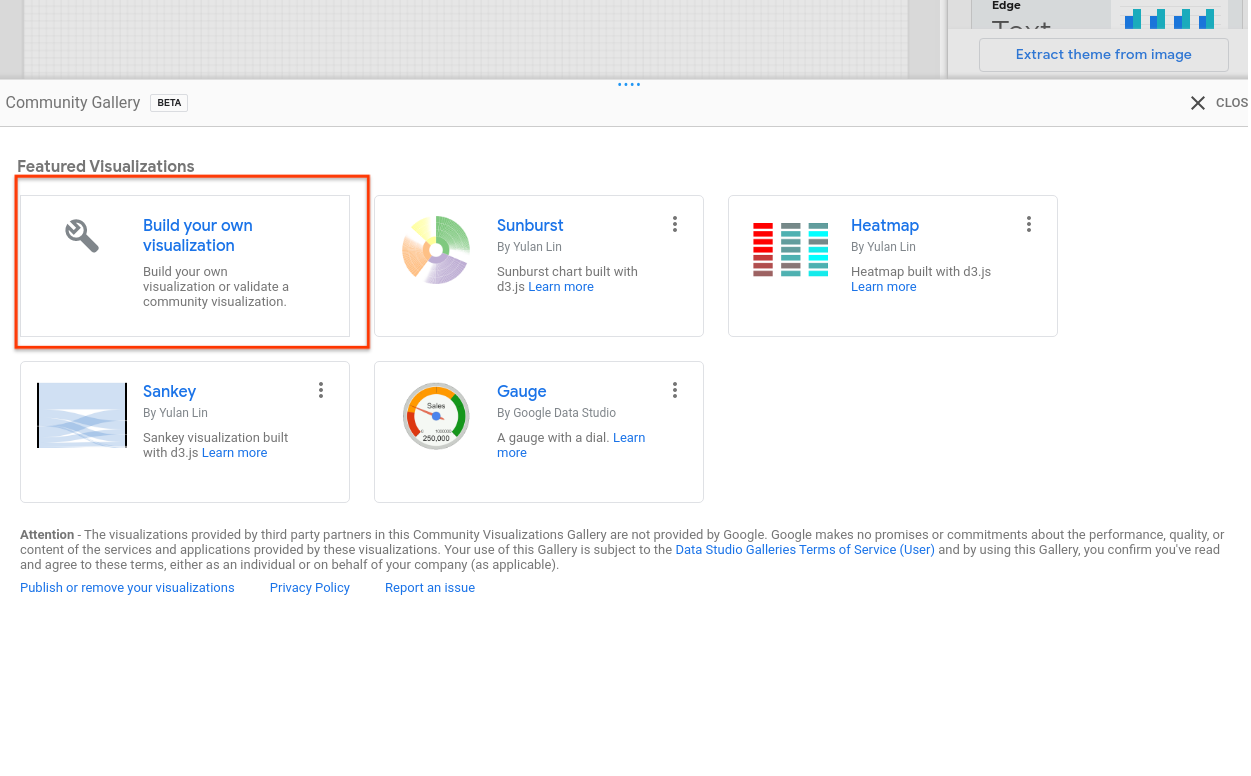
- Click Build your own visualization
- Enter your Manifest Pathand click Submit. One visualization icon
will be rendered for each component in your manifest. Click a visualization
icon to add it to your report.
Next steps
Now that you have written and deployed a community visualization, share
the
visualizations that you build.
Except as otherwise noted, the content of this page is licensed under the Creative Commons Attribution 4.0 License
, and code samples are licensed under the Apache 2.0 License
. For details, see the Google Developers Site Policies
. Java is a registered trademark of Oracle and/or its affiliates.
Last updated 2026-05-13 UTC.
[[["Easy to understand","easyToUnderstand","thumb-up"],["Solved my problem","solvedMyProblem","thumb-up"],["Other","otherUp","thumb-up"]],[["Missing the information I need","missingTheInformationINeed","thumb-down"],["Too complicated / too many steps","tooComplicatedTooManySteps","thumb-down"],["Out of date","outOfDate","thumb-down"],["Samples / code issue","samplesCodeIssue","thumb-down"],["Other","otherDown","thumb-down"]],["Last updated 2026-05-13 UTC."],[],[]]

