
Page Summary
-
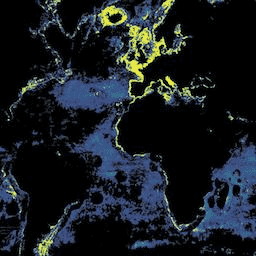
This dataset from Global Fishing Watch provides fishing vessel presence data measured in hours per square km.
-
Data is available daily from 2012 to 2017 and includes presence for different gear types.
-
The dataset is licensed under a Creative Commons Attribution-ShareAlike 4.0 International license.
- Dataset Availability
- 2012-01-01T00:00:00Z–2017-01-01T00:00:00Z
- Dataset Producer
- Global Fishing Watch
- Cadence
- 1 Day
- Tags
Description
Fishing vessel presence, measured in hours per square km. Each asset is the vessel presence for a given flag state and day, with one band for the presence of each gear type.
See sample Earth Engine scripts . Also see the main GFW site for program information, fully interactive visualization maps, and impacts.
Bands
Bands
Pixel size: 1113.2 meters (all bands)
| Name | Units | Pixel Size | Description |
|---|---|---|---|
drifting_longlines
|
h/km^2 | 1113.2 meters | Hours per sq. km of fishing vessel presence with drifting longlines. |
fixed_gear
|
h/km^2 | 1113.2 meters | Hours per sq. km of fishing vessel presence with fixed gear. |
other_fishing
|
h/km^2 | 1113.2 meters | Hours per sq. km of fishing vessel presence with other gear types. |
purse_seines
|
h/km^2 | 1113.2 meters | Hours per sq. km of fishing vessel presence with purse seines. |
squid_jigger
|
h/km^2 | 1113.2 meters | Hours per sq. km of fishing vessel presence with squid jiggers. |
trawlers
|
h/km^2 | 1113.2 meters | Hours per sq. km of fishing vessel presence with trawlers. |
Image Properties
Image Properties
| Name | Type | Description |
|---|---|---|
|
country
|
STRING | ISO3 country code of the vessel flag state. For all countries, use "WLD". |
Terms of Use
Terms of Use
This work is licensed under a Creative Commons Attribution-ShareAlike 4.0 International license. (CC-BY-SA)
Citations
-
Global Fishing Watch, "Tracking the Global Footprint of Fisheries." Science 361.6378 (2018).
Explore with Earth Engine
Code Editor (JavaScript)
 var

 dataset

 =

 ee
 .
 ImageCollection
 (
 'GFW/GFF/V1/vessel_hours'
 )

 .
 filter
 (
 ee
 .
 Filter
 .
 date
 (
 '2016-12-01'
 ,

 '2017-01-01'
 ));
 var

 trawlers

 =

 dataset
 .
 select
 (
 'trawlers'
 );
 var

 trawlersVis

 =

 {

 min
 :

 0.0
 ,

 max
 :

 5.0
 ,
 };
 Map
 .
 setCenter
 (
 130.61
 ,

 34.287
 ,

 8
 );
 Map
 .
 addLayer
 (
 trawlers
 .
 max
 (),

 trawlersVis
 ,

 'Trawlers'
 );