
- Dataset Availability
- 2022-01-01T00:00:00Z–2022-12-31T00:00:00Z
- Dataset Producer
- Joint Research Center, Unit D5
- Tags
Description
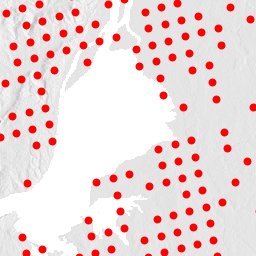
The Land Use/Cover Area frame Survey (LUCAS) in the European Union (EU) was set up to provide statistical information. It represents a triennial in-situ landcover and land-use data-collection exercise that extends over the whole of the EU's territory. LUCAS collects information on land cover and land use, agro-environmental variables, soil, and grassland. The surveys also provide spatial information to analyse the mutual influences between agriculture, environment, and countryside, such as irrigation and land management.
The dataset presented here is the 2022 version of the LUCAS surveys. Each point's location is using the fields 'POINT_LAT' and 'POINT_LON', that is, the LUCAS theoretical location (THLOC), as prescribed by the LUCAS grid. For more information please see Citations.
Table Schema
Table Schema
Theoretical point position in LAEA: First 4 digits are X_LAEA and other 4 digits are Y_LAEA.
Country (NUTS 2021 classification).
Sub country division (NUTS 2021 classification).
Region (NUTS 2021 classification).
Province (NUTS 2021 classification).
Point altitude.
SOIL 2022 sample.
Ex-Ante point.
PI extension point
COPERNICUS 2022 sample
GULLY EROSION point
SOIL_BULK_0_10 point
SOIL_BULK_10_20 point
SOIL_BULK_20_30 point
SOIL BIO point
LANSCAPE FEATURES 2022 sample
Date.
Type of Observation.
Values:
- 1 Field survey, point visible, <= 100 m
- 2 Field survey, point visible, >100 m to point
- 3 Photo-interpretation in the field
- 4 Point not visible. PI not possible
- 5 Out of national territory
- 6 Out of EU
- 7 Photo-interpretation in the office
GPS coordinate system.
Values:
- WGS84
- Problem with Signal
- N.R.
GPS elevation (meters).
GPS precision (meters).
GPS distance to point.
Direction of observation.
Values:
- 1 On the point
- 2 To North
- 3 To East
- 4 N.R.
Parcel area (ha).
Values:
- 1 area < 0.1
- 2 0.1 <= area < 0.5
- 3 0.5 <= area < 1
- 4 1 <= area < 10
- 5 area >= 10
- 6 N.R.
LC1 land cover 1. Land cover code (C3 doc). In case of PI, in addition to the detailed classification, also an aggregated classification can be used.
LC1 crop species. List of detailed crop species (C3 doc, codes B00), and an option “Assessment not possible” for PI (observation type 3 or 7).
LC1 Crop-coverage (%).
LC2 land cover 2. Land cover code (C3 doc). In case of PI, in addition to the detailed classification, also an aggregated classification can be used.
LC2 crop species. List of detailed crop species (C3 doc, codes B00), and an option “Assessment not possible” for PI (observation type 3 or 7).
LC2 Crop-coverage (%).
Height of trees (CXX, D10, E10)/crops (B70,B80) at survey.
Values:
- 1 < 5 m
- 2 >= 5 m
- 3 N.R.
- 4 Assessment not possible
Height of trees (CXX, D10, E10)/crops (B70,B80) at maturity.
Values:
- 1 < 5 m
- 2 >= 5 m
- 3 N.R.
- 4 Assessment not possible
Width of feature.
Values:
- 1 < 20 m
- 2 >= 20 m
- 3 N.R.
LU1 land use 1. Land use code (C3 doc). In case of PI, in addition to the detailed classification, also an aggregated classification can be used.
LU1 land use type. List of detailed crop species (C3 doc, codes U22Xn and U315n), and an option “Assessment not possible” for PI (observation type 3 or 7).
LU1 coverage (%).
LU2 land use 2. Land use code (C3 doc). In case of PI, in addition to the detailed classification, also an aggregated classification can be used.
LU2 land use type. List of detailed crop species (C3 doc, codes U22Xn, U315n), and an option “Assessment not possible” for PI (observation type 3 or 7).
LU2 coverage (%).
Signs of grazing in the field (for points with LC in BXX, CXX, DXX, EXX,FXX,HXX).
Values:
- 1 Visible signs of grazing
- 2 No signs of grazing
- 3 N.R.
Special status.
Values:
- 1 Protected
- 2 Hunting
- 3 Protected and Hunting
- 4 No special status
- 5 N.R.
Special remarks on land cover/ land use.
Values:
- 1 Crop not recognizable - Field harvested (no re-visit)
- 2 Crop not recognizable - Tilled and/or sowed (To be re-visited)
- 3 Clear cut
- 4 Burnt area
- 5 Fire break
- 6 Nursery
- 7 Dump site
- 8 Currently dry (river bed / lake)
- 9 Currently flooded
- 10 No remark
- 11 N.R.
Coniferous forest trees (%).
Broadleaved forest trees (%).
Shrubs (%).
Herbaceous plants (%).
Lichens and mosses (%).
Consolidated (bare) surface (%).
Unconsolidated (bare) surface (%).
Presence of water management.
Values:
- 1 Irrigation
- 2 Potential irrigation
- 3 Drainage
- 4 Irrigation and drainage
- 5 No visible water management
- 6 N.R.
Type of irrigation.
Values:
- 1 Gravity
- 2 Pressure: Sprinkler irrigation
- 3 Pressure: Micro-irrigation
- 4 Gravity/Pressure
- 5 Other/not identifiable
- 6 N.R.
Source of irrigation.
Values:
- 1 Well
- 2 Pond/Lake/Reservoir
- 3 Stream/Canal/Ditch
- 4 Lagoon/Wastewater
- 5 Other/not identifiable
- 6 N.R
Delivery System.
Values:
- 1 Canal
- 2 Ditch
- 3 Pipeline
- 4 Other/not identifiable
- 5 N.R.
Standard soil sample taken?
Values:
- 1 Yes
- 2 Not possible
- 3 N.R.
Presence of hedgerows.
Values:
- 1 Yes
- 2 No
- 3 N.R.
Stones on the surface (% related to the area of the circular sampling zone of 2-m radius, possible values 0-100).
Values:
- 0-25%
- 25-50%
- 50-75%
- 75-100%
Presence of stone walls.
Values:
- 1 No
- 2 Stone wall, not maintained
- 3 Stone wall, well maintained
- 4 N.R.
Presence of grass margins.
Values:
- 1 No
- 2 Grass margins <= 1m
- 3 Grass margins > 1m
- 4 N.R.
Extension of LC to the North (in m).
Source: C1(Instructions), p.233, sec.9.1.12
Extension of LC to the East (in m).
Source: C1(Instructions), p.233, sec.9.1.12
Extension of LC to the South (in m).
Source: C1(Instructions), p.233, sec.9.1.12
Extension of LC to the West (in m).
Source: C1(Instructions), p.233, sec.9.1.12
Point in urban area?
Values:
- 1 Yes
- 2 No
- 3 N.R.
Trees with secondary crops or grazing 2 (within the extended + homogenous plot).
Values:
- 1 Cultivated trees with secondary crops, meadow or pasture (X06)
- 2 Forest trees with grazed grassland, heathland and/or woodland flora (X09)
- 3 N.R.
Biodiversity sample taken?
Values:
- 1 Yes
- 2 Not possible
- 3 N.R.
Bulk (0-10 cm) sample taken?
Values:
- 1 Yes
- 2 Not possible
- 3 N.R.
Bulk (10-20 cm) sample taken?
Values:
- 1 Yes
- 2 Not possible
- 3 N.R.
Bulk (20-30 cm) sample taken?
Values:
- 1 Yes
- 2 Not possible
- 3 N.R.
0-10 cores taken: Point.
0-10 cores taken: North.
0-10 cores taken: East.
0-10 cores taken: South.
0-10 cores taken: West.
10-20 cores taken: Point.
10-20 cores taken: North.
10-20 cores taken: East.
10-20 cores taken: South.
10-20 cores taken: West.
20-30 cores taken: Point.
20-30 cores taken: North.
20-30 cores taken: East.
20-30 cores taken: South.
20-30 cores taken: West.
Bulk 0-10 moist weight (g)
Bulk 0-10 dried weight (g)
Bulk 10-20 moist weight (g)
Bulk 10-20 dried weight (g)
Bulk 20-30 moist weight (g)
Bulk 20-30 dried weight (g)
GPS calculated distance to point.
Copernicus LC.
Can you do the Copernicus survey?
Values:
- 1 Yes
- 2 No
Homogenous plot fills extended window.
Values:
- Yes
- No
Reason for changing direction of observation.
Values:
- 1 Border between ...
- 2 Linear Feature ...
Border from. C1 - Annex 9.2.1 / 9.2.2 code list. If observation type is not 3 or 7, only 3rd level codes can be selected. If observation type is 3 or 7, codes in any level codes can be selected.
Border to. C1 - Annex 9.2.1 / 9.2.2 code list. If observation type is not 3 or 7, only 3rd level codes can be selected. If observation type is 3 or 7, codes in any level codes can be selected.
Linear feature. C1 - Annex 9.2.7 code list.
Poor Ortho-photo conditions ?
Values:
- 1 Outdated
- 2 Detail quality issue
- 3 Outdated and Detail quality issue
- 4 No
LC/LU assessment by using additional sources.
Values:
- 1 for LC
- 2 for LU
- 3 for LC/LU
- 4 Not Used
Additional sources used.
Values:
- 1 Google Earth /Google Maps
- 2 Previous Campaign information
- 3 Other additional sources
- 4 No other suitable sources available
Only assessment on lower detail level possible.
Values:
- 1 for LC
- 2 for LU
- 3 for LC/LU
- 4 No restriction, full assessment possible
Artificial constructions (%).
Arable land (%).
Permanent woody and shrubby crops (%).
Wetlands and marshes (%).
Organic deposits (peatland) (%).
Chemical deposits (%).
Intertidal flats (%).
Fresh water course (%).
Fresh water bodies (%).
Salt or brackish water (%).
Unvegetated Area (%).
Presence of combined grass margin + hedgegrow.
Values:
- 1 Yes
- 2 No
- 3 N.R.
Presence of soil surface covers: standing vegetation.
Values:
- 1 Yes
- 2 No
- 3 N.R.
Percentage of surface cover by standing vegetation.
Values:
- 1 0-25%
- 2 25-50%
- 3 50-75%
- 4 75-100%
Presence of soil surface covers: crop residues.
Values:
- 1 Yes
- 2 No
- 3 N.R.
Percentage of surface cover by crop residues.
Values:
- 1 0-25%
- 2 25-50%
- 3 50-75%
- 4 75-100%
Can you see signs of gully erosion?
Values:
- 1 Yes
- 2 No
What type of gully do you observe?
Values:
- 1 Ephemeral gully (affects only the topsoil, <0.5 m deep)
- 2 Permanent gullies (affects both topsoil and subsoil, 0.5-30 m deep)
- 3 Badlands (i.e. gullied landscape areas)
Direction from point.
Values:
- North
- East
- South
- West
Mean length (L) in meters.
Values:
- <1
- 1-10
- 10-50
- 50-100
- > 100
Mean width (W) in meters.
Values:
- <1
- 1-5
- 5-10
- 10-20
- >20
Mean depth (D) in meters.
Values:
- <0.3
- 0.3-1
- 1-5
- 5-10
- >10
Signs of use of reclaimed water.
Values:
- 1 Yes
- 2 No
Can you do the soil assessement?
Only for soil samples in woodland sites: Litter sample taken? (CXX).
Values:
- 1 Yes
- 2 Not possible
Landscape feature survey possible?
Values:
- 1 Yes (PI office)
- 2 No (PI office)
- N.R.
Landscape feature survey possible?
Values:
- 1 Yes (field assessment)
- 2 No (field assessment)
- N.R.
Office PI confirmed? (after the PI assessment).
Values:
- 1 Yes, office PI is confirmed
- 2 No, field situation different, edit sub-points. (default value)
After editing.
Values:
- 1 Confirm changes (default value)
- 2 Close without changes
Orthophoto outdated within the quadrant?
Values:
- 1 Yes
- 2 No
Additional walking needed in the field?
Values:
- 1 Yes
- 2 No
PI linear feature 1 in transect A1
PI linear feature 2 in transect A1
Field linear feature 1 in transect A1
Field linear feature 2 in transect A1
PI linear feature 1 in transect A3
PI linear feature 2 in transect A3
Field linear feature 1 in transect A3
Field linear feature 2 in transect A3
PI linear feature 1 in transect A5
PI linear feature 2 in transect A5
Field linear feature 1 in transect A5
Field linear feature 2 in transect A5
PI linear feature 1 in transect A7
PI linear feature 2 in transect A7
Field linear feature 1 in transect A7
Field linear feature 2 in transect A7
PI linear feature 1 in transect A9
PI linear feature 2 in transect A9
Field linear feature 1 in transect A9
Field linear feature 2 in transect A9
PI linear feature 1 in transect B2
PI linear feature 2 in transect B2
Field linear feature 1 in transect B2
Field linear feature 2 in transect B2
PI linear feature 1 in transect B4
PI linear feature 2 in transect B4
Field linear feature 1 in transect B4
Field linear feature 2 in transect B4
PI linear feature 1 in transect B6
PI linear feature 2 in transect B6
Field linear feature 1 in transect B6
Field linear feature 2 in transect B6
PI linear feature 1 in transect B8
PI linear feature 2 in transect B8
Field linear feature 1 in transect B8
Field linear feature 2 in transect B8
PI linear feature 1 in transect C1
PI linear feature 2 in transect C1
Field linear feature 1 in transect C1
Field linear feature 2 in transect C1
PI linear feature 1 in transect C3
PI linear feature 2 in transect C3
Field linear feature 1 in transect C3
Field linear feature 2 in transect C3
PI linear feature 1 in transect C5
PI linear feature 2 in transect C5
Field linear feature 1 in transect C5
Field linear feature 2 in transect C5
PI linear feature 1 in transect C7
PI linear feature 2 in transect C7
Field linear feature 1 in transect C7
Field linear feature 2 in transect C7
PI linear feature 1 in transect C9
PI linear feature 2 in transect C9
Field linear feature 1 in transect C9
Field linear feature 2 in transect C9
PI linear feature 1 in transect D2
PI linear feature 2 in transect D2
Field linear feature 1 in transect D2
Field linear feature 2 in transect D2
PI linear feature 1 in transect D4
PI linear feature 2 in transect D4
Field linear feature 1 in transect D4
Field linear feature 2 in transect D4
PI linear feature 1 in transect D6
PI linear feature 2 in transect D6
Field linear feature 1 in transect D6
Field linear feature 2 in transect D6
PI linear feature 1 in transect D8
PI linear feature 2 in transect D8
Field linear feature 1 in transect D8
Field linear feature 2 in transect D8
PI linear feature 1 in transect E1
PI linear feature 2 in transect E1
Field linear feature 1 in transect E1
Field linear feature 2 in transect E1
PI linear feature 1 in transect E3
PI linear feature 2 in transect E3
Field linear feature 1 in transect E3
Field linear feature 2 in transect E3
PI linear feature 1 in transect E5
PI linear feature 2 in transect E5
Field linear feature 1 in transect E5
Field linear feature 2 in transect E5
PI linear feature 1 in transect E7
PI linear feature 2 in transect E7
Field linear feature 1 in transect E7
Field linear feature 2 in transect E7
PI linear feature 1 in transect E9
PI linear feature 2 in transect E9
Field linear feature 1 in transect E9
Field linear feature 2 in transect E9
PI linear feature 1 in transect F2
PI linear feature 2 in transect F2
Field linear feature 1 in transect F2
Field linear feature 2 in transect F2
PI linear feature 1 in transect F4
PI linear feature 2 in transect F4
Field linear feature 1 in transect F4
Field linear feature 2 in transect F4
PI linear feature 1 in transect F6
PI linear feature 2 in transect F6
Field linear feature 1 in transect F6
Field linear feature 2 in transect F6
PI linear feature 1 in transect F8
PI linear feature 2 in transect F8
Field linear feature 1 in transect F8
Field linear feature 2 in transect F8
PI linear feature 1 in transect G1
PI linear feature 2 in transect G1
Field linear feature 1 in transect G1
Field linear feature 2 in transect G1
PI linear feature 1 in transect G3
PI linear feature 2 in transect G3
Field linear feature 1 in transect G3
Field linear feature 2 in transect G3
PI linear feature 1 in transect G5
PI linear feature 2 in transect G5
Field linear feature 1 in transect G5
Field linear feature 2 in transect G5
PI linear feature 1 in transect G7
PI linear feature 2 in transect G7
Field linear feature 1 in transect G7
Field linear feature 2 in transect G7
PI linear feature 1 in transect G9
PI linear feature 2 in transect G9
Field linear feature 1 in transect G9
Field linear feature 2 in transect G9
PI linear feature 1 in transect H2
PI linear feature 2 in transect H2
Field linear feature 1 in transect H2
Field linear feature 2 in transect H2
PI linear feature 1 in transect H4
PI linear feature 2 in transect H4
Field linear feature 1 in transect H4
Field linear feature 2 in transect H4
PI linear feature 1 in transect H6
PI linear feature 2 in transect H6
Field linear feature 1 in transect H6
Field linear feature 2 in transect H6
PI linear feature 1 in transect H8
PI linear feature 2 in transect H8
Field linear feature 1 in transect H8
Field linear feature 2 in transect H8
PI linear feature 1 in transect I1
PI linear feature 2 in transect I1
Field linear feature 1 in transect I1
Field linear feature 2 in transect I1
PI linear feature 1 in transect I3
PI linear feature 2 in transect I3
Field linear feature 1 in transect I3
Field linear feature 2 in transect I3
PI linear feature 1 in transect I5
PI linear feature 2 in transect I5
Field linear feature 1 in transect I5
Field linear feature 2 in transect I5
PI linear feature 1 in transect I7
PI linear feature 2 in transect I7
Field linear feature 1 in transect I7
Field linear feature 2 in transect I7
PI linear feature 1 in transect I9
PI linear feature 2 in transect I9
Field linear feature 1 in transect I9
Field linear feature 2 in transect I9
Permanent snow and ice (%).
Point latitude.
Point longitude.
Car park latitude.
Car park longitude.
Point latitude
Point longitude
Litter depth(if sample taken)
URL of photo looking North.
Source: C1(Instructions), p.258, sec.9.1.19
URL of photo looking South.
Source: C1(Instructions), p.258, sec.9.1.19
URL of photo looking East.
Source: C1(Instructions), p.258, sec.9.1.19
URL of photo looking West.
Source: C1(Instructions), p.258, sec.9.1.19
URL of photo on the point.
Source: C1(Instructions), p.258, sec.9.1.19
URL of crop LC1 photo.
Source: C1(Instructions), p.258, sec.9.1.19
Terms of Use
Terms of Use
Citations
-
Ghassemi, B., Izquierdo-Verdiguier, E., Verhegghen, A. et al. European Union crop map 2022: Earth observation’s 10-meter dive into Europe's crop tapestry. Sci Data 11, 1048 (2024). doi:10.1038/s41597-024-03884-y
Explore with Earth Engine
Code Editor (JavaScript)
 var

 dataset

 =

 ee
 .
 FeatureCollection
 (
 'JRC/LUCAS/THLOC/V1/2022'
 );
 // For the Inspector
 Map
 .
 addLayer
 (
 dataset
 ,

 {},

 'LUCAS Points (data)'
 ,

 false
 );
 dataset

 =

 dataset
 .
 style
 ({

 color
 :

 '489734'
 ,

 pointSize
 :

 3
 ,
 });
 Map
 .
 setCenter
 (
 -
 6.0
 ,

 37.0
 ,

 10
 );
 Map
 .
 addLayer
 (
 dataset
 ,

 {},

 'LUCAS 2022 Points'
 );
Visualize as a FeatureView
A FeatureView
is a view-only, accelerated representation of a FeatureCollection
. For more details, visit the FeatureView
documentation.
Code Editor (JavaScript)
 var

 fvLayer

 =

 ui
 .
 Map
 .
 FeatureViewLayer
 (
 'JRC/LUCAS/THLOC/V1/2022_FeatureView'
 );
 var

 visParams

 =

 {

 pointSize
 :

 8
 ,

 color
 :

 '808080'
 ,

 pointFillColor
 :

 {

 property
 :

 'SURVEY_INSPIRE_PLCC4'
 ,

 mode
 :

 'linear'
 ,

 palette
 :

 [
 'ffffcc'
 ,
 'c2e699'
 ,
 '78c679'
 ,
 '238443'
 ],

 min
 :

 0
 ,

 max
 :

 100

 }
 };
 fvLayer
 .
 setVisParams
 (
 visParams
 );
 fvLayer
 .
 setName
 (
 'LUCAS herbaceous cover 2022'
 );
 Map
 .
 setCenter
 (
 -
 6.0
 ,

 37.0
 ,

 10
 );
 Map
 .
 add
 (
 fvLayer
 );