
Page Summary
-
The MODIS Surface Reflectance products estimate surface spectral reflectance as measured at ground level, corrected for atmospheric effects.
-
MOD09GQ version 6.1 provides bands 1 and 2 at a 250m resolution in a daily gridded L2G product.
-
This dataset is available from 2000-02-24 to 2025-10-14 with a daily cadence.
-
MODIS data acquired through the LP DAAC have no restrictions on subsequent use.
-
The dataset includes bands for surface reflectance, quality assurance, and observation information.
- Dataset Availability
- 2000-02-24T00:00:00Z–2026-06-10T00:00:00Z
- Dataset Producer
- NASA LP DAAC at the USGS EROS Center
- Cadence
- 1 Day
- Tags
Description
The MODIS Surface Reflectance products provide an estimate of the surface spectral reflectance as it would be measured at ground level in the absence of atmospheric scattering or absorption. Low-level data are corrected for atmospheric gases and aerosols. MOD09GQ version 6.1 provides bands 1 and 2 at a 250m resolution in a daily gridded L2G product in the Sinusoidal projection, including a QC and five observation layers. This product is meant to be used in conjunction with the MOD09GA where important quality and viewing geometry information is stored.
Documentation:
Bands
Bands
Pixel size: 250 meters (all bands)
num_observations
Number of observations per 250m pixel
sur_refl_b01
Surface reflectance band 1
sur_refl_b02
Surface reflectance for band 2
QC_250m
Surface reflectance quality assurance
obscov
Observation coverage percent
iobs_res
Observation number
orbit_pnt
Orbit pointer
granule_pnt
Granule pointer
Terms of Use
Terms of Use
MODIS data and products acquired through the LP DAAC have no restrictions on subsequent use, sale, or redistribution.
Citations
-
Please visit LP DAAC 'Citing Our Data' page for information on citing LP DAAC datasets.
DOIs
Explore with Earth Engine
Code Editor (JavaScript)
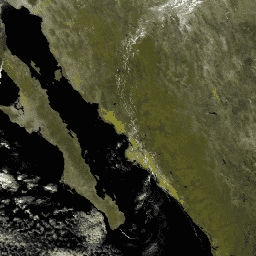
 var

 dataset

 =

 ee
 .
 ImageCollection
 (
 'MODIS/061/MOD09GQ'
 )

 .
 filter
 (
 ee
 .
 Filter
 .
 date
 (
 '2018-01-01'
 ,

 '2018-05-01'
 ));
 var

 falseColorVis

 =

 {

 min
 :

 -
 100.0
 ,

 max
 :

 8000.0
 ,

 bands
 :

 [
 'sur_refl_b02'
 ,

 'sur_refl_b02'
 ,

 'sur_refl_b01'
 ],
 };
 Map
 .
 setCenter
 (
 6.746
 ,

 46.529
 ,

 2
 );
 Map
 .
 addLayer
 (
 dataset
 ,

 falseColorVis
 ,

 'False Color'
 );
 import

 ee
 import

 geemap.core

 as

 geemap
Colab (Python)
 dataset
 =
 ee
 .
 ImageCollection
 (
 'MODIS/061/MOD09GQ'
 )
 .
 filter
 (
 ee
 .
 Filter
 .
 date
 (
 '2018-01-01'
 ,
 '2018-05-01'
 )
 )
 false_color_vis
 =
 {
 'min'
 :
 -
 100
 ,
 'max'
 :
 8000
 ,
 'bands'
 :
 [
 'sur_refl_b02'
 ,
 'sur_refl_b02'
 ,
 'sur_refl_b01'
 ],
 }
 m
 =
 geemap
 .
 Map
 ()
 m
 .
 set_center
 (
 6.746
 ,
 46.529
 ,
 2
 )
 m
 .
 add_layer
 (
 dataset
 ,
 false_color_vis
 ,
 'False Color'
 )
 m