
Page Summary
-
The VNP15A2H dataset provides VIIRS Leaf Area Index (LAI) and Fraction of Photosynthetically Active Radiation (FPAR) data at 500 meter resolution.
-
The data is available from 2012-01-17 to 2025-09-30 with an 8-day cadence.
-
This product is designed to promote continuity with the MODIS LAI/FPAR operational algorithm.
-
The dataset includes bands for FPAR, LAI, and associated quality control and standard deviation information.
-
NASA data from LP DAAC is freely accessible, with a request to cite the datasets when used in publications.
- Dataset Availability
- 2012-01-17T00:00:00Z–2026-05-17T00:00:00Z
- Dataset Producer
- NASA LP DAAC at the USGS EROS Center
- Cadence
- 8 Days
- Tags
Description
The Visible Infrared Imaging Radiometer Suite (VIIRS) Leaf Area Index (LAI) and Fraction of Photosynthetically Active Radiation (FPAR) Version 1 data product provides information about the vegetative canopy layer at 500 meter resolution (VNP15A2H). The VIIRS sensor is located onboard the NOAA/NASA joint Suomi National Polar-Orbiting Partnership (Suomi NPP) satellite. LAI is an index that quantifies the one-sided leaf area of a canopy, while FPAR is the fraction of incoming solar energy absorbed through photosynthesis at 400 to 700 nanometers. This product is intentionally designed after the Terra and Aqua Moderate Resolution Imaging Spectroradiometer (MODIS) LAI/FPAR operational algorithm to promote the continuity of the Earth Observation System (EOS) mission.
Documentation:
Bands
Bands
Pixel size: 500 meters (all bands)
Fpar
Fraction of Photosynthetically Active Radiation.
FparExtra_QC
Pass-through Quality Control (QC) for FPAR
FparLai_QC
Quality for LAI and FPAR
FparStdDev
Standard deviation of FPAR
Lai
Leaf Area Index
LaiStdDev
Standard deviation for LAI
Terms of Use
Terms of Use
LP DAAC NASA data are freely accessible; however, when an author publishes these data or works based on the data, it is requested that the author cite the datasets within the text of the publication and include a reference to them in the reference list.
Citations
-
Please visit LP DAAC 'Citing Our Data' page for information on citing LP DAAC datasets.
DOIs
Explore with Earth Engine
Code Editor (JavaScript)
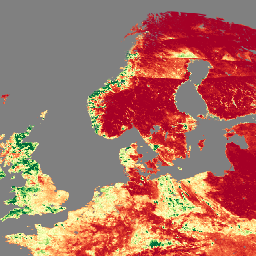
 var

 dataset

 =

 ee
 .
 ImageCollection
 (
 'NASA/VIIRS/002/VNP15A2H'
 )

 .
 filter
 (
 ee
 .
 Filter
 .
 date
 (
 '2022-11-01'
 ,

 '2022-12-01'
 ));
 var

 visualization

 =

 {

 bands
 :

 [
 'Lai'
 ],

 min
 :

 [
 0
 ],

 max
 :

 [
 4
 ],

 palette
 :

 [

 'a50026'
 ,

 'd73027'
 ,

 'f46d43'
 ,

 'fdae61'
 ,

 'fee08b'
 ,

 'ffffbf'
 ,

 'd9ef8b'
 ,

 'a6d96a'
 ,

 '66bd63'
 ,

 '1a9850'
 ,

 '006837'
 ,

 ]
 };
 Map
 .
 setCenter
 (
 41.2
 ,

 38.84
 ,

 3
 );
 Map
 .
 addLayer
 (
 dataset
 ,

 visualization
 ,

 'Leaf Area Index (LAI)'
 );