
Page Summary
-
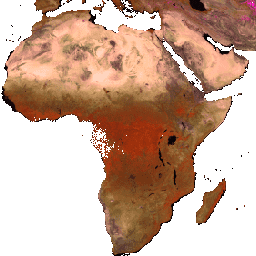
This dataset provides MODIS 2-year Nadir BRDF-Adjusted Reflectance (NBAR) mosaics from 2001 to 2017 with annual cadence.
-
The mosaics are created using high-quality observations from the MODIS 8-Day 500 meter BRDF-Albedo Quality product and the 8-day 500 meter Nadir BRDF-Adjusted Reflectance imagery product.
-
The dataset includes 7 bands representing Nadir Reflectance at local solar noon across different wavelengths.
-
MODIS data acquired through the LP DAAC has no restrictions on subsequent use, sale, or redistribution.
-
This dataset has been used for generating aboveground biomass/carbon maps and for capacity building in tropical countries.
- Dataset Availability
- 2001-01-01T00:00:00Z–2017-01-01T00:00:00Z
- Dataset Producer
- Baccini, A. (Woods Hole Research Center), Sulla-Menashe, D. (Boston University)
- Cadence
- 1 Year
- Tags
Description
The mosaics are created by using the MODIS 8-Day 500 meter BRDF-Albedo Quality product. Data Quality flags are used to select the best observations from the MODIS 8-day 500 meter Nadir BRDF-Adjusted Reflectance imagery product. This specific mosaic picks observations from the three highest quality categories over a 2-year period of MODIS data.
The MODIS NBAR annual mosaics have been used by government agencies and NGOs in tropical countries as input to generate aboveground biomass/carbon maps. The Woods Hole Research Center has been using the dataset for country capacity building and technical training workshops in tropical countries.
Bands
Bands
Pixel size: 463 meters (all bands)
| Name | Pixel Size | Wavelength | Description |
|---|---|---|---|
Nadir_Reflectance_Band1
|
463 meters | 620-670nm | Best NBAR at local solar noon for band 1 |
Nadir_Reflectance_Band2
|
463 meters | 841-876nm | Best NBAR at local solar noon for band 2 |
Nadir_Reflectance_Band3
|
463 meters | 459-479nm | Best NBAR at local solar noon for band 3 |
Nadir_Reflectance_Band4
|
463 meters | 545-565nm | Best NBAR at local solar noon for band 4 |
Nadir_Reflectance_Band5
|
463 meters | 1230-1250nm | Best NBAR at local solar noon for band 5 |
Nadir_Reflectance_Band6
|
463 meters | 1628-1652nm | Best NBAR at local solar noon for band 6 |
Nadir_Reflectance_Band7
|
463 meters | 2105-2155nm | Best NBAR at local solar noon for band 7 |
Terms of Use
Terms of Use
MODIS data and products acquired through the LP DAAC have no restrictions on subsequent use, sale, or redistribution.
Citations
-
Baccini, A., Laporte, N., Goetz, S. J., Sun, M., & Dong, H. (2008). A first map of tropical Africa's above-ground biomass derived from satellite imagery. Environmental Research Letters, 3(4), 045011. doi:10.1088/1748-9326/3/4/045011
DOIs
Explore with Earth Engine
Code Editor (JavaScript)
 var

 dataset

 =

 ee
 .
 ImageCollection
 (
 'WHBU/NBAR_2YEAR'
 );
 Map
 .
 addLayer
 (
 dataset
 .
 mean
 (),

 {
 min
 :
 0
 ,

 max
 :
 7000
 });