
Page Summary
-
Use
image.reduceRegion()to get statistics of pixel values within a specified region of anee.Image. -
The region for reduction is defined by a
Geometry, which can be a polygon or a point. -
The reduction output is a statistic or other compact representation of the pixel data, such as a histogram, in a Dictionary format.
-
When using
reduceRegion(), you should always specify thescaleparameter or a CRS and CRS transform. -
The
maxPixelsparameter is used to prevent errors due to too many pixels in the region; you can increase it, increase thescale, or setbestEffortto true to avoid this error.
reduceRegion
To get statistics of pixel values in a region of an ee.Image
, use image.reduceRegion()
.
This reduces all the pixels in the region(s) to a
statistic or other compact representation of the pixel data in the region (e.g.
histogram). The region is represented as a Geometry
, which might be a
polygon, containing many pixels, or it might be a single point, in which case there will
only be one pixel in the region. In either case, as illustrated in Figure 1, the output
is a statistic derived from the pixels in the region.
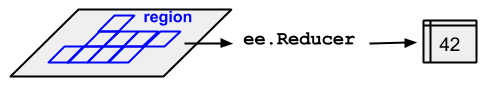
ee.Reducer
applied to an image
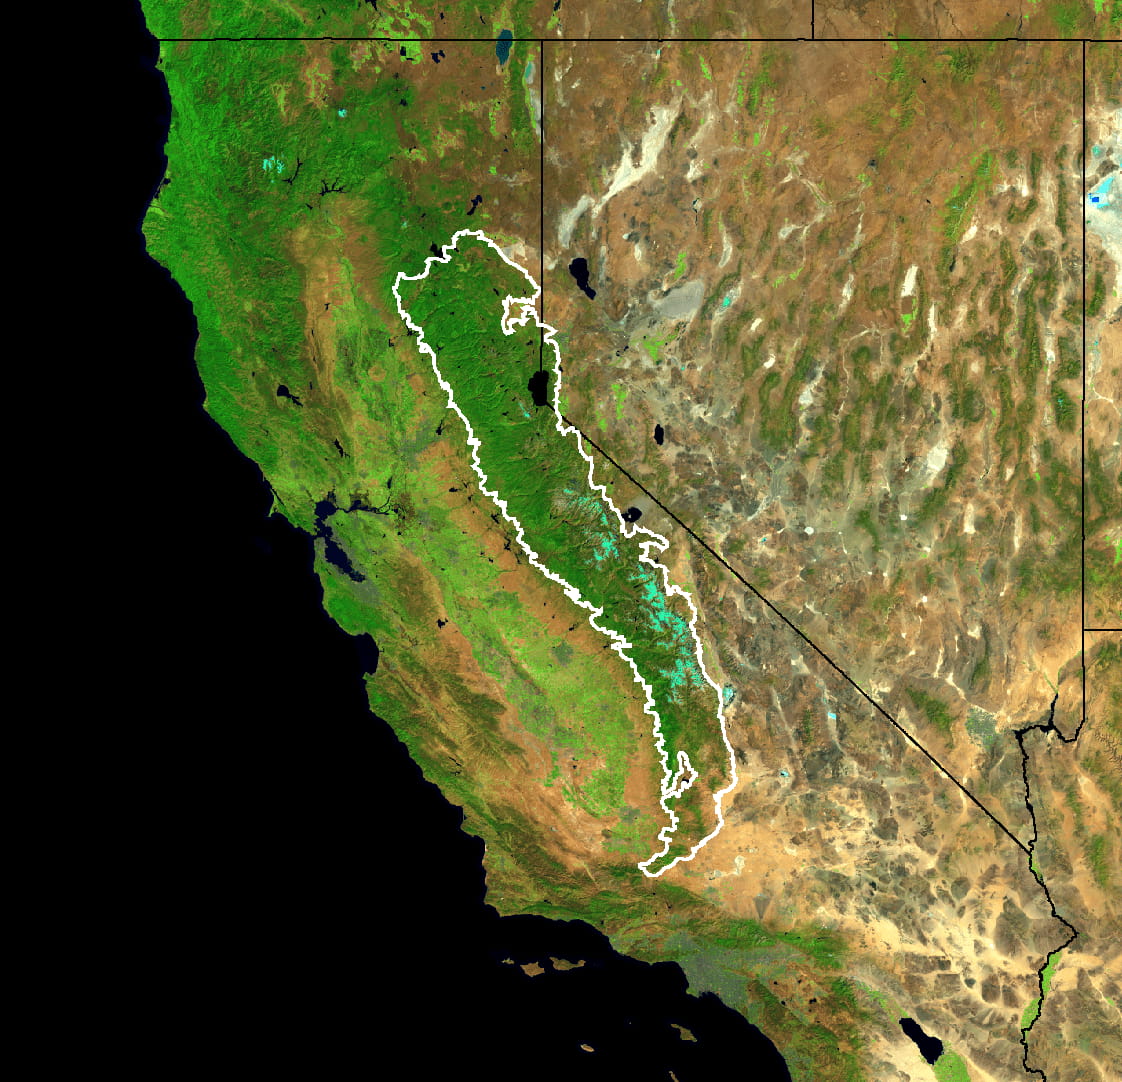
and a region.For an example of getting pixel statistics in a region of an image using reduceRegion()
, consider finding the mean spectral
values of a 5-year Landsat composite within the boundaries of the Sierra Nevada
Coniferous Forest (illustrated by Figure 2):
 //

 Load

 input

 imagery
 :

 Landsat

 7

 5
 -
 year

 composite
 .
 var

 image

 =

 ee
 .
 Image
 (
 'LANDSAT/LE7_TOA_5YEAR/2008_2012'
 );
 //

 Load

 an

 input

 region
 :

 Sierra

 Nevada
 .
 var

 region

 =

 ee
 .
 Feature
 (
 ee
 .
 FeatureCollection
 (
 'EPA/Ecoregions/2013/L3'
 )

 .
 filter
 (
 ee
 .
 Filter
 .
 eq
 (
 'us_l3name'
 ,

 'Sierra Nevada'
 ))

 .
 first
 ());
 //

 Reduce

 the

 region
 .

 The

 region

 parameter

 is

 the

 Feature

 geometry
 .
 var

 meanDictionary

 =

 image
 .
 reduceRegion
 ({

 reducer
 :

 ee
 .
 Reducer
 .
 mean
 (),

 geometry
 :

 region
 .
 geometry
 (),

 scale
 :

 30
 ,

 maxPixels
 :

 1e9
 });
 //

 The

 result

 is

 a

 Dictionary
 .

 Print

 it
 .
 print
 (
 meanDictionary
 );
To force the computation, it suffices to print the result, which the Code Editor will
display as a Dictionary
in the console. The output should look something like:
B1: 25.406029716816853
B2: 23.971497014238988
B3: 22.91059593763103
B4: 54.83164133293403
B5: 38.07655472573677
B6_VCID_2: 198.93216428012906
B7: 24.063261634961563
Note that in this example the reduction is specified by providing the reducer
( ee.Reducer.mean()
), the geometry
( region.geometry()
),
the scale
(30 meters) and maxPixels
for the maximum number of
pixels to input to the reducer. A scale should always be specified in reduceRegion()
calls. This is because in complex processing flows, which
may involve data from different sources with different scales, the scale of the output
will not be unambiguously determined from the inputs. In that case, the scale defaults
to 1 degree, which generally produces unsatisfactory results. See this
page
for more information about how Earth Engine handles scale.
There are two ways to set the scale: by specifying the scale
parameter,
or by specifying a CRS and CRS transform. (See the glossary
for
more information about CRS's and CRS transforms). For example, the meanDictionary
reduction (above) is equivalent to the following:
 //

 As

 an

 alternative

 to

 specifying

 scale
 ,

 specify

 a

 CRS

 and

 a

 CRS

 transform
 .
 //

 Make

 this

 array

 by

 constructing

 a

 4326

 projection

 at

 30

 meters
 ,
 //

 then

 copying

 the

 bounds

 of

 the

 composite
 ,

 from

 composite
 .
 projection
 ()
 .
 var

 affine

 =

 [
 0.00026949458523585647
 ,

 0
 ,

 -
 180
 ,

 0
 ,

 -
 0.00026949458523585647
 ,

 86.0000269494563
 ];
 //

 Perform

 the

 reduction
 ,

 print

 the

 result
 .
 print
 (
 image
 .
 reduceRegion
 ({

 reducer
 :

 ee
 .
 Reducer
 .
 mean
 (),

 geometry
 :

 region
 .
 geometry
 (),

 crs
 :

 'EPSG:4326'
 ,

 crsTransform
 :

 affine
 ,

 maxPixels
 :

 1e9
 }));
In general, specifying the scale is sufficient and results in more readable code. Earth Engine determines which pixels to input to the reducer by first rasterizing the region. If a scale is specified without a CRS, the region is rasterized in the image's native projection scaled to the specified resolution. If both a CRS and scale are specified, the region is rasterized based on them.
Pixels in the region
Pixels are determined to be in the region (and weighted) according to the following rules, applied in the specified scale and projection:
- Unweighted reducers(e.g.
ee.Reducer.count()oree.Reducer.mean().unweighted()): pixels are included if their centroid is in the region and the image's mask is non-zero. - Weighted reducers(e.g.
ee.Reducer.mean()): pixels are included if at least (approximately) 0.5% of the pixel is in the region and the image's mask is non-zero; their weight is the minimum of the image's mask and the (approximate) fraction of the pixel covered by the region.
The maxPixels
parameter is needed to get the computation to succeed. If this
parameter is left out of the example, an error is returned, which looks something like:
There are multiple options to get past these errors: increase maxPixels
,
as in the example, increase the scale
, or set bestEffort
to
true, which automatically computes a new (larger) scale such that maxPixels
is not exceeded. If you do not specify maxPixels
, the default value is used.