
Create dashboards, charts, and alerts
This document describes how to create charts and alerts to monitor BigQuery resources using Cloud Monitoring.
Before you begin
Before you use Cloud Monitoring, ensure that you have the following:
- A Cloud Billing account.
- A BigQuery project with billing enabled.
One way to ensure that you have both is to complete the Quickstart using the Google Cloud console .
View and create dashboards, charts, and alerts
View the Cloud Monitoring dashboard
To use Cloud Monitoring to monitor your BigQuery project:
-
In the Google Cloud console, go to the Monitoringpage.
-
Select the name of your project if it is not already selected at the top of the page.
-
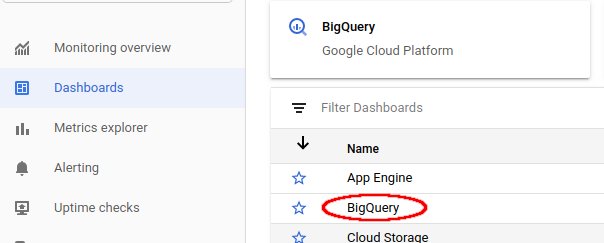
To view BigQuery resources, select Dashboards > BigQuery. On this page you see a list of tables, events, and incident reporting that are user-configurable as well as charts of project metrics or dataset metrics.
Visualize slots available and slots allocated
To visualize the slots available and slots allocated to your project, go to the dashboard for BigQuery described in Viewing the Cloud Monitoring dashboard :
-
In the Google Cloud console, go to the Monitoringpage.
-
Select Dashboards > BigQuery.
-
On the Cloud Monitoring dashboard for BigQuery, scroll to the chart named Slot Utilization.
The Slot Utilizationchart appears on both the main Cloud Monitoring default dashboard and the Cloud Monitoring dashboard for BigQuery.
Create a dashboard and chart
Display the metrics collected by Cloud Monitoring in your own charts and dashboards:
-
In the Google Cloud console, go to the Monitoringpage.
-
Select Dashboards > Create Dashboard.
-
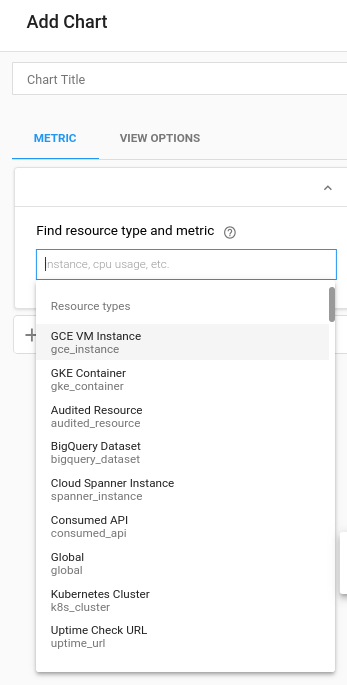
Click Add Chart. You see the Add Chart page:
-
In the Find resource type and metricpanel fields:
- For the Resource typedrop-down list, select Global. You might need to expand the list of Resource typesfor the Globaloption to be visible.
- For the Metricdrop-down list, select Query execution time.
-
The Aggregationpane fields control how the execution-time data are displayed. You can modify the default settings for these fields.
-
Click Save.
View quota usage and limits
In Cloud Monitoring, you can view metrics for quota usage and limits:
-
In the Google Cloud console, go to the Monitoringpage.
-
In the navigation pane, select
 Metrics explorer
.
Metrics explorer
. -
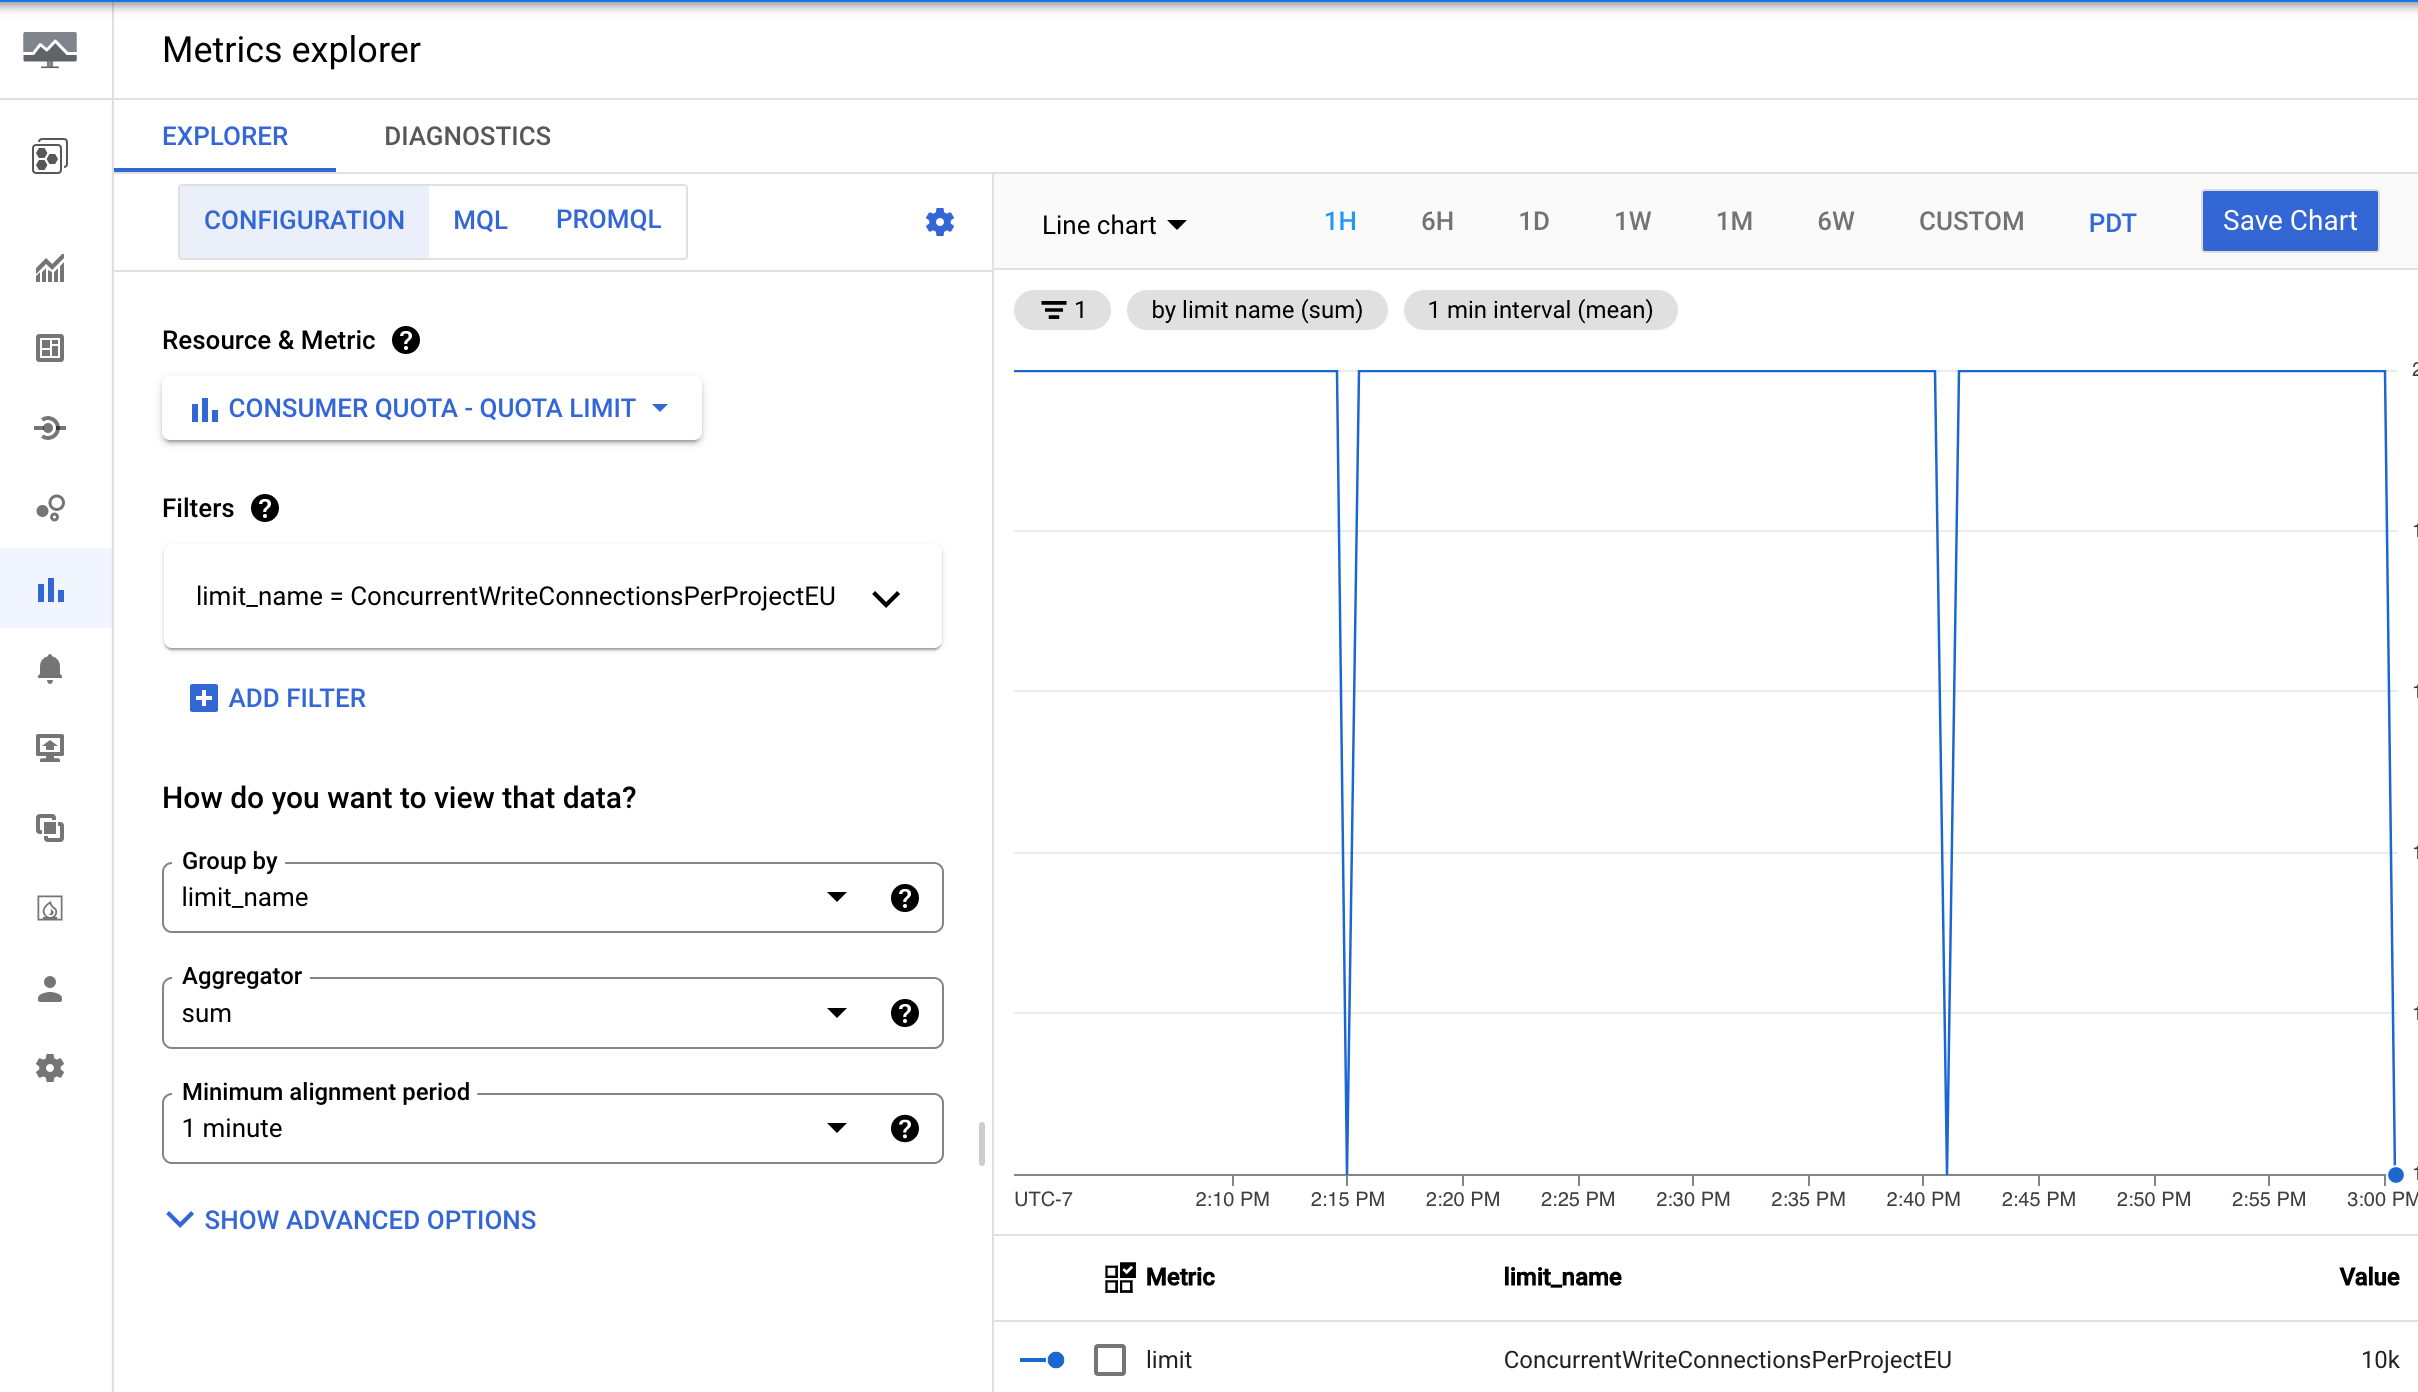
In the toolbar, select Explorer > Configuration.
-
In the Resource & Metricsection, click Select a metric.
-
Select Consumer Quota > Quota > Quota limit, and then click Apply.
-
Click Add filter, and then in the Labelmenu, select limit_name.
-
In the Valuemenu, select the quota for which you want to view the metrics.
Create an alert
To create an alerting policy that triggers when the 99th percentile of the execution time of a BigQuery query exceeds a user-defined limit, use the following settings.
| New condition
Field |
Value |
|---|---|
| Resource and Metric | In the Resources
menu, select BigQuery Project
. In the Metric categories menu, select Query . In the Metrics menu, select Query execution times . |
| Filter | |
| Across time series Time series group by |
priority
|
| Across time series Time series aggregation |
99th percentile
|
| Rolling window | 5 m
|
| Rolling window function | sum
|
| Configure alert trigger
Field |
Value |
|---|---|
| Condition type | Threshold
|
| Alert trigger | Any time series violates
|
| Threshold position | Above threshold
|
| Threshold value | You determine this value; however, a threshold of 60 seconds is recommended. |
| Retest window | most recent value
|
To create an alerting policy that triggers when the total scanned bytes billed for a BigQuery project exceeds a user-defined limit, use the following alerting policy configuration.
| New condition
Field |
Value |
|---|---|
| Resource and Metric | In the Resources
menu, select BigQuery Project
. In the Metric categories menu, select Query . In the Metrics menu, select Statement scanned bytes billed . |
| Filter | (No filter needed for a project-wide alert) |
| Across time series Time series group by |
(Leave blank to aggregate all series) |
| Across time series Time series aggregation |
sum
|
| Rolling window | 5 m
|
| Rolling window function | sum
|
| Configure alert trigger
Field |
Value |
|---|---|
| Condition type | Threshold
|
| Alert trigger | Any time series violates
|
| Threshold position | Above threshold
|
| Threshold value | You determine this value. For example, to trigger an alert when usage exceeds
1 TiB, enter 1000000000000
. |
While the alerting policy monitors the total bytes scanned, you can set a threshold based on a specific budget. To accomplish this budget based alerting policy, you must first convert your desired cost threshold into the equivalent number of bytes. The formula relies on the BigQuery on-demand compute pricing. For more information, see On-demand compute pricing .
You can use the following formula to convert your cost threshold into bytes:
Threshold in Bytes = (Target Amount / (price per TiB)) * 1,000,000,000,000
Example: Trigger an alert when usage exceeds $100
Let's say you want to be alerted when your project's query costs exceed $100.
- Calculate the equivalent data volume in TiB:
$100 / (price per TiB) = Equivalent Data Volume in TiB - Convert data volume to bytes:
(Equivalent Data Volume in TiB) * 1,000,000,000,000 = Threshold Value in Bytes - Set the Threshold Value:
In the Configure alert triggersection of your policy, enter the "Threshold Value in Bytes" as the Threshold value.
Now, your alerting policy triggers when the total scanned bytes billed in the rolling window corresponds to approximately $100in on-demand query costs.
Metrics available for visualization
The following metrics are available, time delayed up to several hours.
reason
to separate the count into different fallback reasons, including: -
NO_RESERVATION -
INSUFFICIENT_RESERVATION -
UNSUPPORTED_SQL_TEXT -
INPUT_TOO_LARGE -
OTHER_REASON
Slots are allocated per billing account and multiple projects can share the same reservation of slots.
Slots are allocated per billing account and multiple projects can share the same reservation of slots.
If the project shares a reservation of slots with other projects the slots being used by the other projects is not depicted.
INFORMATION_SCHEMA
.For a complete list of available Google Cloud metrics, see Google Cloud metrics .
Known issues
-
If no queries are running, then no data is returned for slots allocated, slots available, or any query-related variables. Zoom out to see data.
-
If queries are running in both the US and the EU, then slots allocated and slots available might be incorrect.
-
Slots allocated is reported as the average value in a time window (the width of the time window depends on the zoom level of the chart). Zooming in and out can change the value of slots allocated. Zooming in to a time window of 1 hr or less shows the true values of slots allocated. At this range for any time visible on the chart,
avg(slots allocated) = slots allocated. -
The data in Cloud Monitoring charts pertains only to the selected project.
-
Metrics are instantaneous values, sampled at a point in time, and might miss data points between sample intervals. For example, the job count metric is sampled every minute. The value is the number of jobs at that particular time, not the maximum number of jobs throughout the entire minute.