
| title | Catchpoint data pipeline to Cloud Monitoring |
|---|---|
| description | Learn to ingest data from Catchpoint into Cloud Monitoring for visualization and analysis with Metrics Explorer. |
| author | drit |
| tags | telemetry, probes, monitors |
| date_published | 2021-04-20 |
Dritan Suljoti | Chief Product and Technology Officer | Catchpoint Systems, Inc.
Contributed by the Google Cloud community. Not official Google documentation.
Catchpoint’s digital experience monitoring platform provides an extensive fleet of network telemetry probes, as well as tools for capturing real user experience metrics, which give instant insight into the performance of networks, apps, and digital services. Cloud Monitoring provides visibility into the performance, uptime, and overall health of applications.
This tutorial and its companion tutorial provide two methods of ingesting and visualizing data from Catchpoint within Google Cloud:
- This tutorial shows you how to set up a pipeline that ingests data captured by Catchpoint into Cloud Monitoring and use Metrics Explorer for visualization and analysis.
- The companion tutorial shows you how to deliver data to Grafana for visualization and analysis.
This tutorial uses Node.js, the Cloud Console, and the Cloud SDK command line.
The data flow from Catchpoint to Cloud Monitoring is illustrated in the following diagram:

- Catchpoint posts data to a Cloud Function (HTTP webhook).
- The Cloud Function uses Pub/Sub to propagate the data to configured channels.
- Cloud Monitoring receives the data from the Pub/Sub channel, where it's available for visualization using Metrics Explorer
Objectives
- Set up the Google Cloud data pipeline.
- Configure Catchpoint.
- Set up Cloud Monitoring.
- Configure Metrics Explorer in Cloud Monitoring.
Costs
This tutorial uses billable components of Google Cloud, including the following:
Use the pricing calculator to generate a cost estimate based on your projected usage.
Initial setup
-
Create a new Google Cloud project or select an existing project.
For information about creating and selecting projects, see Creating and managing projects .
You need the Google Cloud project ID when you configure the Catchpoint script.
-
Install the Cloud Monitoring Client Libraries and set up authentication.
For details, see Cloud Monitoring Client Libraries .
-
Enable the Monitoring API v3 and authorize users.
For details, see Enabling the Monitoring API .
-
Enable the Cloud Functions and Pub/Sub APIs.
For details, see Cloud Pub/Sub Tutorial .
Set up the Google Cloud data pipeline
-
Clone the repository with the integration between Catchpoint and Cloud Monitoring (formerly Stackdriver ) to your local machine.
The
Stackdriver-Webhookfolder has the required Node.js script to set up the ingestion of data and writing of data to Cloud Monitoring. -
Edit
Stackdriver-Webhook/.envand update the value of theGoogleProjectIdvariable to the project ID for your Google Cloud project.For more information about environment variables, see Using environment variables .
-
On the Cloud SDK command line, go to the directory where you cloned the Node.js scripts:
cd [PATH_TO_CLONED_DIRECTORY] -
Set the project property to the current project:
gcloud config set project [YOUR_PROJECT_ID] -
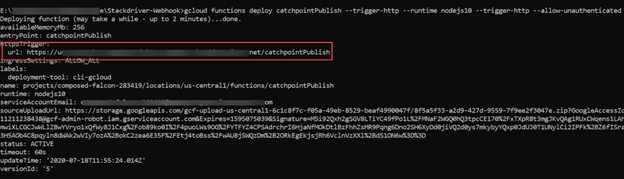
Deploy the Catchpoint publish function:
 gcloud functions deploy catchpointPublish \
  --trigger-http \
  --runtime nodejs10 \
  --trigger-http \
  --allow-unauthenticated
This function creates a topic using the
TopicNamevalue from the.envfile. By default, this name iscatchpoint-webhook. If you want to use a different name, then you must change this value in the.envfile before running the command. -
Capture the HTTP Trigger URL after the deployment is successful.
You need this when configuring Catchpoint.
-
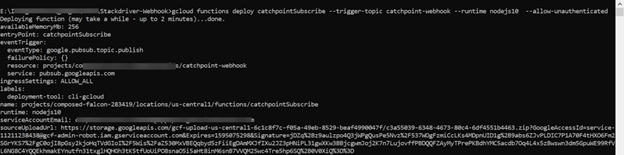
Deploy the Catchpoint subscribe function:
 gcloud functions deploy catchpointSubscribe \
  --trigger-topic catchpoint-webhook \
  --runtime nodejs10 \
  --allow-unauthenticated \
This command assumes that you have used the default topic name,
catchpoint-webhook. If you used a different topic name, then replace the topic name in this command with yours.
Configure Catchpoint
-
Go to Catchpoint API Detail .
For more information, see Catchpoint Webhook document .
-
Click Add URLunder Test Data Webhook.
-
In the URL field, enter the HTTP Trigger URL that you generated in the previous section.
-
Under Formateither choose JSONto have Catchpoint send its default data payload in JSON format, or choose Templateto customize the data payload.
If you chose Template, then do the following:
- Click Select Template.
- Click Add New.
- Enter a name for this template and select JSONas the format.
- Enter valid JSON specifying the format of the payload that will be posted to the webhook. Each value in the template is set using a macro, which will be replaced with actual data at run time. See Test Data Webhook Macros for all available options.
Here is a sample JSON template containing recommended macros:
{ "TestName": "${TestName}", "TestURL": "${testurl}", "TimeStamp": "${timestamp}", "NodeName": "${nodeName}", "PacketLoss": "${pingpacketlosspct}", "RTTAvg": "${pingroundtriptimeavg}", "DNSTime": "${timingdns}", "Connect": "${timingconnect}", "SSL": "${timingssl}", "SendTime": "${timingsend}", "WaitTime": "${timingwait}", "Total": "${timingtotal}" } -
Click Saveat the bottom of the page.
Set up Cloud Monitoring
-
In the Cloud Console, go to the Monitoringpage , and select Overview, which creates a Workspace.
-
Select Metrics Explorerin the Monitoringnavigation pane.
-
Enter the monitored resource name in the Find resource type and metrictext box.

Catchpoint metrics are represented in Metrics Explorer using custom metrics with catchpoint_
prepended to their original names. For example, if a metric is
named DNS
in Catchpoint, the corresponding custom metric in Metrics Explorer is named catchpoint_DNS
.
You can filter your query results based on the Catchpoint node name and test ID, which are included as labels on each data point.
For more information on custom metrics, see Creating custom metrics .
At this point your data pipeline is fully configured and you can create custom charts and dashboards in Cloud Monitoring to visualize your Catchpoint data.
Cleaning up
To avoid incurring charges to your Google Cloud account for the resources used in this tutorial, you can delete the project:
- In the Cloud Console, go to the Projectspage.
- In the project list, select the project that you want to delete and click Delete.
- In the dialog, type the project ID, and then click Shut downto delete the project.
