
Suppose you are a school administrator and that you store information about the classes offered, the students who enroll in those classes, and the grades they receive in each class. You can use Looker Studio to track and visualize this information by using data blending.
Questions to answer
This example answers the following questions that you might have about the data:
- Which students took which classes, and what grade did each student receive in each class?
- What was the highest grade received in each class?
- Which student received the highest grade in each class?
Sample data
Here's the data used in the examples.
Classes:
| class_id |
class_name |
|---|---|
| c1 |
Underwater basket weaving |
| c2 |
Home fusion made easy |
| c3 |
How to train an attack iguana |
| c4 |
Learn SQL for fun and profit |
Students:
| student_id |
student_name |
|---|---|
| s1 |
Brett |
| s2 |
Rick |
| s3 |
Susanna |
| s4 |
Jennifer |
Grades:
| student_id |
class_id |
grade |
|---|---|---|
| s1 |
c1 |
2 |
| s2 |
c1 |
99 |
| s3 |
c1 |
65 |
| s4 |
c1 |
3 |
| s2 |
c2 |
38 |
| s3 |
c2 |
88 |
| s4 |
c2 |
48 |
| s1 |
c3 |
7 |
| s4 |
c3 |
32 |
| s1 |
c4 |
94 |
| s2 |
c4 |
63 |
| s3 |
c4 |
75 |
| s4 |
c4 |
20 |
Setup
The first step is to connect to your data by creating data sources in Looker Studio. The demonstration report uses Sheets for the underlying data, but you could also store this data in a database, such as BigQuery or MySQL.
- Create a new report.
- Add 3 data sources corresponding to the sample data:
- Classes
- Students
- Grades
Learn how to create and edit data sources .
Question 1: Students, classes, and grades received
Question: "Which students took which classes, and what grade did each student receive in each class?"
To answer this question, follow these steps:
- Create a new blend.
- Add a Gradestable with the following dimensions:
-
student_id -
class_id -
grade
-
- Add a Studentstable with the following dimensions:
-
student_id -
student_name
-
- Add a Classestable with the following dimensions:
-
class_id -
class_name
-
- Join Gradesto Studentswith
student_id. - Join Gradesto Classeswith
class_id. - Set both join operations to left outer.
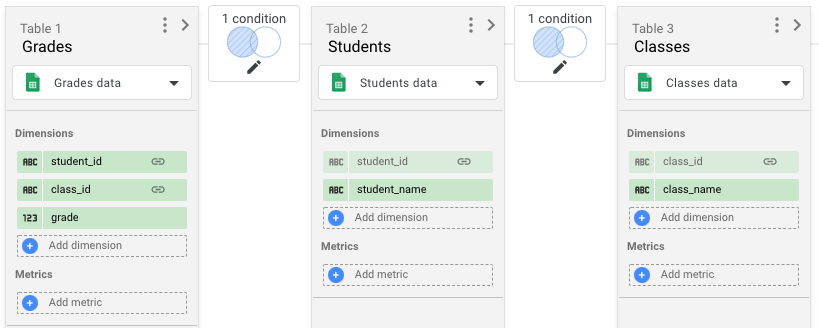
- Save the blend and close the editor.
- Add a table to the report with the
student_name,class_name, andgradefields. - Sort the table by
student_name, descending.
Your table should look like this:
| student_name | class_name | grade |
|---|---|---|
|
Brett
|
Underwater basket weaving | 2 |
|
Brett
|
How to train an attack iguana | 7 |
|
Brett
|
Learn SQL for fun and profit | 94 |
|
Jennifer
|
Underwater basket weaving | 3 |
|
Jennifer
|
Home fusion made easy | 48 |
|
Jennifer
|
How to train an attack iguana | 32 |
|
Jennifer
|
Learn SQL for fun and profit | 20 |
|
Rick
|
Underwater basket weaving | 99 |
|
Rick
|
Home fusion made easy | 38 |
|
Rick
|
Learn SQL for fun and profit | 63 |
|
Susanna
|
Underwater basket weaving | 65 |
|
Susanna
|
Home fusion made easy | 88 |
|
Susanna
|
Learn SQL for fun and profit | 75 |
Question 2: Highest grade by class
Question: "What was the highest grade received in each class?"
To answer this question, follow these steps:
- Use the same blend as in Question 1 .
- Add a table to the report.
- Add
class_nameas a dimension andgradeas a metric. - Edit the
gradefield as follows:- Change the name to
max_grade. - Set the aggregation to MAX.
- Change the name to
-
Sort the table by
max_grade, descending.
Your table should look like this:
| class_name | max_grade |
|---|---|
| Underwater basket weaving | 99 |
| Learn SQL for fun and profit | 94 |
| How to train an attack iguana | 32 |
| Home fusion made easy | 88 |
Question 3: Highest grade by student by class
Question:"Which student received the highest grade in each class?"
To answer this question, follow these steps:
- Create a new blend.
- Add a Classestable with the following dimensions:
-
class_id -
class_name
-
- Add a Gradestable, name it Grades 1, and add dimension
class_id. - Add
gradeas a metric, and set the aggregation to MAX. - Rename
gradetomax_grade. - Add the Gradestable again, name it Grades 2, and add dimensions:
-
student_id -
class_id -
grade
-
- Add a Studentstable, with dimensions:
-
student_id -
student_name
-
- Use left outerfor each join.
- Join Classesto Gradeswith
class_id. - Join Gradesto Grades 2with:
-
class_id = class_id -
max_grade = grade
-
-
Join Grades 2to Studentswith
student_id.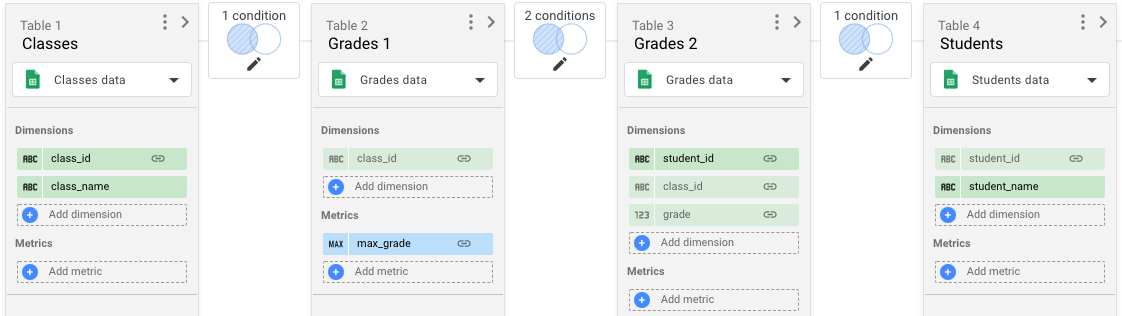
-
Save the blend and close the editor.
-
Add a table to the report with the
student_name,class_name, andmax_gradefields.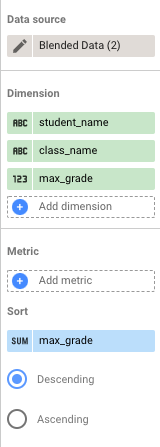
Your table should look like this:
| student_name | class_name | max_grade |
|---|---|---|
|
Rick
|
Underwater basket weaving | 99 |
|
Brett
|
Learn SQL for fun and profit | 94 |
|
Susanna
|
Home fusion made easy | 88 |
|
Jennifer
|
How to train an attack iguana | 32 |