
Use a line chart when you want to find trends in data over time. For example, get trends in sales or profit margins each month, quarter, or year.
Learn how to add & edit a chart .
How to format your data
- First column: Enter a label to describe the data. Labels from the first column show up on the horizontal axis.
- First row(Optional): In the first row of each column, enter a category name. Entries in the first row show up as labels in the legend.
- Other columns: For each column, enter numeric data. You can also add a category name (optional).
- Other cells: Enter the data points you’d like to display.
- Rows: Each row represents a different line in the chart.
Tip: If the chart doesn’t show the data on the axis you want, learn how to switch rows and columns .
Examples
Annual home sales

| Year | New construction | Existing |
|---|---|---|
|
2014
|
213,933 | 123,345 |
|
2015
|
196,334 | 145,899 |
|
2016
|
218,986 | 189,000 |
|
2017
|
355,698 | 200,433 |
|
2018
|
415,320 | 340,210 |
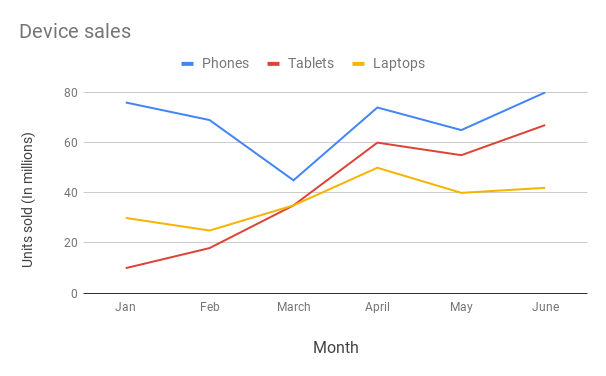
Monthly device sales
| Month | Phones | Tablets | Laptops |
|---|---|---|---|
|
Jan
|
76 | 10 | 30 |
|
Feb
|
69 | 18 | 25 |
|
March
|
45 | 35 | 35 |
|
April
|
74 | 60 | 50 |
|
May
|
65 | 55 | 40 |
|
June
|
80 | 67 | 42 |
Other types of line charts
Combo chart

Use a combo chart when you want to represent different data series using lines and bars.

How to format your data
- Format row and column data like a line chart .
Example
Income statement
| Year | Revenue | Net Income | Profit margin |
|---|---|---|---|
|
2014
|
$43,000 | $5,900 | 14% |
|
2015
|
$56,400 | $8,800 | 16% |
|
2016
|
$67,988 | $10,500 | 15% |
|
2017
|
$78,333 | $13,500 | 17% |
|
2018
|
$94,500 | $16,500 | 17% |
Customize a line chart
- On your computer, open a spreadsheet in Google Sheets .
- Double-click the chart you want to change.
- At the right, click Customize.
- Choose an option:
- Chart style : Change how the chart looks.
- Chart & axis titles : Edit or format title text.
- Series : Change line colors, axis location, or add error bars, data labels, or trendline .
- Legend : Change legend position and text.
- Horizontal axis : Edit or format axis text, or reverse axis order.
- Vertical axis : Edit or format axis text, set min or max value, or log scale.
- Gridlines : Add and edit gridlines.