
This page describes how to monitor AlloyDB instances using the following methods:
- Monitor an instance using the AlloyDB System insights dashboard.
- Monitor an instance using the Cloud Monitoring dashboard.
- View metrics on the AlloyDB cluster Overview page.
You can use Gemini Cloud Assist to help you monitor and troubleshoot your AlloyDB resources. For more information, see Monitor and troubleshoot with Gemini assistance .
Before you begin
To access the System insights dashboard, enable access to AlloyDB for PostgreSQL in your Google Cloud project .
Required roles
To use AlloyDB System insights, you need permissions to do the following:
- To access System insights, you need permissions to access the AlloyDB System insights dashboard.
- To edit System insights, you need permissions to update AlloyDB instances.
To get these permissions, ask your administrator to grant you one of the following roles:
- Basic viewer (
roles/viewer) - Database Insights viewer (
roles/databaseinsights.eventsViewer)
For more information about granting roles, see Manage access .
Monitor an instance using the AlloyDB System insights dashboard
The AlloyDB System insights dashboard displays metrics of the resources that you use and lets you monitor these resources and metrics.
In addition to the predefined dashboard generated by System insights, you can create a custom dashboard with the following customizations:
- Add or remove AlloyDB metrics
- Integrate metrics from other Google Cloud products, such as GKE Enterprise, to provide a more holistic view of your system
- Reorganize the dashboard layout
To view the AlloyDB System insights dashboard, do the following:
-
In the Google Cloud console, open the AlloyDBpage.
-
Click the name of a cluster to open its Overviewpage.
-
Select the System insightstab.
The AlloyDB System insights dashboard opens. It shows details about the cluster at the top followed by charts for the key metrics.
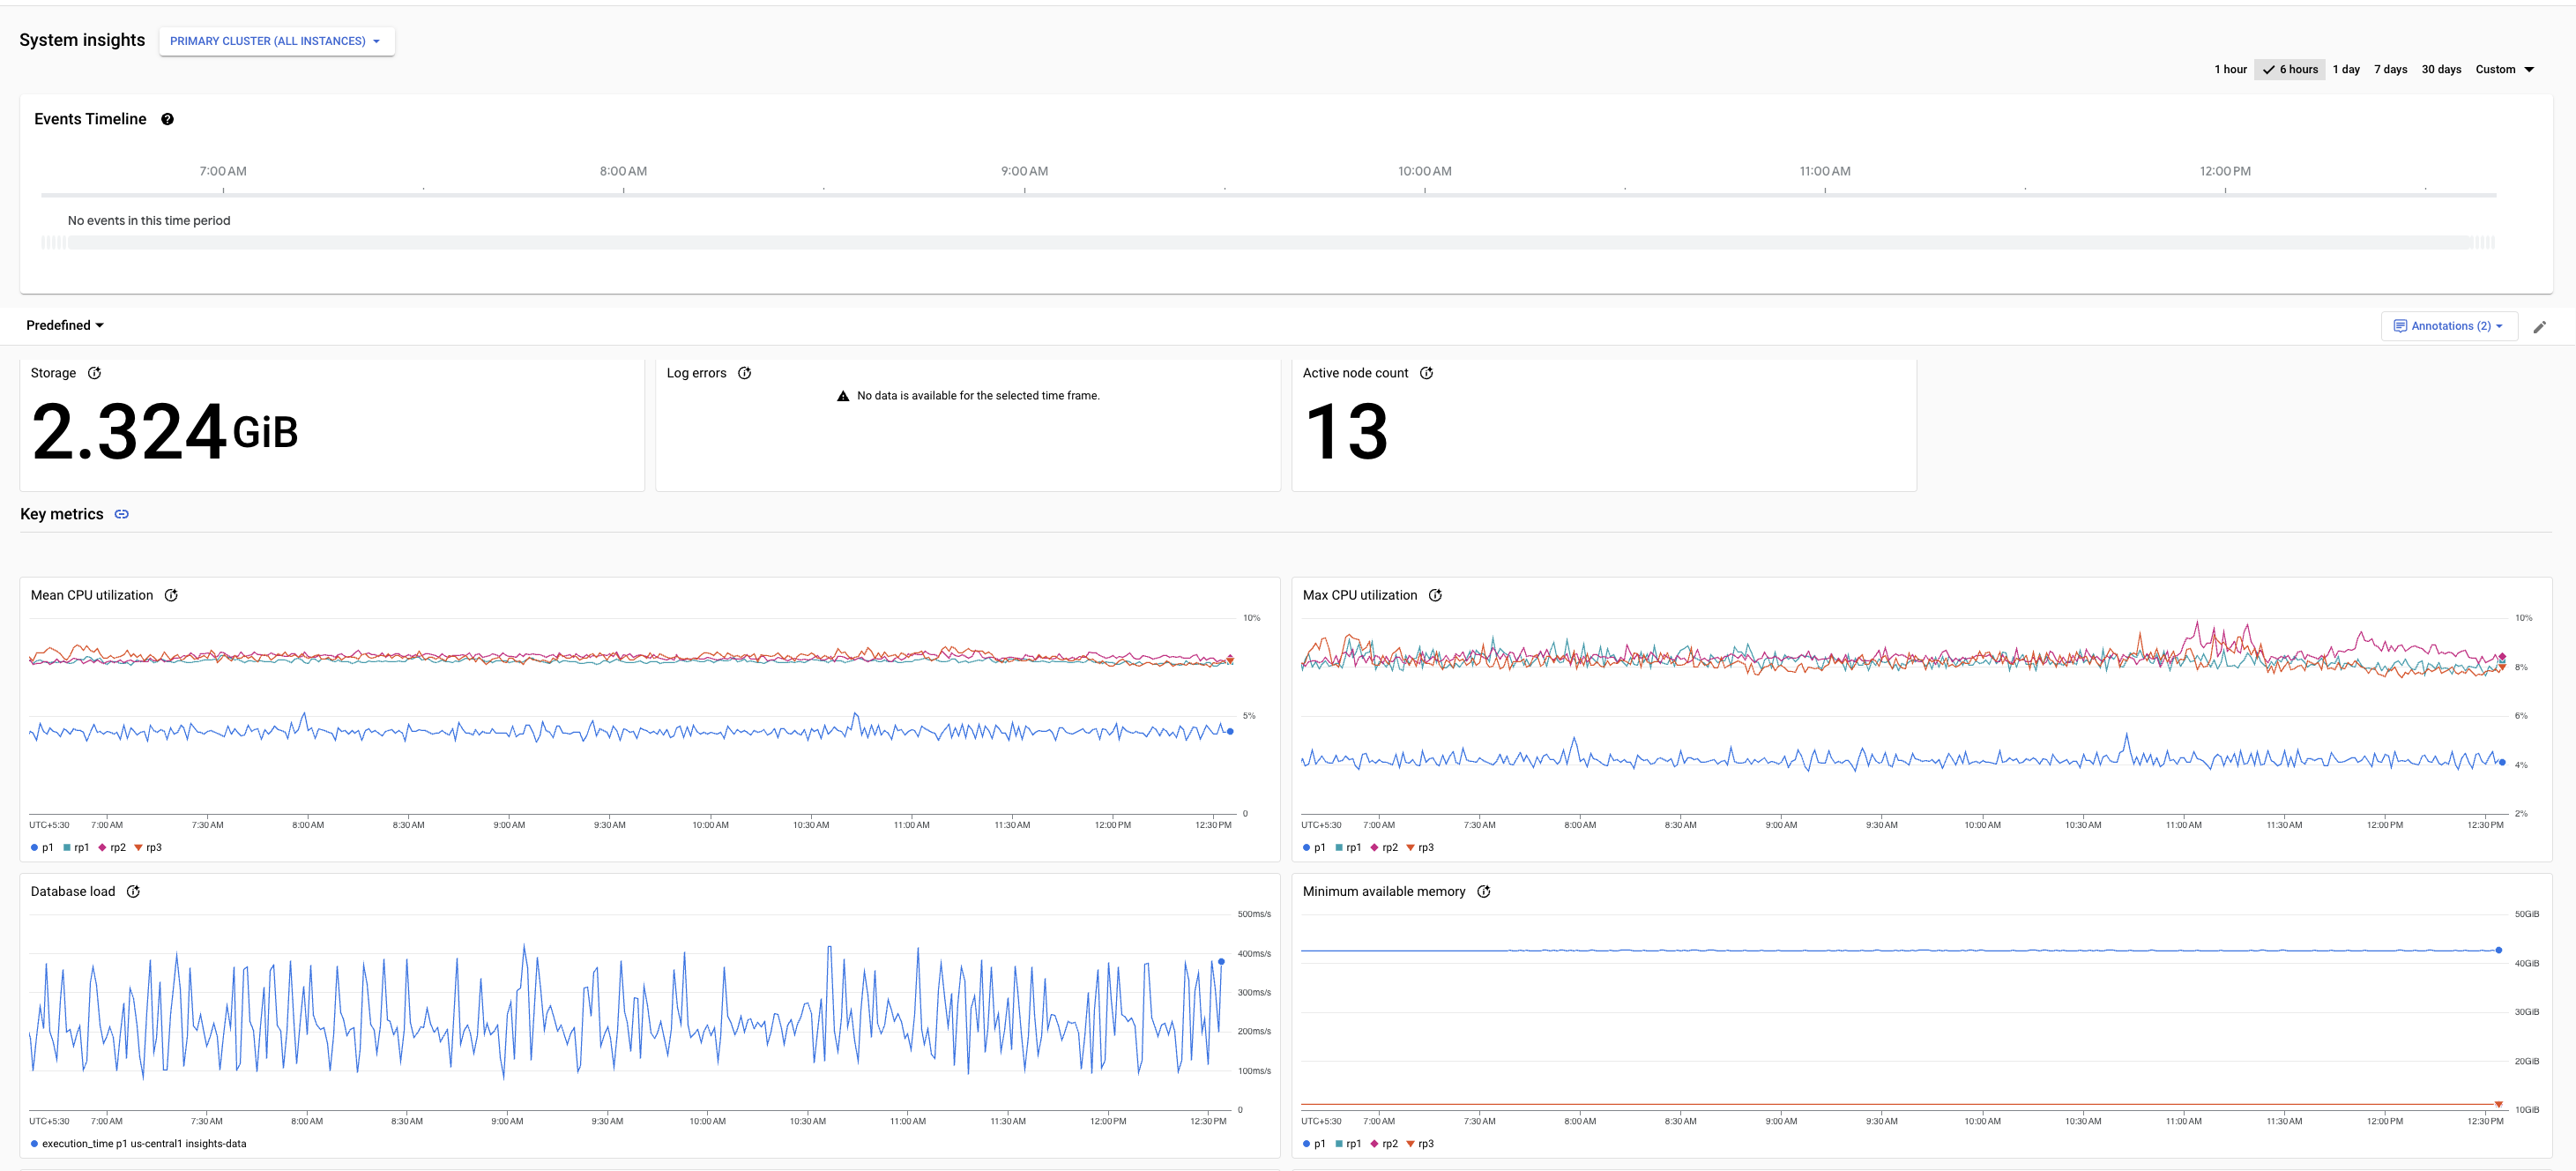
Predefined and custom dashboards include the following features:
-
By default, the Cluster (all instances)view is selected. You can choose to view metrics for the primary instance or for read pool instances.
-
The time selector shows
1 dayselected by default. To change the period, select one of the other predefined periods or click Customand define a start and end time. Data is available for the last 30 days.
Each dashboard includes the following sections:
-
The summary cards show the latest or aggregated values for some metrics, and provide an overview of the database health and performance during the selected period.
-
The metrics charts show information about important metrics that help you gain insights into resource usage such as CPU, memory, connections, replication, and storage, and respond proactively as your application needs change.
-
The system events show information that helps you evaluate the impact of system events on the health and performance of the instance.
Summary cards
The following table describes the summary cards displayed on the AlloyDB System insights dashboard. These cards provide an overview of the database health and performance during the selected period.
- Cluster dashboard
- Read pool instance dashboard
- Primary instance dashboard
- Read pool instance dashboard
- Cluster dashboard
- Primary instance dashboard
- Read pool instance dashboard
- Cluster dashboard
- Primary instance dashboard
- Read pool instance dashboard
- Primary instance dashboard
- Read pool instance dashboard
- Read pool instance dashboard
Metrics charts
The System insights dashboard provides metrics at the following levels:
- Primary cluster (All instances)
- Primary instance
- Individual read pool instances
To view the metrics for a specific level, click the Primary cluster (All instances)drop-down and select the corresponding dashboard.
For more information about metrics for each level, see System insights metrics reference .
A chart card for a sample metric appears as follows. 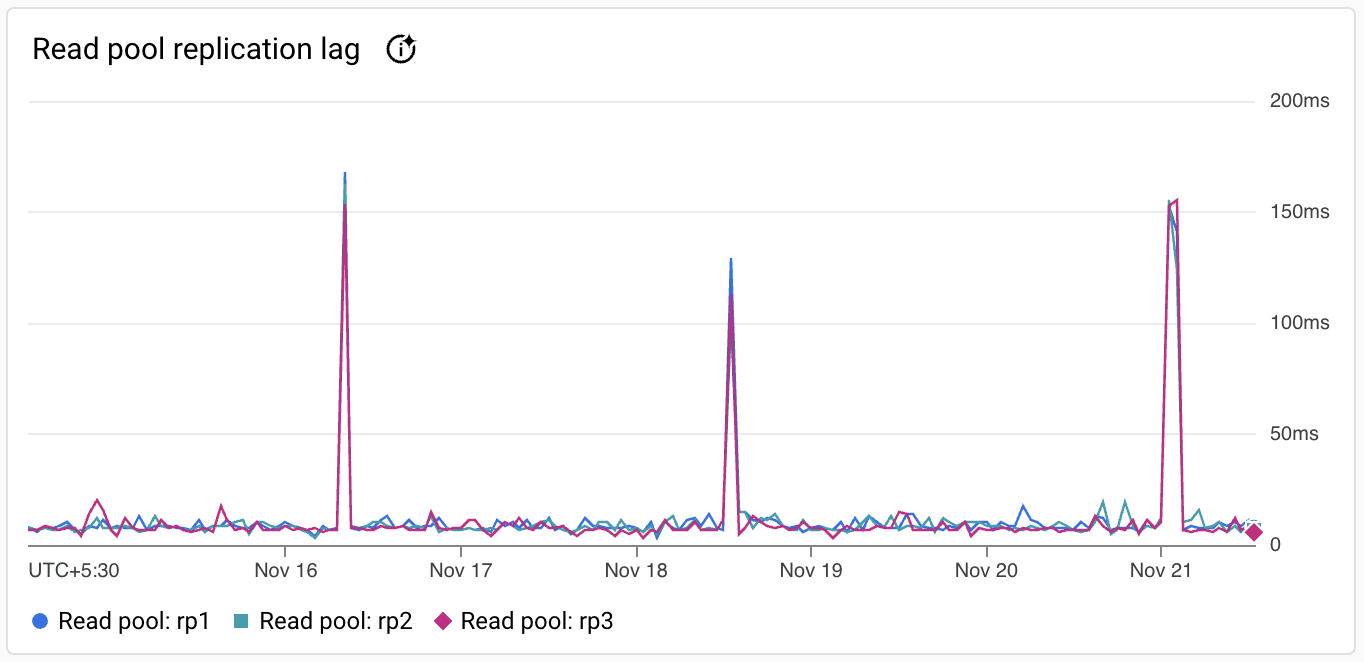
The toolbar on each chart card provides the following set of standard options:
-
To hide or display the legend, click More chart options, and then click Expand chart legend.
-
To view metric values for a specific moment in the selected period, move the cursor over the chart.
-
To view a chart in full-screen mode, click More chart options, and then click View in full screen.
-
To zoom a chart, click Explore data.
-
To view additional options, click more_vert . Most charts offer these options:
- Download a PNG image.
- Download a CSV file.
- View in Metrics Explorer. View the metric in Metrics Explorer . You can view other AlloyDB metrics in the Metrics Explorer by selecting the AlloyDB instanceresource type.
Events timeline
The dashboard provides details about the following events. System events appear in Events timelinewithin approximately 5 minutes after the event occurs.
| Event name | Description | Operation type |
|---|---|---|
Instance create
|
Creates an AlloyDB instance. | INSTANCE_CREATE
|
Instance update
|
Updates an AlloyDB instance. | INSTANCE_UPDATE
|
Instance restart
|
Restarts the AlloyDB instance. | INSTANCE_RESTART
|
Instance failover
|
Initiates a manual failover of a highly available primary instance for a standby instance to become the primary instance. | INSTANCE_FAILOVER
|
Cluster maintenance
|
Indicates that the cluster is in maintenance, and the instances become unavailable for a few minutes. | MAINTENANCE
|
Backup create
|
Creates a backup of an AlloyDB instance. | BACKUP_CREATE
|
Backup update
|
Updates a backup of an AlloyDB instance. | BACKUP_UPDATE
|
Cluster create
|
Creates an AlloyDB cluster. | CLUSTER_CREATE
|
Cluster update
|
Update an AlloyDB cluster. | CLUSTER_UPDATE
|
Cluster promote
|
Promotes a secondary cluster to primary cluster. | CLUSTER_PROMOTE
|
User create
|
Creates a new user. | USER_CREATE
|
User update
|
Update a user. | USER_UPDATE
|
User delete
|
Deletes a user. | USER_DELETE
|
Create a custom dashboard
The Predefineddashboard includes a set of default metrics. You can create additional widgets to add other metrics for AlloyDB or other Google Cloud products and get a unified monitoring view from within AlloyDB. For example, if you are using AlloyDB with Google Kubernetes Engine (GKE) Enterprise edition (GKE Enterprise), you can customize the predefined dashboard in addition to AlloyDB metrics, you can add required GKE Enterprise metrics, such as pod related metrics or node metrics.
You can create one custom dashboard in addition to the predefined dashboard.
To create a custom dashboard, follow these steps:
-
In the Google Cloud console, open the AlloyDBpage.
-
Click the name of a cluster to open its Overviewpage.
-
Select the System insightstab.
-
Click Predefined, and then click Customize Dashboard.
-
To add a metric to the dashboard follow these steps:
- In Custom view name, enter a name for the dashboard—for example,
my-custom-dashboard. -
Click Add Widget, and select a widget type to add a metric to the dashboard.
A configuration pane opens. For example, you can select the Metricwidget as the data, and then set the Visualizationto Stacked bar, or you can select the Stacked barwidget and then select the metric.
-
Configure the widget.
-
To save your customized dashboard, click Applyin the toolbar.
- In Custom view name, enter a name for the dashboard—for example,
Edit custom dashboard
- Hold your pointer on the dashboard, and then click Editto enter edit mode.
- To reposition a widget, click the widget header and drag it to a new location.
- To edit a widget, place your pointer on the dashboard, click Edit. To apply your changes to the dashboard, click Applyin the toolbar. To discard your changes, click Cancel.
- To delete a widget, hold your pointer on the widget, click More chart options, and then click Delete widget. To apply your changes to the dashboard, click Applyin the toolbar. To discard your changes, click Cancel.
- To save your modified dashboard, click Savein the toolbar.
You can see my-custom-dashboard
in the list of dashboards. To delete a dashboard, place your pointer on the widget, and then click
Delete
Monitor an instance using the Cloud Monitoring dashboard
Cloud Monitoring offers predefined dashboards for several Google Cloud products. You can also create your own custom dashboards to display data that is of interest to you and to monitor the general health of your primary and read pool instances.
Set up alerts
You can use Cloud Monitoring to set up alerts for a project or a specified instance.
For example, you can set up an alert for a message to be sent to specific email IDs when the Memory usagemetric for a AlloyDB instance exceeds the threshold of 80%.
View cluster metrics on the AlloyDB cluster Overview page
In the cluster Overview page, the cluster related metrics appear at the top of the page.
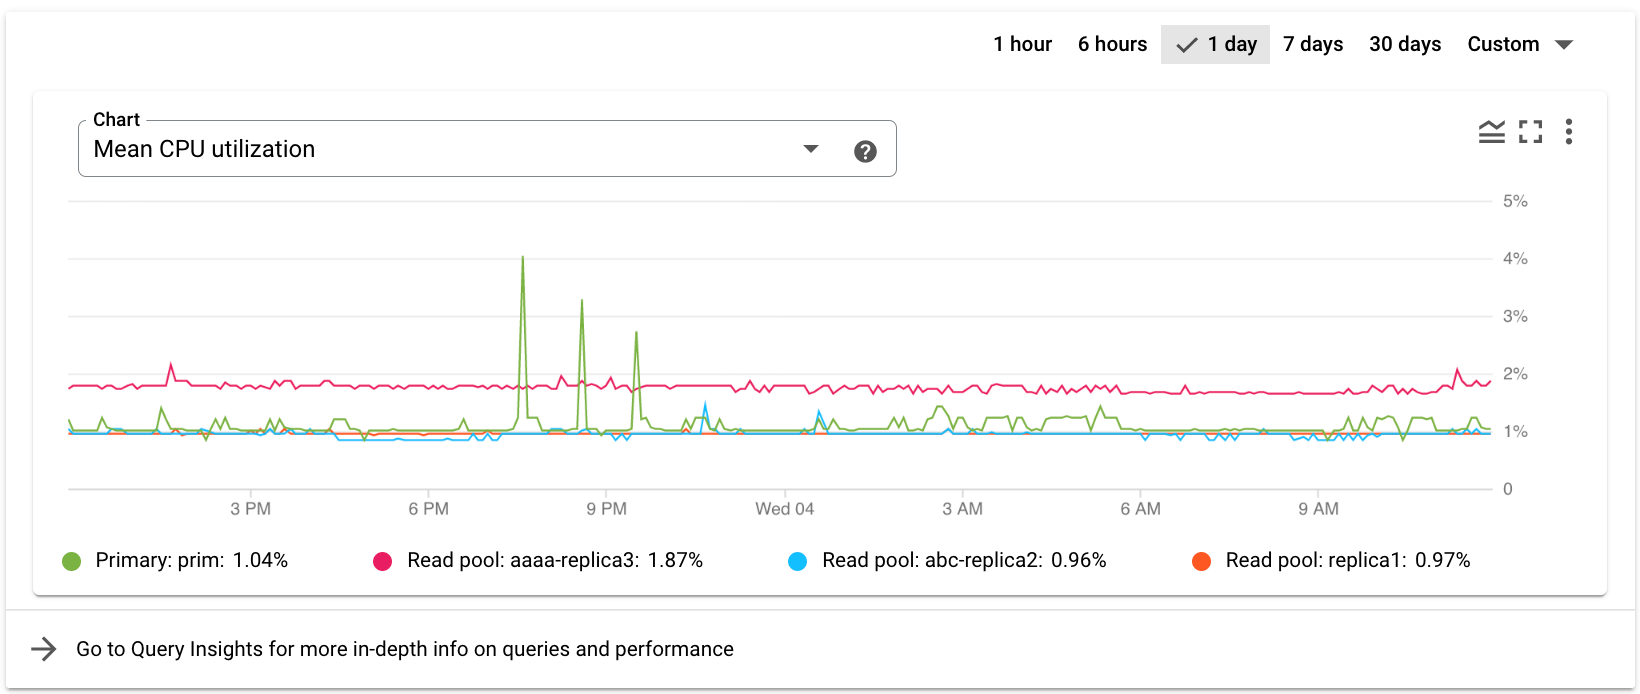
Select another metric from the Chart drop-down list. The chart shows the data for the selected metric.
What's next
- View the list of AlloyDB metrics .
- View System Insights reference .
- Use Query Insights to improve query performance.
- Learn more about Cloud Logging and Cloud Monitoring .
- Monitor active queries to identify causes of system latency and high CPU usage.