
Looker admins and users who have been granted the see_system_activity
permission have access to Looker's System Activity Explores in the Exploremenu
.
The System Activity Explores connect to Looker's underlying application database. They show information about your Looker instance, including Looks and dashboards saved on your instance, user information, historical query information, and instance performance statistics. Both the granularity and retention of System Activity data are subject to system constraints. System Activity is designed for collecting high-volume data, and aggregating it can be used to supplement your business logs.
By default, System Activity data is stored in Looker's internal database. Most tables are truncated on a regular schedule to comply with storage limits. For example, the History table is truncated to the past 90 days of data. Some tables have more stringent data retention policies. To increase data retention, consider using Elite System Activity .
It is not possible to query System Activity data using SQL Runner as permissions for Looker's internal database are limited.
System Activity Explores
These are the System Activity Explores:
| Explore Name | Description | Cache duration | More info |
|---|---|---|---|
| Data about API usage, including frequency of calls, latency, and the endpoints called. | 1 hour | ||
| Detailed, hourly summary of the volume and performance of API calls that are made to your Looker instance. | 1 hour | ||
| Data about Look and dashboard usage, including frequency of views, favoriting, scheduling, embedding, and access through the API. Also includes details about individual Looks and dashboards. | 12 hours | ||
|
DB Connection
|
Details about database connections. Includes information about users who have access to the database connections. | 1 hour | |
| Details about all dashboards and dashboard elements. Includes information about Looks, queries, roles, users, and folders that are associated with dashboards. | 12 hours | ||
|
Dashboard Performance
|
Performance and historical data about dashboards. | 1 hour | |
| Information about historical events within Looker, including the name, type, and frequency of each event. Includes information about groups and users who are connected to the events. | 1 hour | ||
| Information about the attributes that make up events . Includes the data in the EventExplore and adds attribute information. | 12 hours | ||
|
Field Usage
|
LookML fields and the number of times used. | 1 hour | |
|
Folders
|
Information about all folders, the content stored in each folder, and the creator of each folder. | 1 hour | |
|
Group
|
Listing of groups and details about those groups, including parent and child groups, and users and roles that belong to each group. | 1 hour | |
| Details about all queries run in the previous 90 days. | 12 hours | ||
| Details about all Looks. Includes information about dashboards, queries, users, and folders that are associated with Looks. | 12 hours | ||
| Information about merged queries , including fields and other elements of both the source and the merged queries. | 1 hour | ||
| Details about PDT builds, including time taken to finish builds, and the connection and model the PDTs are part of. | 1 hour | ||
|
PDT Event Log
|
Information about historical events related to PDTs, including PDT rebuilds and errors.See the Understanding PDT log actions documentation page for more information about viewing and understanding PDT log actions and their corresponding action data. | 12 hours | |
| A detailed analysis of query concurrency on your instance. | 12 hours | ||
| Detailed breakdowns of queries that are run from your Looker instance. | 1 hour | ||
|
Role
|
Looker roles and the model and permissions sets that make up the roles. | 1 hour | |
| SQL queries that have been run, including how recently and frequently, and details about users who have run them. | 1 hour | ||
| Information about all scheduled data deliveries, including both previously scheduled jobs and currently scheduled jobs. Includes data about the dashboards, Looks, queries, folders, and users that are associated with scheduled data deliveries. | 12 hours | ||
| Details about each user, including historical queries run, and the content and folders to which they have access. | 12 hours |
See the Using the System Activity Explores section on this page for some examples of common uses for the Content Usage , Dashboard , Event , Event Attribute , History , Look , Merge Query , PDT Builds , SQL Query , Scheduled Plan , and User Explores.
Using the System Activity Explores
Following are some examples of how you can use some of the Explores in System Activity, along with the answers to some common questions. You can access the example Explores in this section by replacing <instance_name.looker.com>
in the example URLs with the address of your Looker instance.
API Usage
The API UsageExplore provides a summary of the volume of API calls made to your Looker instance.
You can use the API UsageExplore to answer questions like the following:
- How can I get a daily audit of API calls?
- How many total API calls have been made on my instance this year?
How can I get a daily audit of API calls?
You can use the API UsageExplore to retrieve a list of all API calls made on your instance for any given time period. To see which calls were made on a given day, follow these steps:
- Select Endpointfrom API Usage.
- Select Total Usagefrom API Usage.
- Filter on Created Datefrom API Usagewith the selected date.
https://<instance_name.looker.com>/explore/system__activity/api_usage?fields=api_usage.endpoint,api_usage.total_usage&f[api_usage.created_date]=yesterday&sorts=api_usage.total_usage+desc&limit=500&column_limit=50&vis=%7B%7D&filter_config=%7B%22api_usage.created_date%22%3A%5B%7B%22type%22%3A%22advanced%22%2C%22values%22%3A%5B%7B%22constant%22%3A%22yesterday%22%2C%22unit%22%3A%22day%22%7D%2C%7B%7D%5D%2C%22id%22%3A5%2C%22error%22%3Afalse%7D%5D%7D&origin=share-expanded
Check the Looker API Reference or Looker API Explorer for more information about what each API call does.
How many API calls have been made on my instance this year?
You can use the API UsageExplore to aggregate the volume of API calls over any timeframe. For example, you can create a yearly report that shows how many API calls were made each month:
- Select Created Monthfrom API Usage.
- Select Total Usagefrom API Usage.
- Filter on Created Yearfrom API Usagewith the selected year.
https://<instance_name.looker.com>/explore/system__activity/api_usage?fields=api_usage.total_usage,api_usage.created_month&fill_fields=api_usage.created_month&f[api_usage.created_year]=last+year&sorts=api_usage.created_month+desc&limit=500&column_limit=50&vis=%7B%7D&filter_config=%7B%22api_usage.created_year%22%3A%5B%7B%22type%22%3A%22advanced%22%2C%22values%22%3A%5B%7B%22constant%22%3A%22last+year%22%2C%22unit%22%3A%22yr%22%7D%2C%7B%7D%5D%2C%22id%22%3A6%2C%22error%22%3Afalse%7D%5D%7D&origin=share-expanded
API Usage Hourly
The API Usage HourlyExplore provides a detailed, hourly summary of the volume and performance of API calls that are made to your Looker instance. This Explore offers greater granularity than the API UsageExplore, allowing for in-depth analysis of API latency and usage patterns over time.
Quick Start analyses
The API Usage HourlyExplore includes Quick Start analyses, which you can use to quickly answer questions or as starting points for other queries:
- API Usage by Endpoint: Total API requests for each API endpoint path, sorted from most to least frequent.
- API Latency Histogram: A histogram showing the distribution of API request durations across latency buckets.
- Slow API Endpoints: Finds API endpoints with the most requests that take 5 seconds or longer.
- API Usage Trends: Shows the trend of API requests over time, broken down by latency bucket.
How can I find the most used API endpoints?
You can use the API Usage by EndpointQuick Start to identify the most frequently used API endpoints and analyze their performance across different latency buckets. This analysis helps you understand which endpoints are called most often and how quickly they respond, which is useful for performance monitoring and optimization.
Content Usage
The Content UsageExplore in System Activity provides information about Look and dashboard usage, including frequency of views, favoriting, scheduling, and access through the API. It also includes details about individual Looks and dashboards.
Quick Start analyses
The Content UsageExplore includes Quick Start analyses, which you can use to quickly answer questions or as starting points for other queries.
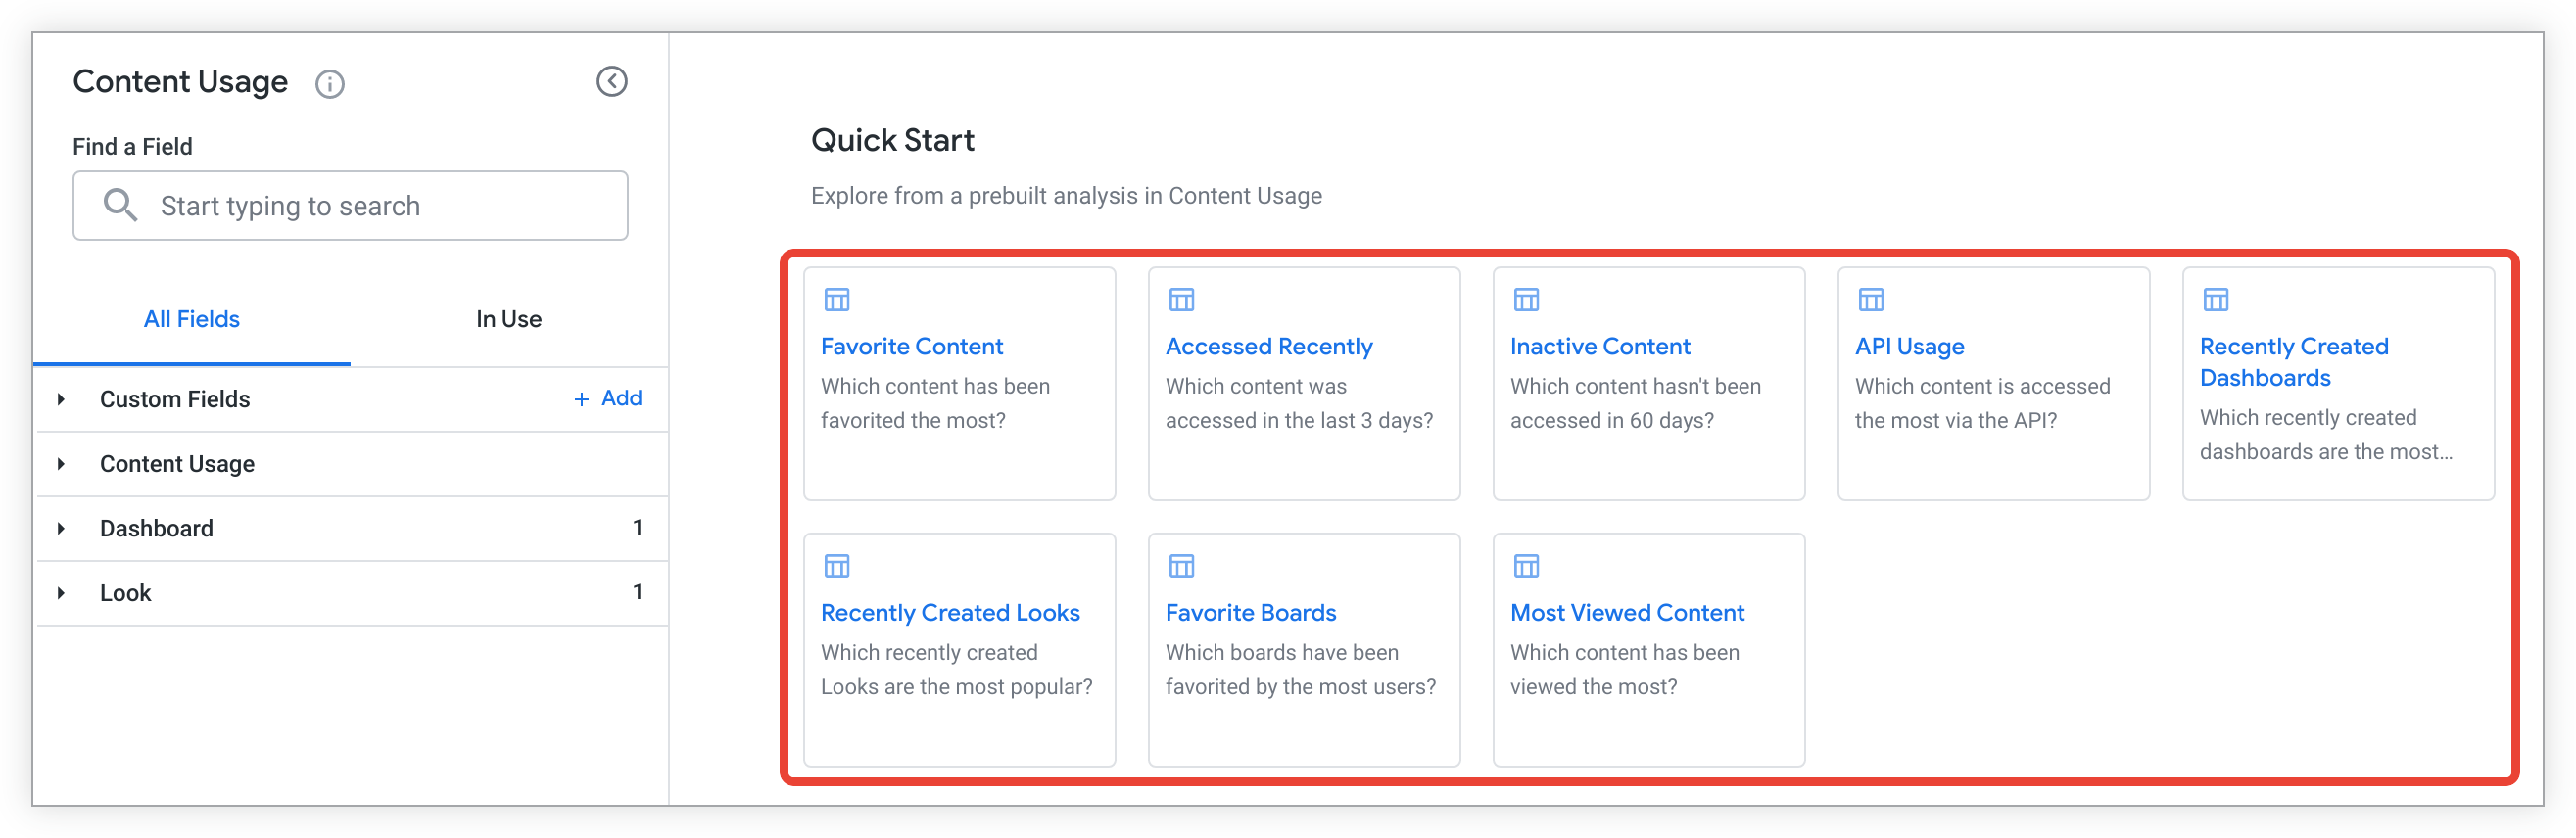
Select a Quick Start analysis tile in a blank Explore, or from the lightning bolt Quick Startmenu in an Explore that has run, and Looker will show a query with fields that are preselected and sorted to answer one of the following questions:
- Which content has been favorited the most times?
- Which content has been accessed in the previous 3 days?
- Which content has not been accessed in the past 60 days?
- Which content has been accessed most frequently using the Looker API ?
- Which dashboards created in the past 7 days are used the most?
- Which Looks created in the past 7 days are used the most?
- Which boards have been favorited the most times?
- Which content has been viewed the most times?
What filters are used by popular Looks and dashboards?
You can use the Content UsageExplore to find the most popular Looks or dashboards on your instance. You can then use the HistoryExplore to identify the filters used by popular Looks or dashboards. To find the most popular Looks or dashboards:
- In the Content UsageExplore, select Content ID, Content Title, and Content Typefrom the Content Usageview.
- Add a filter on Content Typefrom the Content Usageview, and set the filter value to
dashboard OR look. - Select View Totalfrom Content Usage. You can also select fields like Favorites Total, Schedule Total, API Total, and Embed Totalfrom the Content Usageview.
- Sort the results in descending order on View Totalto list the most popular content first.
- You can also add a filter on the Days Since Last Accessedfield from the Content Usageview to limit the data to a specific length of time. For example, you can limit the data you view to the last 30 days by setting the filter value to
is less than 30.
Then, you can use the HistoryExplore to find the filters used in a specific Look or dashboard:
- In the HistoryExplore, filter on the IDfield from either the Dashboardview or the Lookview, and enter the IDs for the dashboards or Looks you identified using the Content UsageExplore.
- Select Filtersfrom the Queryview to return a list of filters used by the dashboards or Looks you are filtering on.
Dashboard
The DashboardExplore includes details about dashboards and dashboard elements, including Looks, queries, roles, users, and folders that are associated with dashboards.
Quick Start analyses
The DashboardExplore includes Quick Start analyses, which you can use to quickly answer questions or as starting points for other queries.
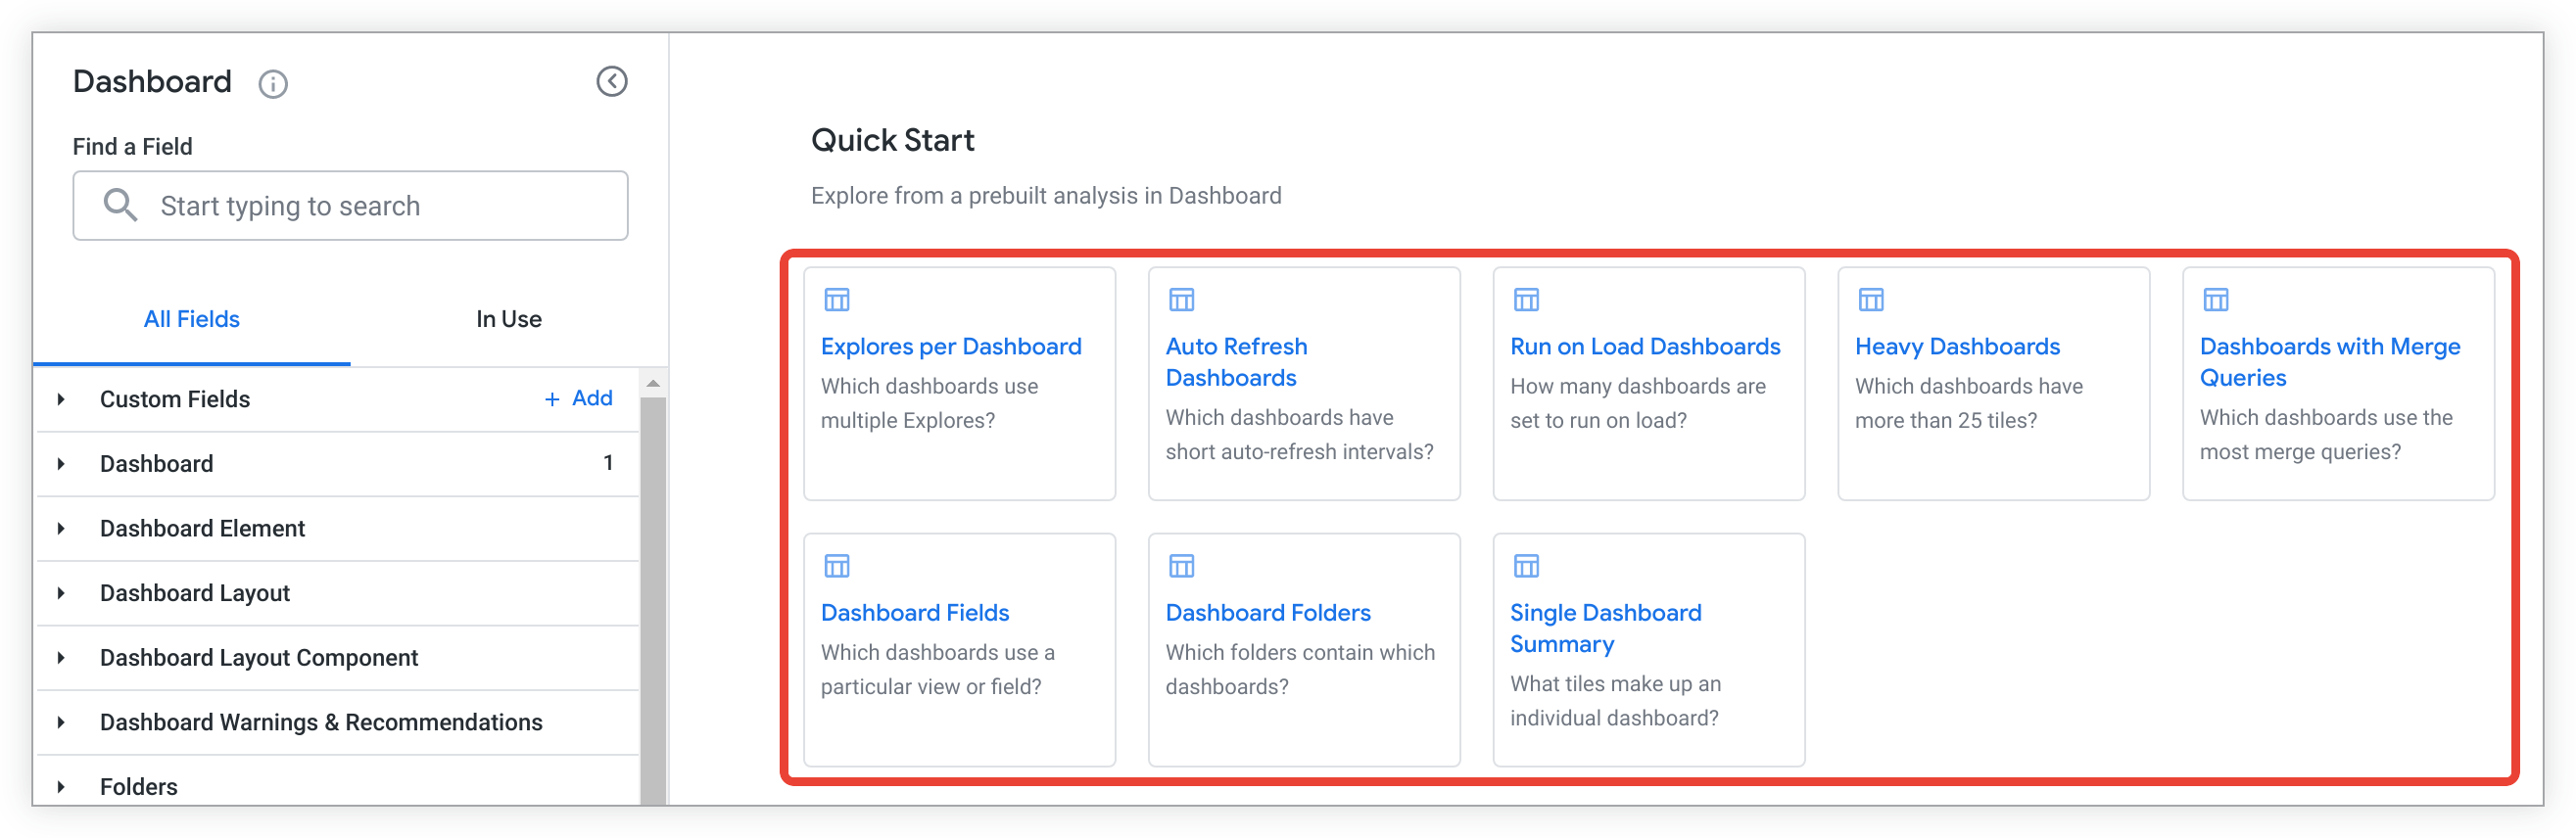
Select a Quick Start analysis tile in a blank Explore, or from the lightning bolt Quick Startmenu in an Explore that has run, and Looker will show a query with fields that are preselected and sorted to answer one of the following questions:
- Which dashboards use multiple Explores?
- Which dashboards have short auto-refresh intervals?
- How many dashboards are set to run on load ?
- Which dashboards have more than 25 tiles?
- Which dashboards use the most merge queries ?
- Which dashboards use a particular view or field?
- Which folders contain which dashboards?
- What tiles make up an individual dashboard?
Event
The EventExplore includes information about historical events within Looker, including the name, type, and frequency of each event. This Explore also includes information about groups and users who are connected to the events.
Following are some common uses of the EventExplore:
- How can I find and categorize API requests?
- Is there a way to investigate content updates?
- How do I view login events?
See the Looker events documentation page for more information about viewing events and common event attributes, and for a list of event types.
How can I find and categorize API requests?
You can find all the API requests that have been made and categorize them using the EventExplore:
- Select the Nameand Categoryfields from the Eventview.
- Add a filter on Is API Call (Yes / No), and set the filter value to
Yes. - You can also select fields like Created Datefrom Event, and Namefrom User, for information about specific API requests.
https://<instance_name.looker.com>/explore/system__activity/event?fields=event.created_date,event.name,event.category,user.name&f[event.is_api_call]=Yes&sorts=event.name&limit=500
Is there a way to investigate content updates?
You can use the EventExplore to investigate content updates by filtering on events that include the word update
:
- Select the Namefrom the Eventview.
- Add a filter on the Namefield from the Eventview, and set the filter value to
contains update. - You can also select other fields to provide more information about each content update, such as Created Timefrom Event, and IDfrom User.
https://<instance_name.looker.com>/explore/system__activity/event?fields=event.name,user.id,event.created_time&f[event.name]=%25update%25&sorts=event.created_time+desc&limit=500
How do I view login events?
You can use the EventExplore to determine who has logged in to the system with login events. For example:
- Add a filter on the Namefield from the Eventview, and set the filter value to
login. - Select the IDand Namefrom the Userview.
- Select Created Timefrom the Eventview.
Event Attribute
The Event AttributeExplore contains the data in the EventExplore and provides additional information about the attributes that make up events .
Following are some common uses of the Event AttributeExplore:
- How do I view permission changes?
- How do I track when Labs features are turned on?
- When was a project name changed?
For more information about viewing events, common event attributes, and a list of event types, see the Looker events documentation page.
How do I view permission changes?
You can use the Event AttributeExplore to view permission changes. For example, you can find out when a permission was changed and who changed it:
- Select Created Timeand Namefrom the Eventview for the time the change was made and the type of event.
- Select Nameand Valuefrom Event Attributeto return information about the type of change made and either the users whose permissions were changed or the specific permissions that were changed.
- Select IDand any other fields from Userfor information about the user who made the change.
- Filter on Namein the Eventview, setting the value to
user_permission_elevation.
https://<instance_name.looker.com>/explore/system__activity/event_attribute?fields=event.created_time,user.id,user.name,event_attribute.name,event_attribute.value&f[event.name]=%22user_permission_elevation%22&sorts=event.created_time+desc&limit=500
How do I track when Labs features are turned on?
You can use the Event AttributeExplore to track when Labs features are turned on. For example, select the following fields:
- Select Created Timefrom the Eventfield.
- Select Nameand Valuefrom the Event Attributefield.
- Add a filter on Namefrom Event, and set the filter value to
update_labs_feature. - You can also add fields like IDor Namefrom Userto view information about the user who turned on a Labs feature.
In this example, the name of the Labs feature that has been turned on or off is shown in the Valuefield of Event Attributewhen Namefrom Event Attributehas the value labs_feature_id
. When Namefrom Event Attributehas the value labs_feature_value
, the values true
and false
indicate whether the Labs feature was turned on or off.
https://<instance_name.looker.com>/explore/system__activity/event_attribute?fields=event.created_time,event_attribute.name,event_attribute.value,user.id&f[event.name]=%22update_labs_feature%22&sorts=event.created_time+desc&limit=500
When was a project name changed?
You can use the Event AttributeExplore to see when the name of a project was changed:
- Select Created Timeand Namefrom the Eventview.
- Select Nameand Valuefrom Event Attribute.
- Add a filter on Namefrom the Eventview, and set the filter value to
rename_project_file.
https://<instance_name.looker.com>/explore/system__activity/event_attribute?fields=event.created_time,event.name,event_attribute.name,event_attribute.value&f[event.name]=%22rename_project_file%22&sorts=event.created_time+desc&limit=500&query_timezone=America%2FLos_Angeles&vis=%7B%7D&filter_config=%7B%22event.name%22%3A%5B%7B%22type%22%3A%22%3D%22%2C%22values%22%3A%5B%7B%22constant%22%3A%22rename_project_file%22%7D%2C%7B%7D%5D%2C%22id%22%3A0%2C%22error%22%3Afalse%7D%5D%7D&origin=share-expanded
History
The HistoryExplore provides a record of individual queries. It can be useful for troubleshooting, as it provides details about all the queries run on your instance in the past 90 days.
Following are some common questions about using the HistoryExplore:
- What are all the models used by a dashboard?
- How can I identify long-running queries?
- When was the last time someone used SQL Runner?
- How can I find queries that were killed by the database?
- What is the most popular dashboard by query count?
- Which Explores are most popular with different roles?
- Has anyone queried a specific Explore in the last 90 days?
- Has anyone used a field from a specific view in the last 90 days?
- Which queries were initiated from within Google Sheets?
Truncation of the History table
Because the size of the Historytable can increase rapidly, Looker automatically deletes records that meet any of the following criteria:
- The
history.created_timeis more than 90 days in the past. - The
history.created_timeis more than 7 days in the past, and thehistory.sourceisscheduled_task.
Clarification of select fields
Each field in the HistoryExplore has a description to help you understand its purpose. The following table contains more detailed descriptions of certain fields that customers often ask about:
-
alerts: The query was initiated from an alert . -
api: The query was initiated using the Looker API . -
api3: The query was initiated using the Looker API . -
authenticated_download: The query was initiated using the Looker Action Hub with a streaming action on a schedule. -
dashboard: The query was initiated from a dashboard . (The query may have been initiated from the UI, from the API, or from a scheduled task.) -
dashboard_prefetch: The query was initiated from a dashboard prefetch . -
data-download-api: This query was initiated from a dashboard download in CSV format . -
drill_modal: The query was initiated when a user drilled into the data . -
explore: The query was initiated from an Explore . (The query may have been initiated from the UI or from the API) -
guided_analysis: The query was created with the Guided analyses in System Activity Labs feature. -
internal: The query was run by Looker to retrieve metadata for internal purposes. -
look: The query was initiated from a Look . (The query may have been initiated from the UI, from the API, or from a scheduled task.) -
merge_query: The query was initiated from a merge query . -
private_embed: The query was initiated from a private embed . -
public_url: The query was initiated from a Look with public access enabled. -
regenerator: The query was initiated by the PDT regenerator . -
render_manager_cache: The query was initiated by a download in PDF or PNG format. This could be a Look or a dashboard. -
scheduled_task: The query was run on a schedule which generated a PDF. (This source does not include scheduled deliveries of non-PDF formats, such as CSV.) -
sql_interface: The query was initiated by a third-party application using the Open SQL Interface . -
sqlrunner: The query was initiated from SQL Runner . -
suggest: The query was created as a filter suggestions query.
- Action Hub: The query was initiated using the Looker Action Hub
. This includes the Sourcevalue
authenticated_download. - API: The query was initiated using the Looker API
. This includes the Sourcevalue
api3. - System: The query was initiated by Looker without direct user intervention. This includes the Sourcevalues
alerts,data-download-api, andscheduled_task. - User: The query was initiated by a Looker user. This includes the Sourcevalues
dashboard,drill_modal,explore,look,merge_query,private_embed,render_manager,sqlrunner, andsuggest. - Other: The query does not fit into any of the other groups. This includes the Sourcevalue
internal.
-
cache_only_miss: The query was run with thecache_only=TRUEoption, and the cache entry was not present. -
complete: The query successfully completed. -
error: The query failed with an error. Include the Messagefield to see error details. -
killed: The query was cancelled by a user, by the database, or by Looker.
cache_only_miss
. In other words, this field only includes History entries where the Statusfield value is either complete
, error
, or killed
.Quick Start analyses
The HistoryExplore includes Quick Start analyses, which you can use to quickly answer questions or as starting points for other queries.
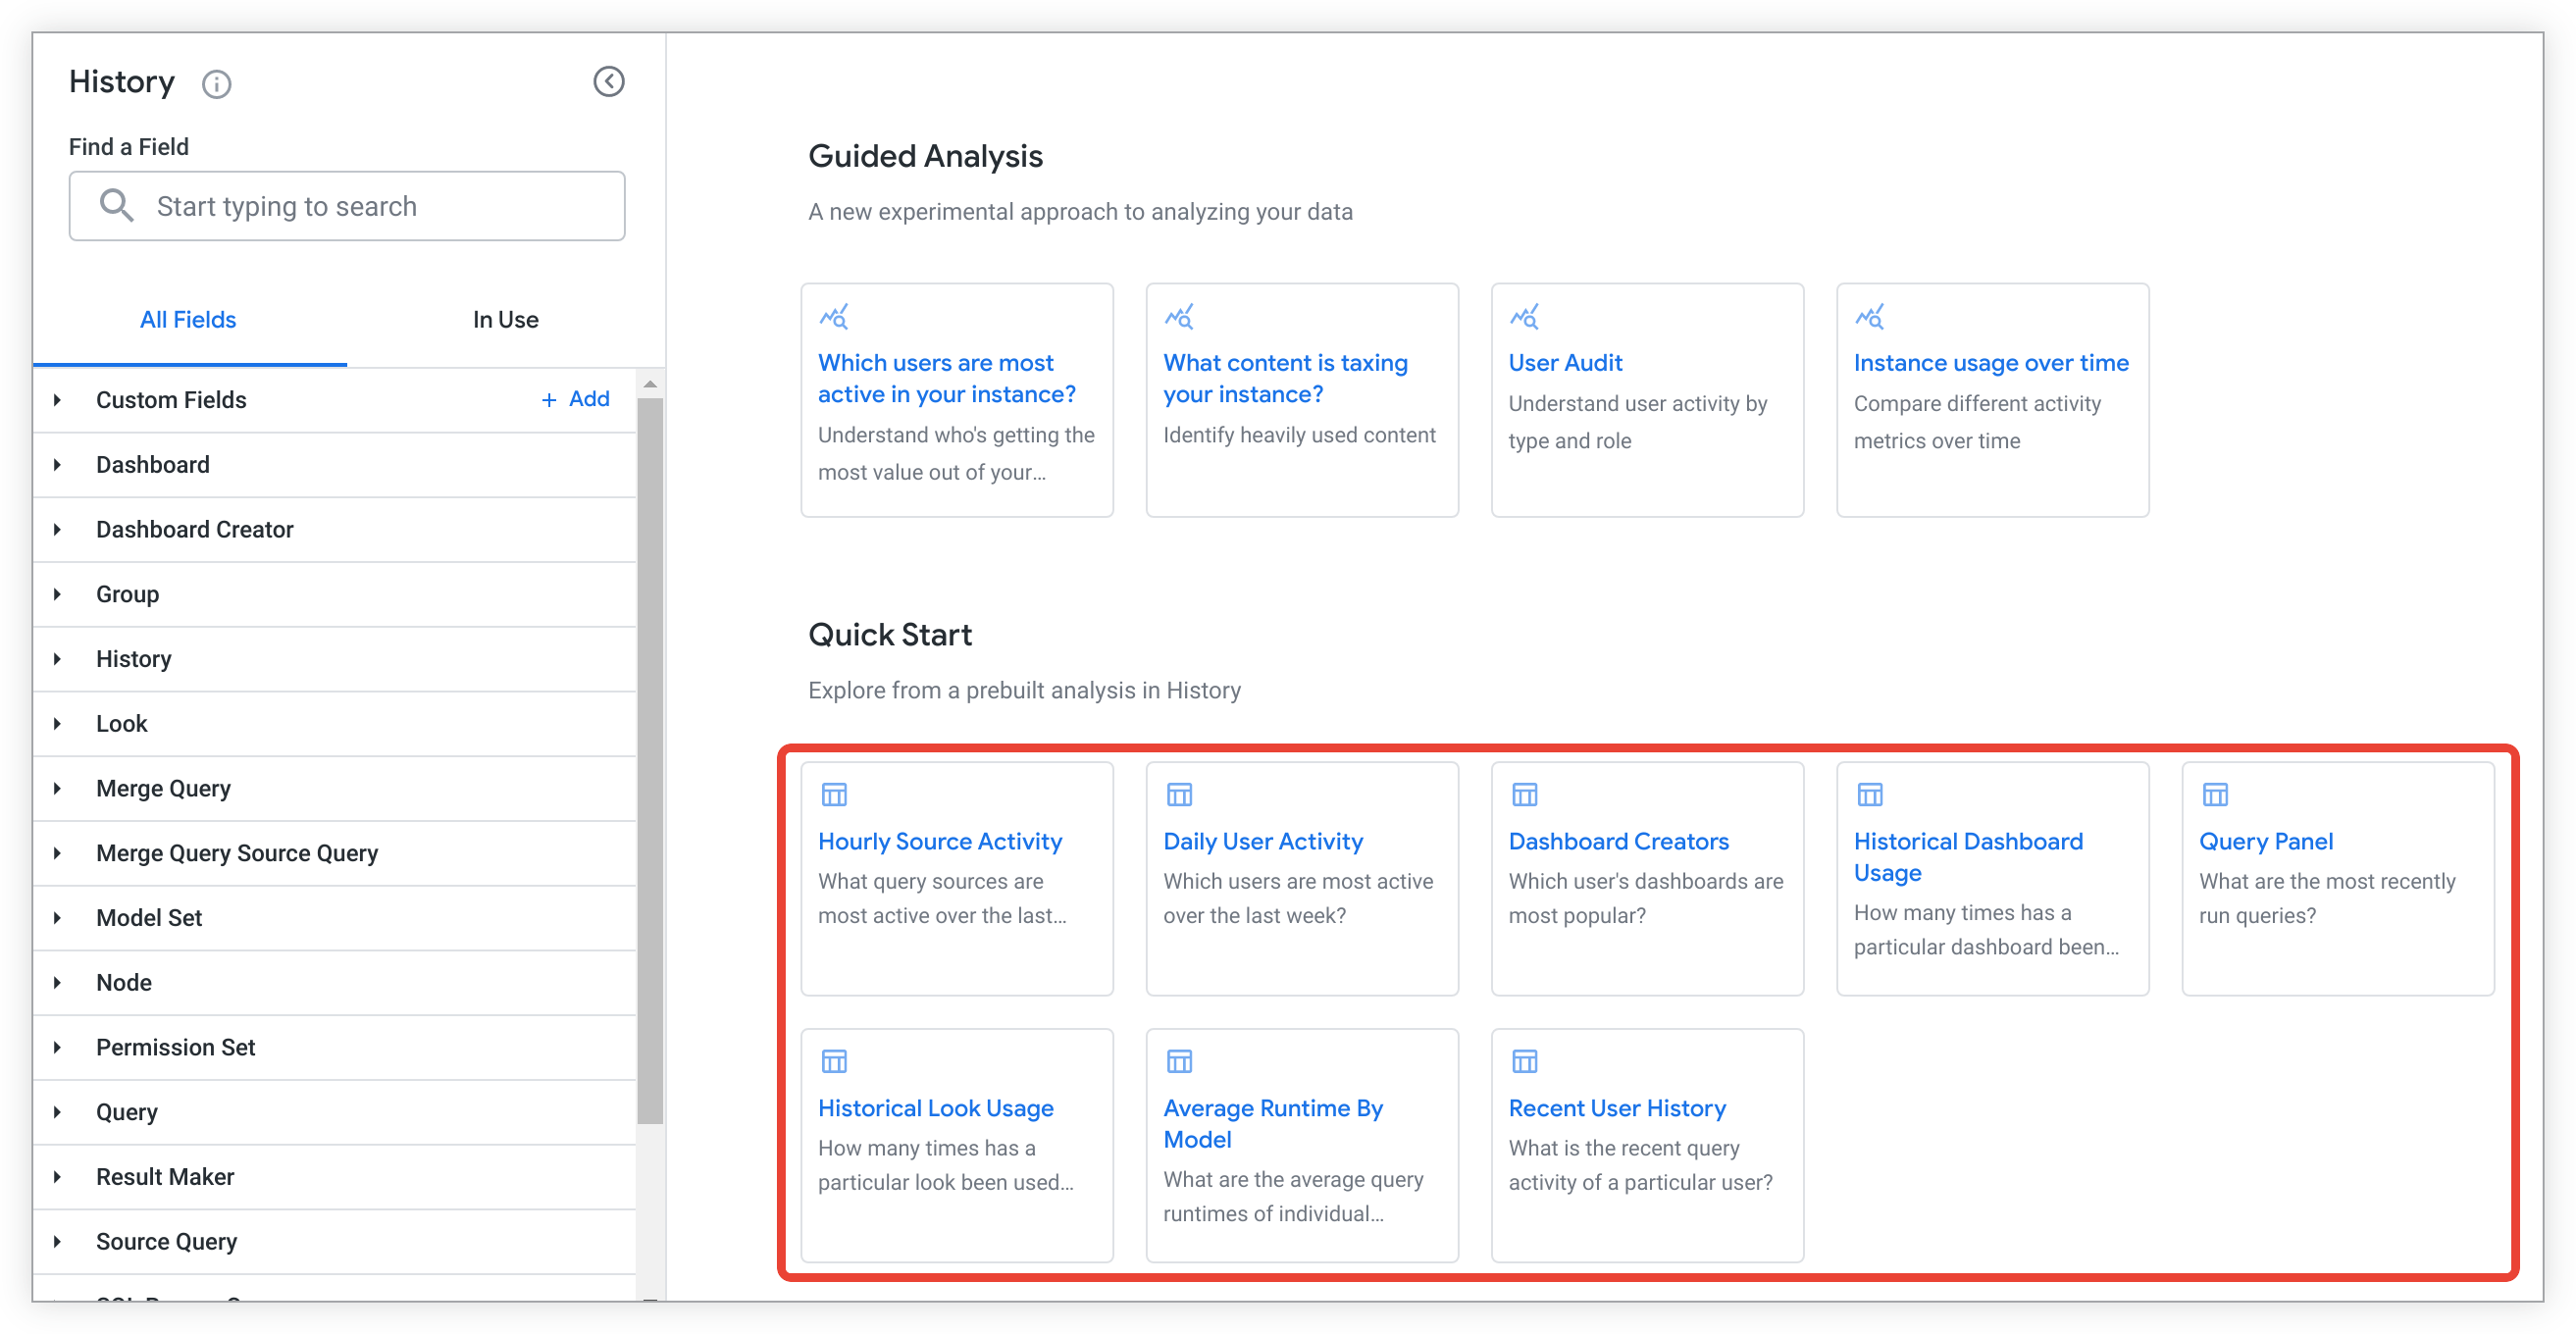
Select a Quick Start analysis tile in a blank Explore, or from the lightning bolt Quick Startmenu in an Explore that has run, and Looker will show a query with fields that are preselected and sorted to answer one of the following questions:
- What query sources have been the most active over the past day?
- Which users have been the most active over the past week?
- Which user's dashboards are the most popular?
- How many times has a particular dashboard been used over the past 30 days?
- What are the most recently run queries?
- How many times has a particular Look been used over the past 30 days?
- What are the average query runtimes of individual models?
- What is the recent query activity for a particular user?
What are all the models used by a dashboard?
You can use the HistoryExplore to find all the models used by a dashboard. As an example, this could help identify the models for which a user needs permissions when that user is unable to see the data on a dashboard.
- Select ID (Inclusive)from the Dashboardview.
- Select Modeland Countfrom the Queryview.
- Filter on ID (Inclusive), entering the dashboard ID for the dashboard you want to filter on.
In the following URL example, you can replace the dashboard ID 123
in the filter element f[history.real_dash_id]=123
with the ID for the dashboard you want to filter on:
https://<instance_name.looker.com>/explore/system__activity/history?fields=history.real_dash_id,query.model,query.count&f[history.real_dash_id]=123&sorts=history.real_dash_id+desc&limit=500
How can I identify long-running queries?
Suppose you want to create alerts for long-running queries. You can use the HistoryExplore to, for example, find the queries that take the longest to run:
- Select IDand Linkfrom Query.
- Select Average Runtime in Secondsand Query Run Countfrom Historyto view the average length of time each query ran and how many times the query has been run.
- You can add a filter on Completed Datefrom History, and set the filter value to a timeframe like
is in the past 7 daysto limit the results that are displayed. - Add a filter on Is Single Query (Yes / No)and set its value to
is Yesto exclude merge queries from the results. - You can display only queries with a runtime that is above a certain threshold, such as 5 minutes; to do this, you can filter on Average Runtime in Secondsand set the filter value to
is greater than 300. - Sort in descending order on Average Runtime in Secondsfrom Historyto list queries with the longest average runtimes first.
You can then save the query as a Look and create an alert to notify you if there are queries with runtimes that exceed the threshold you specify.
In the following URL example, you change the timeframe for which results are displayed by replacing 7+days
in the filter element f[history.created_date]=7+days
with another filter value. You can also change the value of the filter on Average Runtime in Secondsby replacing is greater than 300
in the filter element f[history.average_runtime]=%3E300
.
https://<instance_name.looker.com>/explore/system__activity/history?fields=query.id,history.average_runtime,history.query_run_count,query.link&f[history.is_single_query]=Yes&f[history.created_date]=7+days&f[history.average_runtime]=%3E300&sorts=history.average_runtime+desc&limit=500
When was the last time someone used SQL Runner?
To determine the last time a specific user ran a SQL Runner query using the HistoryExplore:
- Select Last Run Timeand User IDfrom the SQL Runner Queryview.
- Add a filter on User IDfrom the SQL Runner Queryview, and set the filter value to the ID of the user.
https://<instance_name.looker.com>/explore/system__activity/history?fields=sql_query.last_run_time,sql_query.user_id&sorts=sql_query.last_run_time+desc&limit=500&column_limit=50
How can I find queries that were killed by the database?
To find queries that were killed by your database with the HistoryExplore:
- Add a filter on Messagefrom History, and set the filter value to
contains query killed. - Select Created Date, ID, and Messagefrom History.
- Select IDfrom Query.
https://<instance_name.looker.com>/explore/system__activity/history?fields=history.id,history.created_date,query.id,history.message&f[history.message]=%25query+killed%25&sorts=history.message&limit=500
What is the most popular dashboard by query count?
The DashboardExplore lists the titles of every dashboard accessed in the last 90 days and includes a count of the number of times each of those dashboards was accessed:
- Select Titlefrom Dashboard.
- Select Query Run Countfrom History.
- Add a filter on Titlefrom Dashboard, and set the filter value to
is not null.
https://<instance_name.looker.com>/explore/system__activity/history?fields=dashboard.title,history.query_run_count&f[dashboard.title]=-NULL&sorts=history.query_run_count+desc&limit=500&column_limit=50
Which Explores are most popular with different roles?
This Explore shows how many times an Explore was run by each role on your instance in the previous 90 days:
- Select Explorefrom Query.
- Select and pivot on Namefrom User Role.
- Select Query Run Countfrom History.
- Add a filter on Namefrom User Role, and set the filter value to
is not null.
https://<instance_name.looker.com>/explore/system__activity/history?fields=history.query_run_count,query.view,role.name&pivots=role.name&f[role.name]=-NULL&sorts=history.query_run_count+desc+0,role.name&limit=500&column_limit=50
Has anyone queried a specific Explore in the last 90 days?
You can use the HistoryExplore to determine if a specific Explore was used in the last 90 days:
- Select Created Datefrom History.
- Select Exploreand Linkfrom Query.
- Add a filter on Explorefrom Query, and enter the name of the Explore.
Has anyone used a field from a specific view in the last 90 days?
You can use the HistoryExplore to determine if any fields from a specific view were used in the last 90 days:
- Select Created Datefrom History.
- Select Exploreand Linkfrom Query.
- Filter on Fields Usedfrom Query, enter the name of the view followed by a period — for example,
orders.— and select containsfor the filter condition. The period in your filter indicates that Looker should return fields from only that view and not fields from similarly named views.
In the following URL example, you can replace order%5E_items.
in the filter element f[query.formatted_fields]=%25order%5E_items.
with the name of the view you want to filter on, followed by a period:
https://<instance_name.looker.com>/explore/system__activity/history?fields=history.created_date,query.view,query.link&f[query.formatted_fields]=%25order%5E_items.%25&sorts=history.created_date+desc&limit=500&column_limit=50
Which queries were initiated from within Google Sheets?
You can use the HistoryExplore to view a list of queries that were generated from within Google Sheets using the Connected Sheets for Looker feature:
- Select Dateand Time of Dayfrom the Created Dategroup in History.
- Select API Client Name, Connected Sheets Spreadsheet ID, and Connected Sheets Triggerfrom the Query API Client Propertiesgroup in History.
- Select Namefrom User.
- Filter on Connected Sheets Spreadsheet IDin the Query API Client Propertiesgroup in History, and set the value to
is not null.
https://<instance_name.looker.com>/explore/system__activity/history?fields=query_api_client_context.name,query_api_client_context.cs_spreadsheet_id,query_api_client_context.cs_trigger,user.name,history.created_date,history.created_time_of_day&f[query_api_client_context.cs_spreadsheet_id]=-NULL&sorts=history.created_time_of_day+desc&limit=5000
Look
The LookExplore includes details about all Looks, including information about dashboards, queries, users, and folders that are associated with Looks.
Following are some common questions about using the LookExplore:
- Which Looks are shared publicly?
- Who is the author of a specific Look?
- Which Looks have been deleted?
Which Looks are shared publicly?
You can use the LookExplore to see which Looks are being shared publicly or have a public URL enabled.
- Filter on Public (Yes / No)from Look, and set the filter value to
Yes. - Select ID, Name, and Linkfrom Look.
https://<instance_name.looker.com>/explore/system__activity/look?fields=look.id,look.title,look.link&f[look.public]=Yes&limit=500
Who is the author of a specific Look?
To find the author of a specific Look:
- Filter on the IDfrom Look, setting the value to the Look's ID.
- Select IDand Namefrom User.
- You can also select fields like Created Dateand Titlefrom Look.
Which Looks have been deleted?
To view a list of all deleted Looks:
- Select ID, Title, Link, and Deleted Datefrom Look.
- Add a filter on Deleted Datefrom Look, and set the filter value to
is not null.
https://<instance_name.looker.com>/explore/system__activity/look?fields=look.id,look.title,look.link,look.deleted_date&f[look.deleted_date]=NOT+NULL&sorts=look.title&limit=500&column_limit=50
Merge Query
The Merge QueryExplore includes information about merged queries, including fields and other elements of both the source and the merged queries.
You can use the Merge QueryExplore to answer questions like the following:
Which Explores are merged most frequently?
You can use the Merge QueryExplore to find out which Explores are merged the most often and consider joining the tables for better performance and more features.
- Select Explorefrom Query.
- Select Countfrom Merge Query Source Query.
https://<instance_name.looker.com>/explore/system__activity/merge_query?fields=query.view,merge_query_source_query.count&sorts=merge_query_source_query.count+desc&limit=500&query_timezone=America%2FLos_Angeles&vis=%7B%7D&filter_config=%7B%7D&origin=share-expanded
PDT Builds
The PDT BuildsExplore includes information about PDT builds, including time taken to finish builds and the connection and model the PDTs are part of.
Following are some common uses of the PDT BuildsExplore:
These queries may take longer to run on instances with many PDTs running concurrently.
How can I see PDT build times?
You can use the PDT BuildsExplore to view build times for PDTs. For example, to see PDT build times in the past 2 days:
- Add a filter on Start Timefrom the PDT Buildsview and set its value to
is in the past 2 days. - Select Start Time, View Name, Connection, Model Name, Elapsed Minutes, and Elapsed Secondsfrom the PDT Buildsview.
https://<instance_name.looker.com>/explore/system__activity/pdt_builds?fields=pdt_builds.start_time,pdt_builds.view_name,pdt_builds.connection,pdt_builds.model_name,pdt_builds.elapsed_minutes,pdt_builds.elapsed_seconds&f[pdt_builds.start_time]=2+days&sorts=pdt_builds.start_time+desc&limit=500
How can I identify long-running PDTs to alert on?
You can use the PDT BuildsExplore to identify long-running PDTs. Then, you can save the query as a Look and create an alert to notify you if there are PDTs with build times that exceed the threshold you specify.
For example, to see PDTs with an average build time of more than 30 minutes:
- Add a filter on Average Build Time Minutesfrom the PDT Buildsview and set its value to
is greater than 30. - Select View Name, Connection, and Average Build Time Minutesfrom the PDT Buildsview.
To change the value of the filter on Average Build Time Minutesfrom PDT Builds, replace 30
in the filter element f[pdt_builds.average_build_time_minutes]=%3E20
with a number of minutes:
https://<instance_name.looker.com>/explore/system__activity/pdt_builds?fields=pdt_builds.view_name,pdt_builds.connection,pdt_builds.average_build_time_minutes&f[pdt_builds.average_build_time_minutes]=%3E30&sorts=pdt_builds.average_build_time_minutes+desc&limit=500
Query Concurrency
The Query ConcurrencyExplore provides a detailed analysis of query concurrency on your instance. You can use this Explore to understand how many queries from different sources are running simultaneously over specific time intervals. This Explore can help you identify periods of high load and investigate performance bottlenecks related to database connection limits.
Analyze query concurrency over time
You can use the Query ConcurrencyExplore to visualize the number of queries that are running at the same time and to drill down into specific time intervals for further analysis.
To view concurrency trends over time, follow these steps:
- Navigate to the Query ConcurrencyExplore.
- Add the Interval Start Datedimension from the Concurrencyview.
- Add the Concurrencymeasure from the Concurrencyview.
- Pivot by the Sourcedimension from the Query Intervalsview to segment concurrency by the query source.
- Add filters as needed, such as Connection Name, Date Range, and Interval Size (in minutes).
- Choose a stacked column or area chart visualization to view the concurrency trends over time.

To investigate a specific period of high concurrency, follow these steps:
- From the data table or visualization, click a value from the Concurrencymeasure.
- From the drill-down menu, choose the Timeline Summary of Intervaloption.

Limitations with MySQL backends
On Looker instances with a MySQL backend that are not using Elite System Activity, an error may occur if the selected Date Rangeand Interval Sizevalues generate too many groups. If you encounter the error Recursive query aborted after N iterations
, reduce the Date Rangeor increase the Interval Sizeto stay within the database configured limit.
The resulting visualization will show a timeline of every query that was running during that specific time interval, allowing you to see the exact start and end times of each job that contributed to the total concurrency.
Query Performance Metrics
The Query Performance MetricsExplore provides detailed breakdowns of each query that is run from your Looker instance.
For example, you can use this Explore to investigate which components of a query took longest to load. You can also use this Explore to identify query performance trends and anomalies. For a more detailed breakdown of the query lifecycle and the fields tracked in this Explore, see the Understanding query performance metrics documentation page.
Quick Start analyses
The Query PerformanceExplore includes Quick Start analyses, which you can use to quickly answer questions or as starting points for other queries.
Select a Quick Start analysis tile in a blank Explore, or from the lightning bolt Quick Startmenu in an Explore that has run, and Looker will show a query with fields that are preselected and sorted to answer one of the following questions:
- How much time did each query stage take?
- Which Explores have the highest average main query execution time?
- Which users have the highest average main query execution time?
- Which times of day have the longest asynchronous worker timings?
- Which times of day have the longest query initialization timings?
- Which times of day have the longest connection handling timings?
- Which times of day have the longest main query timings?
- Which times of day have the longest post-query timings?
SQL Query
The SQL QueryExplore includes information about the SQL queries that have run, including how recently and frequently, and details about users who have run them.
You can use the SQL QueryExplore to answer questions like the following:
Which users run the most SQL queries?
You can use the SQL QueryExplore to identify the users who run the most SQL Runner queries:
- Select IDand Namefrom User.
- Select Countfrom SQL Runner Query.
- Sort in descending order on Countfrom SQL Runner Queryto list users who run the most queries first.
https://<instance_name.looker.com>/explore/system__activity/sql_query?fields=sql_query.count,user.id,user.name&sorts=sql_query.count+desc&limit=500
Scheduled Plan
The Scheduled PlanExplore includes information about all scheduled data deliveries, including both previously scheduled jobs and future scheduled jobs.
Following are some common questions about using the Scheduled PlanExplore:
- How do I view scheduled plans in a consistent time zone?
- At which stage do schedules get stuck?
- How do I find schedule owners?
- Which scheduled plans run at the same time?
- Which schedules are unlimited?
- Is it possible to view history for more than 50 schedules?
- How do I filter results down to a specific set of schedules?
- Can error trends be identified across schedules?
- How do I view runtime metrics for schedules?
How do I view scheduled plans in a consistent time zone?
You can use the Scheduled Planto view all scheduled plans in a consistent time zone, since System Activity stores time-based data in the System time zone :
- Select ID, Name, and Next Runtimefrom Scheduled Planto view the next runtime for each scheduled plan in the System time zone.
- Select IDand Namefrom Userto see the user who created the schedule.
- Filter on Run Once (Yes/No), and set the filter value to
Noto exclude deliveries that were sent once (for example, for a delivery of a Look ) or sent as a one-time test (for example, for the test delivery of a Look ). - You can also add fields like Cron Scheduleand Timezonefrom the Scheduled Planview.
https://<instance_name.looker.com>/explore/system__activity/scheduled_plan?fields=scheduled_plan.id,scheduled_plan.name,user.id,scheduled_plan.next_run_time,scheduled_plan.cron_schedule,scheduled_plan.timezone,user.name&f[scheduled_plan.run_once]=No&sorts=scheduled_plan.timezone+desc&limit=500&column_limit=50
At which stage do schedules get stuck?
You can use the Scheduled PlanExplore to identify the stage at which schedules get stuck. For example:
- To view the stage at which a specific scheduled job got stuck, filter on IDfrom Scheduled Job, and set the filter value to the scheduled job's ID. Select Stage, Scheduled Job ID, and Runtime in Secondsfrom Scheduled Job Stage.
- You can also select Started Timeand Completed Timefrom Scheduled Job Stage.
You can then use the IDand Runtime in Secondsfields to troubleshoot the failed job, based on whether the scheduled job was stuck in, for example, the execute
stage or the enqueued for delivery
stage.
In the following URL example, you can replace the scheduled job ID 12913
in the filter element &f[scheduled_job.id]=12913
with the ID for the scheduled job you want to filter on:
https://<instance_name.looker.com>/explore/system__activity/scheduled_plan?fields=scheduled_job_stage.stage,scheduled_job_stage.scheduled_job_id,scheduled_job_stage.runtime,scheduled_job_stage.started_time,scheduled_job_stage.completed_time&f[scheduled_job.id]=12913&sorts=scheduled_job_stage.scheduled_job_id+desc&limit=500
How do I find schedule owners?
You can use the Scheduled PlanExplore to find schedule owners:
- Select IDand Namefrom Scheduled Plan.
- Select IDand Namefrom User.
- Filter on Run Once (Yes/No), and set the filter value to
Noto exclude deliveries that were sent once (for example, for a delivery of a Look ) or sent as a one-time test (for example, for the test delivery of a Look ). - To find the owner of a specific schedule, filter on IDfrom Scheduled Plan, and set the filter value to the ID of that schedule.
https://<instance_name.looker.com>/explore/system__activity/scheduled_plan?fields=scheduled_plan.id,scheduled_plan.name,user.id,user.name&f[scheduled_plan.run_once]=No&sorts=scheduled_plan.id&limit=500
Which scheduled plans run at the same time?
You can use the Scheduled PlanExplore to identify plans that are scheduled to run at the same time:
- Select ID, Name, Cron Schedule, and Next Run Timefrom Scheduled Plan.
- Filter on Run Once (Yes/No), and set the filter value to
Noto exclude deliveries that were sent once (for example, for a delivery of a Look ) or sent as a one-time test (for example, for the test delivery of a Look ). - You can also add a filter on Next Run Time, and set the filter value to
is not nullto include only existing scheduled deliveries in the results.
You can then change the timing of schedules (for example, for the delivery of a Look ) so that multiple schedules will not run at the same time.
https://<instance_name.looker.com>/explore/system__activity/scheduled_plan?fields=scheduled_plan.id,scheduled_plan.name,scheduled_plan.cron_schedule,scheduled_plan.next_run_time&f[scheduled_job.run_once]=No&f[scheduled_plan.next_run_time]=NOT+NULL&sorts=scheduled_plan.id&limit=500
Which schedules are unlimited?
You can use the Scheduled PlanExplore to find unlimited schedules, or schedules with a row limit of -1
:
- Filter on Send All Results, and set the value to Yes.
- Select ID, Created Time, Finalized Time, and Countfrom Scheduled Job.
https://<instance_name.looker.com>/explore/system__activity/scheduled_plan?fields=scheduled_job.id,scheduled_job.created_time,scheduled_job.finalized_time,scheduled_job.count&f[scheduled_plan.send_all_results]=Yes&sorts=scheduled_job.created_time+desc&limit=500
Is it possible to view history for more than 50 schedules?
Using the Scheduled PlanExplore, you can view the histories of more than just the 50 schedules that are available to view on the Schedule History admin page. For example:
- Select IDfrom Scheduled Plan.
- Select Namefrom Userto see who created each schedule.
- Select Cron Schedulefrom Scheduled Jobto see the scheduled delivery time for each scheduled job as a cron string.
- Select Typefrom Scheduled Plan Destinationto see the destination type (for example, for the delivery of a Look ).
- Select ID, Status, and Status Detailfrom Scheduled Jobto view the status and any error messages for each scheduled job.
- Select Created Timeand Finalized Timefrom Scheduled Job.
- Select Runtime in Secondsfrom Scheduled Job Stage.
- You can also select Linkfrom either the Lookview or the Dashboardview for a link to the Look or dashboard for a schedule.
- To limit results to only a specific timeframe, add a filter on Created Datefrom Scheduled Job, and set the filter value to a specific length of time, such as
is in the past 7 days. - Filter on Run Once (Yes/No), and set the filter value to
Noto exclude deliveries that were sent once (for example, for a delivery of a Look ) or sent as a one-time test (for example, for the test delivery of a Look ).
https://<instance_name.looker.com>/explore/system__activity/scheduled_plan?fields=scheduled_plan.id,user.name,scheduled_job.cron_schedule,scheduled_plan_destination.type,scheduled_job.id,scheduled_job.status,scheduled_job.status_detail,scheduled_job.created_time,scheduled_job.finalized_time,scheduled_job_stage.runtime,look.link,dashboard.link&f[scheduled_plan.run_once]=No&f[scheduled_job.created_date]=7+days&sorts=scheduled_job.created_time+desc&limit=500
How do I filter results down to a specific set of schedules?
You can use the Scheduled PlanExplore to view only a specific set of schedules by filtering, for example, on specific dashboards, owners, or models. For example, to view a list of schedules based on a specific model, such as thelook
:
- Add a filter on Modelfrom the Queryview, and set the filter value to the name of the model.
- Select IDand Namefrom Scheduled Plan.
- Select Namefrom Userto see who created each schedule.
- Select Cron Schedulefrom Scheduled Planto see the scheduled delivery time for each schedule as a cron string.
- You can also select Linkfrom either the Lookview or the Dashboardview for a link to the Look or dashboard for a schedule.
- Filter on Run Once (Yes/No), and set the filter value to
Noto exclude deliveries that were sent once (for example, for a delivery of a Look ) or sent as a one-time test (for example, for the test delivery of a Look ).
In the following URL example, you can replace the model name thelook
in the filter element f[query.model]=thelook
with the name of the model you want to filter on:
https://<instance_name.looker.com>/explore/system__activity/scheduled_plan?fields=scheduled_plan.id,scheduled_plan.name,user.name,scheduled_plan.cron_schedule,look.link,dashboard.link&f[scheduled_plan.run_once]=No&f[query.model]=thelook&sorts=scheduled_plan.id&limit=500
Can error trends be identified across schedules?
Another use case for the Scheduled PlanExplore can be to identify error trends across schedules, such as, for example, finding that SFTP schedules are failing with a specific error message:
- Select Created Time, Finalized Time, ID, Status, and Status Detailfrom Scheduled Jobto see a list of scheduled jobs and their statuses and error messages.
- Select Stagefrom Scheduled Job Stage.
- Select Typeand Formatfrom Scheduled Plan Destinationto see the destination type (for example, for the delivery of a Look ) and data format (for example, for the delivery of a Look ).
- Filter on Statusfrom Scheduled Job, and set the filter value to
failureto include only scheduled jobs that have failed. - To include results for only a specific destination, filter on the Typefield from Scheduled Plan Destination, and set the filter value to a specific destination, such as
sftporemail.
https://<instance_name.looker.com>/explore/system__activity/scheduled_plan?fields=scheduled_job.created_time,scheduled_job.finalized_time,scheduled_job.id,scheduled_job.status,scheduled_job.status_detail,scheduled_job_stage.stage,scheduled_plan_destination.type,scheduled_plan_destination.format&f[scheduled_job.status]=failure&sorts=scheduled_job.status&limit=500&column_limit=50
How do I view runtime metrics for schedules?
You can use the Scheduled PlanExplore to investigate runtime metrics for schedules. For example, to view the average runtimes for schedules:
- Select IDand Namefrom Scheduled Plan.
- Select Namefrom User.
- Select Cron Schedulefrom Scheduled Plan.
- Select Average Runtime in Secondsfrom Scheduled Job Stage.
- Filter on Run Once (Yes/No), and set the filter value to
Noto exclude deliveries that were sent once (for example, for a delivery of a Look ) or sent as a one-time test (for example, for the test delivery of a Look ).
https://<instance_name.looker.com>/explore/system__activity/scheduled_plan?fields=scheduled_plan.id,scheduled_plan.name,user.name,scheduled_plan.cron_schedule,scheduled_job_stage.avg_runtime&f[scheduled_plan.run_once]=No&sorts=scheduled_plan.id&limit=500
To see runtimes for scheduled jobs:
- To view runtimes for all the jobs for a specific plan, add a filter on IDfrom Scheduled Plan, and set the filter value to a specific scheduled plan ID.
- Select IDfrom Scheduled Plan.
- Select Namefrom User.
- Select Cron Schedulefrom Scheduled Plan.
- Select ID, Status, Created Time, and Finalized Timefrom Scheduled Job.
- Select Runtime in Secondsfrom Scheduled Job Stage.
- Filter on Run Once (Yes/No), and set the filter value to
Noto exclude deliveries that were sent once (for example, for a delivery of a Look ) or sent as a one-time test (for example, for the test delivery of a Look ).
To change the filter on IDfrom Scheduled Planin the following URL example, replace 145
in the filter element f[scheduled_plan.id]=145
with the ID of the scheduled plan you want to filter on:
https://<instance_name.looker.com>/explore/system__activity/scheduled_plan?fields=scheduled_plan.id,user.name,scheduled_job.cron_schedule,scheduled_job.id,scheduled_job.status,scheduled_job.created_time,scheduled_job.finalized_time,scheduled_job_stage.runtime&f[scheduled_plan.run_once]=No&f[scheduled_plan.id]=145&sorts=scheduled_job.created_time+desc&limit=500
User
The UserExplore includes details about each user, including historical queries run, and the content and folders to which they have access.
Quick Start analyses
The UserExplore includes Quick Start analyses, which you can use to quickly answer questions or as starting points for other queries.
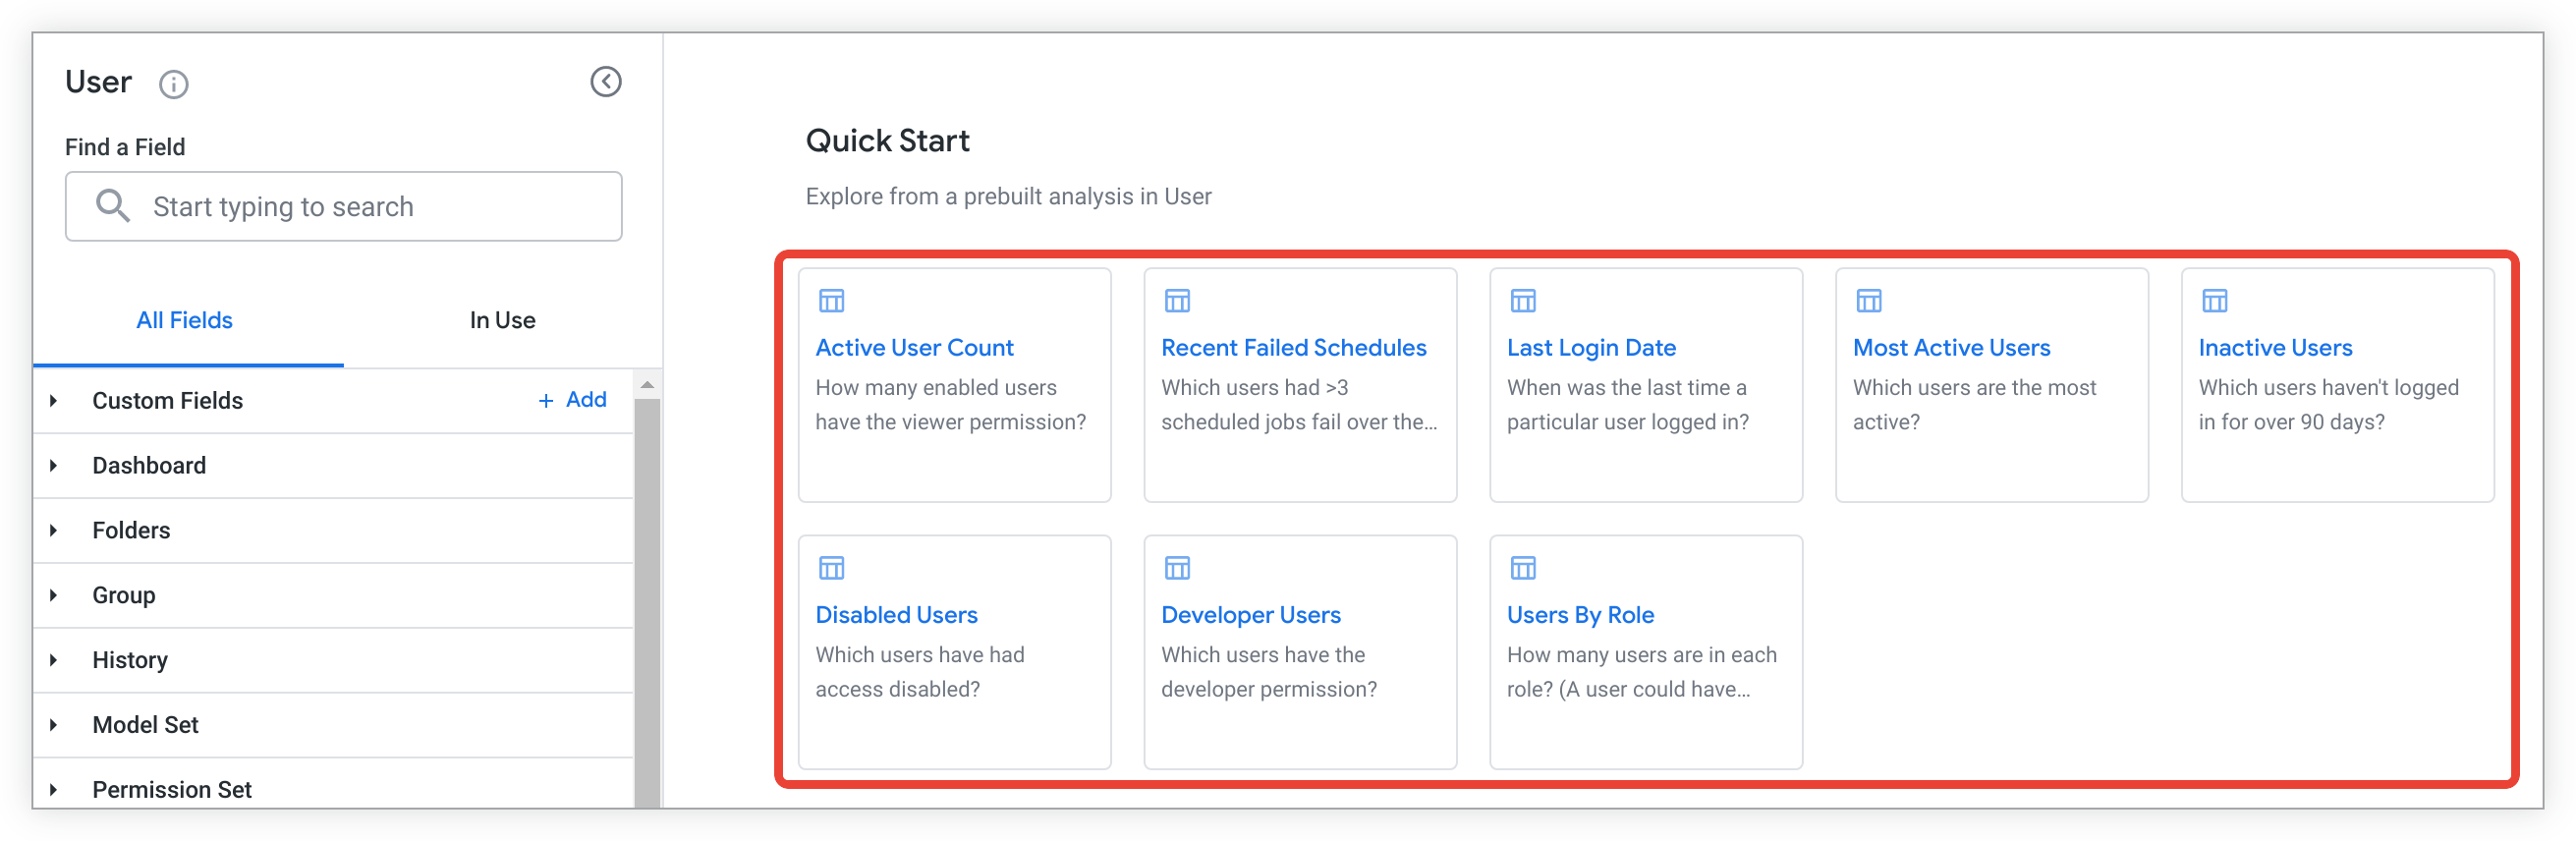
Select a Quick Start analysis tile in a blank Explore, or from the lightning bolt Quick Startmenu in an Explore that has run, and Looker will show a query with fields that are preselected and sorted to answer one of the following questions:
- How many enabled users have the viewer permission (
access_data)? - Which users had greater than 3 scheduled jobs fail over the past 7 days?
- When was the last time a particular user logged in?
- Which users are the most active?
- Which users haven't logged in for over 90 days?
- Which users have had access disabled?
- Which users have the developer permission (
develop)? - How many users are in each role?
How do I view which Google personnel have accessed my instance?
In addition to the Recent Accesspanel in the Support Accesspage , you can view information about which Google personnel have accessed your instance. For example, to view which Google personnel accessed your instance, how many minutes they accessed your instance, and how many queries they ran:
- Select Namefrom User.
- Select Approximate Web Usage in Minutesand Query Counts > Query Run Countfrom History.
- Filter on Created Date > Datein History, and set the value to the time period for which you want to view access by Google personnel.
- Filter on Source > Sourcein Historyand set the value to
is not equal toscheduled_taskto eliminate any scheduled tasks. - Filter on User Permissions > Is Looker Employee (Yes / No)in User Factsand set the value to
is Yesto view only Google personnel.
https://<instance_name>/explore/system__activity/user?fields=user.name,history.approximate_usage_in_minutes,history.query_run_count_drill&f[user.is_disabled]=No&f[history.created_date]=70+days&f[history.source]=-%22scheduled_task%22&f[user_facts.is_looker_employee]=Yes
Guided analyses in System Activity Labs feature
Guided analyseslet Looker admins and users who have been granted the see_system_activity
permission quickly answer key questions about instance usage in the History
Explore with a question-and-answer format. For users to be able to access guided analyses, an admin must enable the Guided analyses in System Activity Labs feature
.
A guided analysis includes pre-populated fields, values, and options to select from, as well as a visualization displaying the selected metrics.

The visualization type is chosen by Looker to best display the data selected, and it cannot be changed.
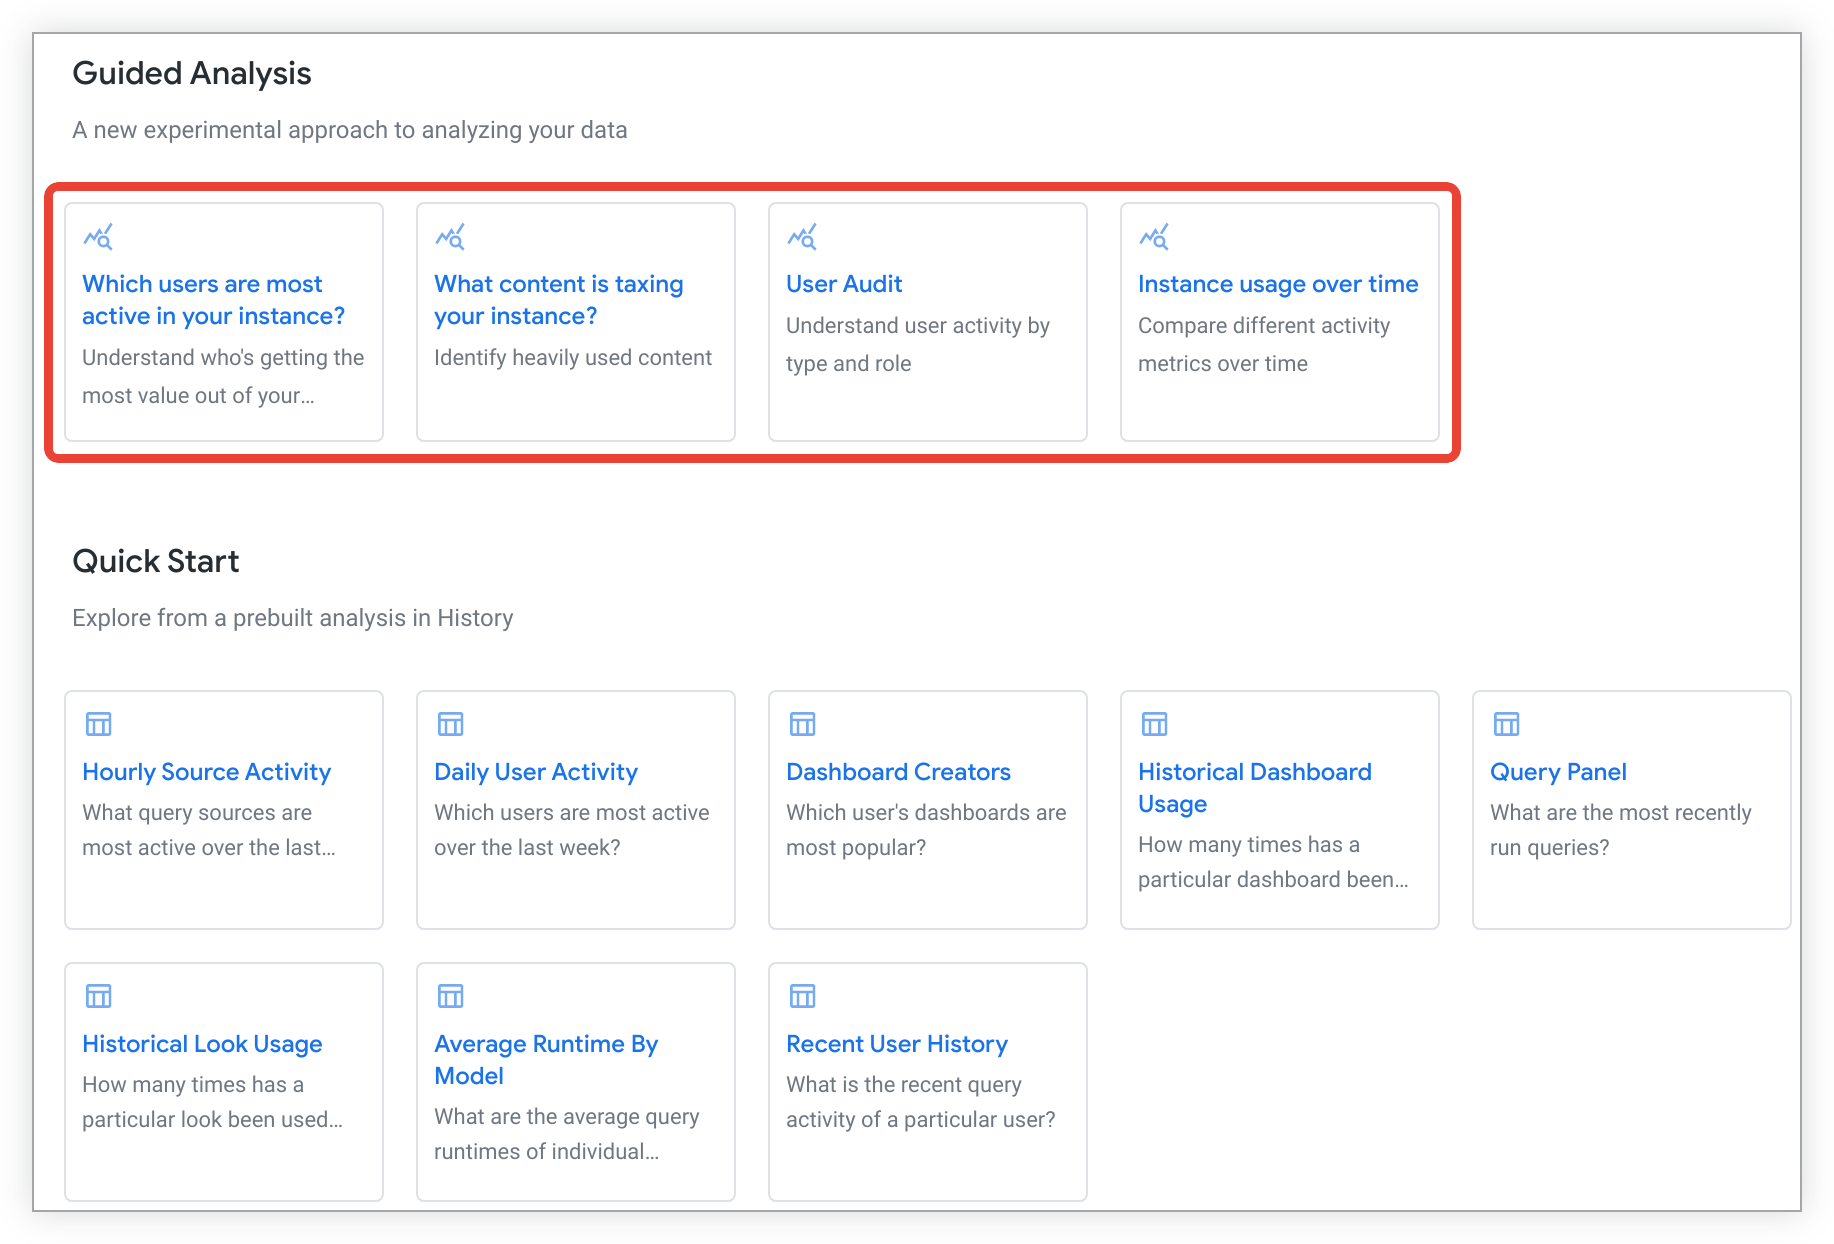
Users can currently access several guided analysis options from the History Explore:
- Which users are most active in your instance?— Understand who's getting the most value out of your instance
- What content is taxing your instance?— Identify heavily used content
- User audit— Understand user activity by type and role
- Instance usage over time— Compare different activity metrics over time
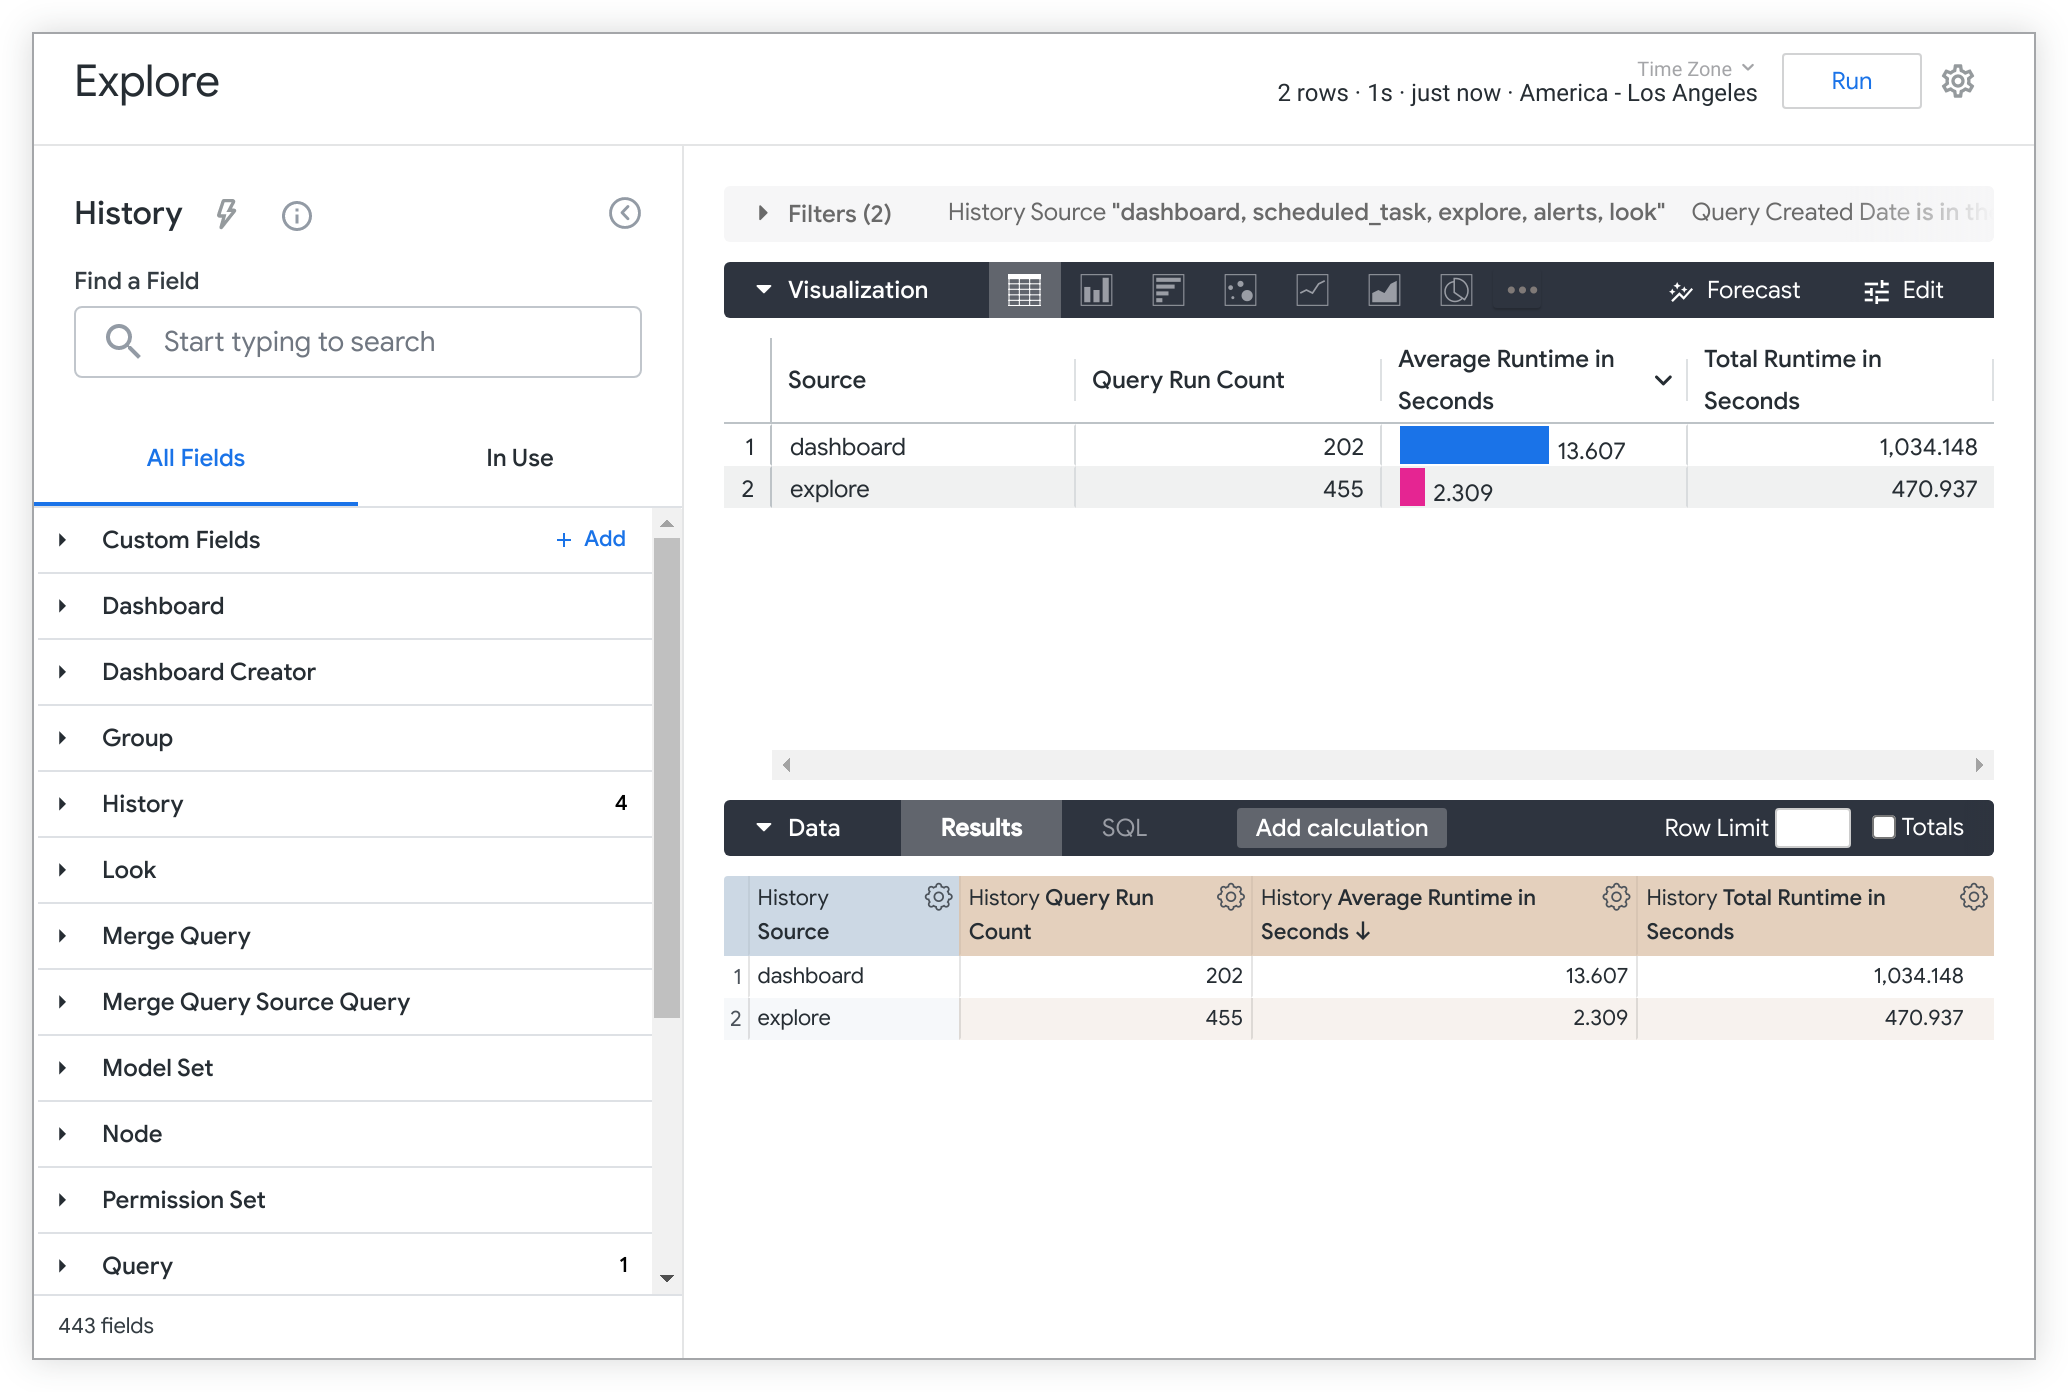
Choosing a guided analysis from a blank Explore
To run a guided analysis, select the analysis option that you want to use. Analysis options are displayed in the Guided Analysissection.
![]()
Once the guided analysis has run, you can customize the data values to answer key questions, explore further into the analysis, or save the analysis to share with other users who have access. To close the analysis, close its browser tab.
Choosing a guided analysis once an Explore has run
If you have already run a System Activity HistoryExplore, you can select a guided analysis by selecting the Quick Startbutton next to the Explore name.

This action launches the Quick Startmenu.
Select a guided analysis from the Quick Startmenu to open and run the guided analysis in a new browser tab.
Once the guided analysis has run, you can customize the data values to answer key questions, explore further into the analysis, or save the analysis to share with other users who have access. To close the analysis, close its browser tab.
Customizing a guided analysis
Once you have selected a guided analysis from a blank Explore or an Explore's Quick Startmenu , the analysis will automatically open and run in a new browser tab.
When the guided analysis has finished running, you can change and create combinations of pre-populated values by selecting values and conditions from drop-down menus, date menus, or radio button options, depending upon the analysis.
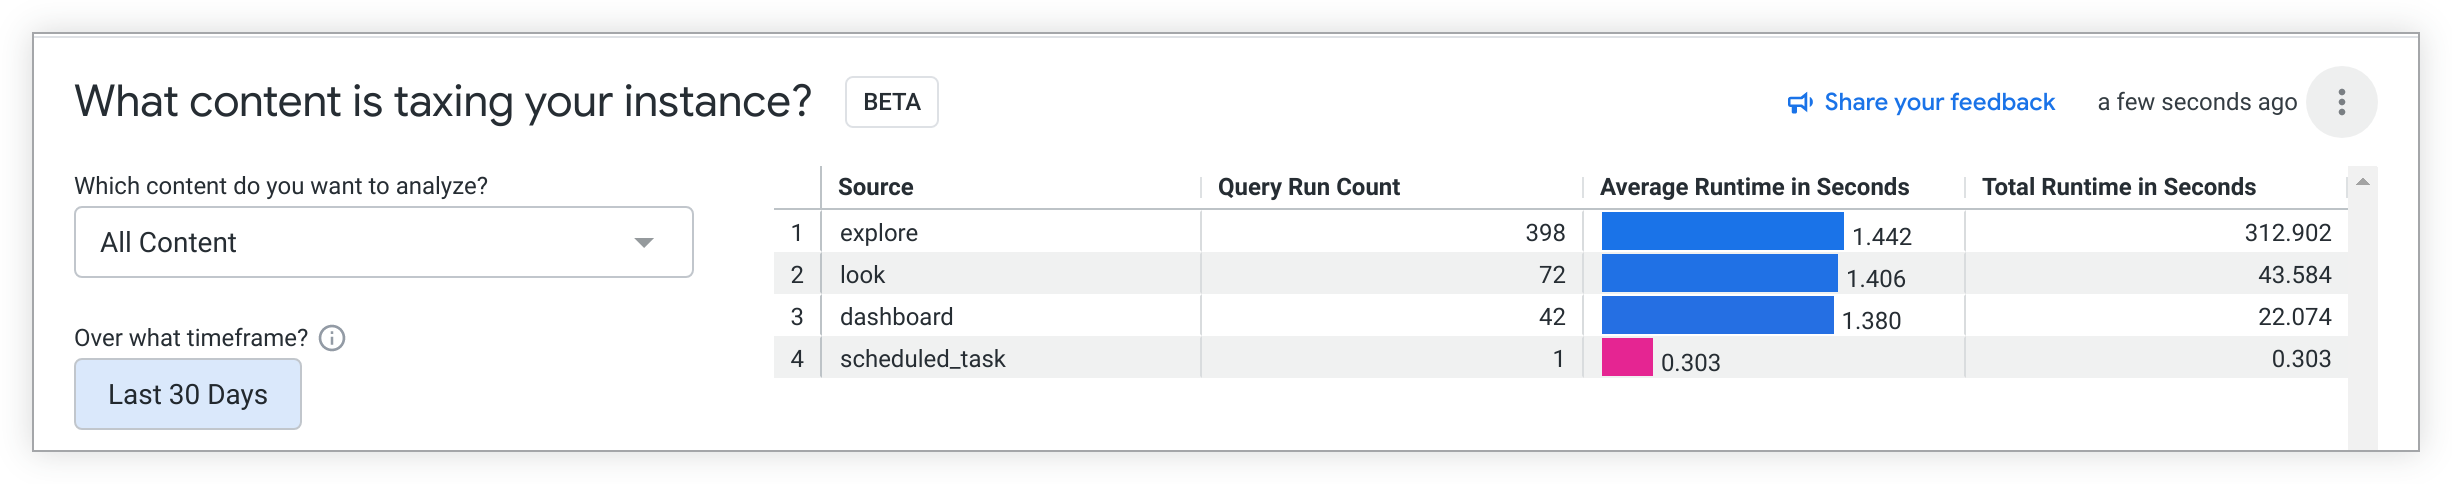
For example, you can select the What content is taxing your instance?analysis to identify heavily used content on your Looker instance. After the guided analysis has loaded, you can change the default timeframe value in Over what timeframe?to Last 30 days.
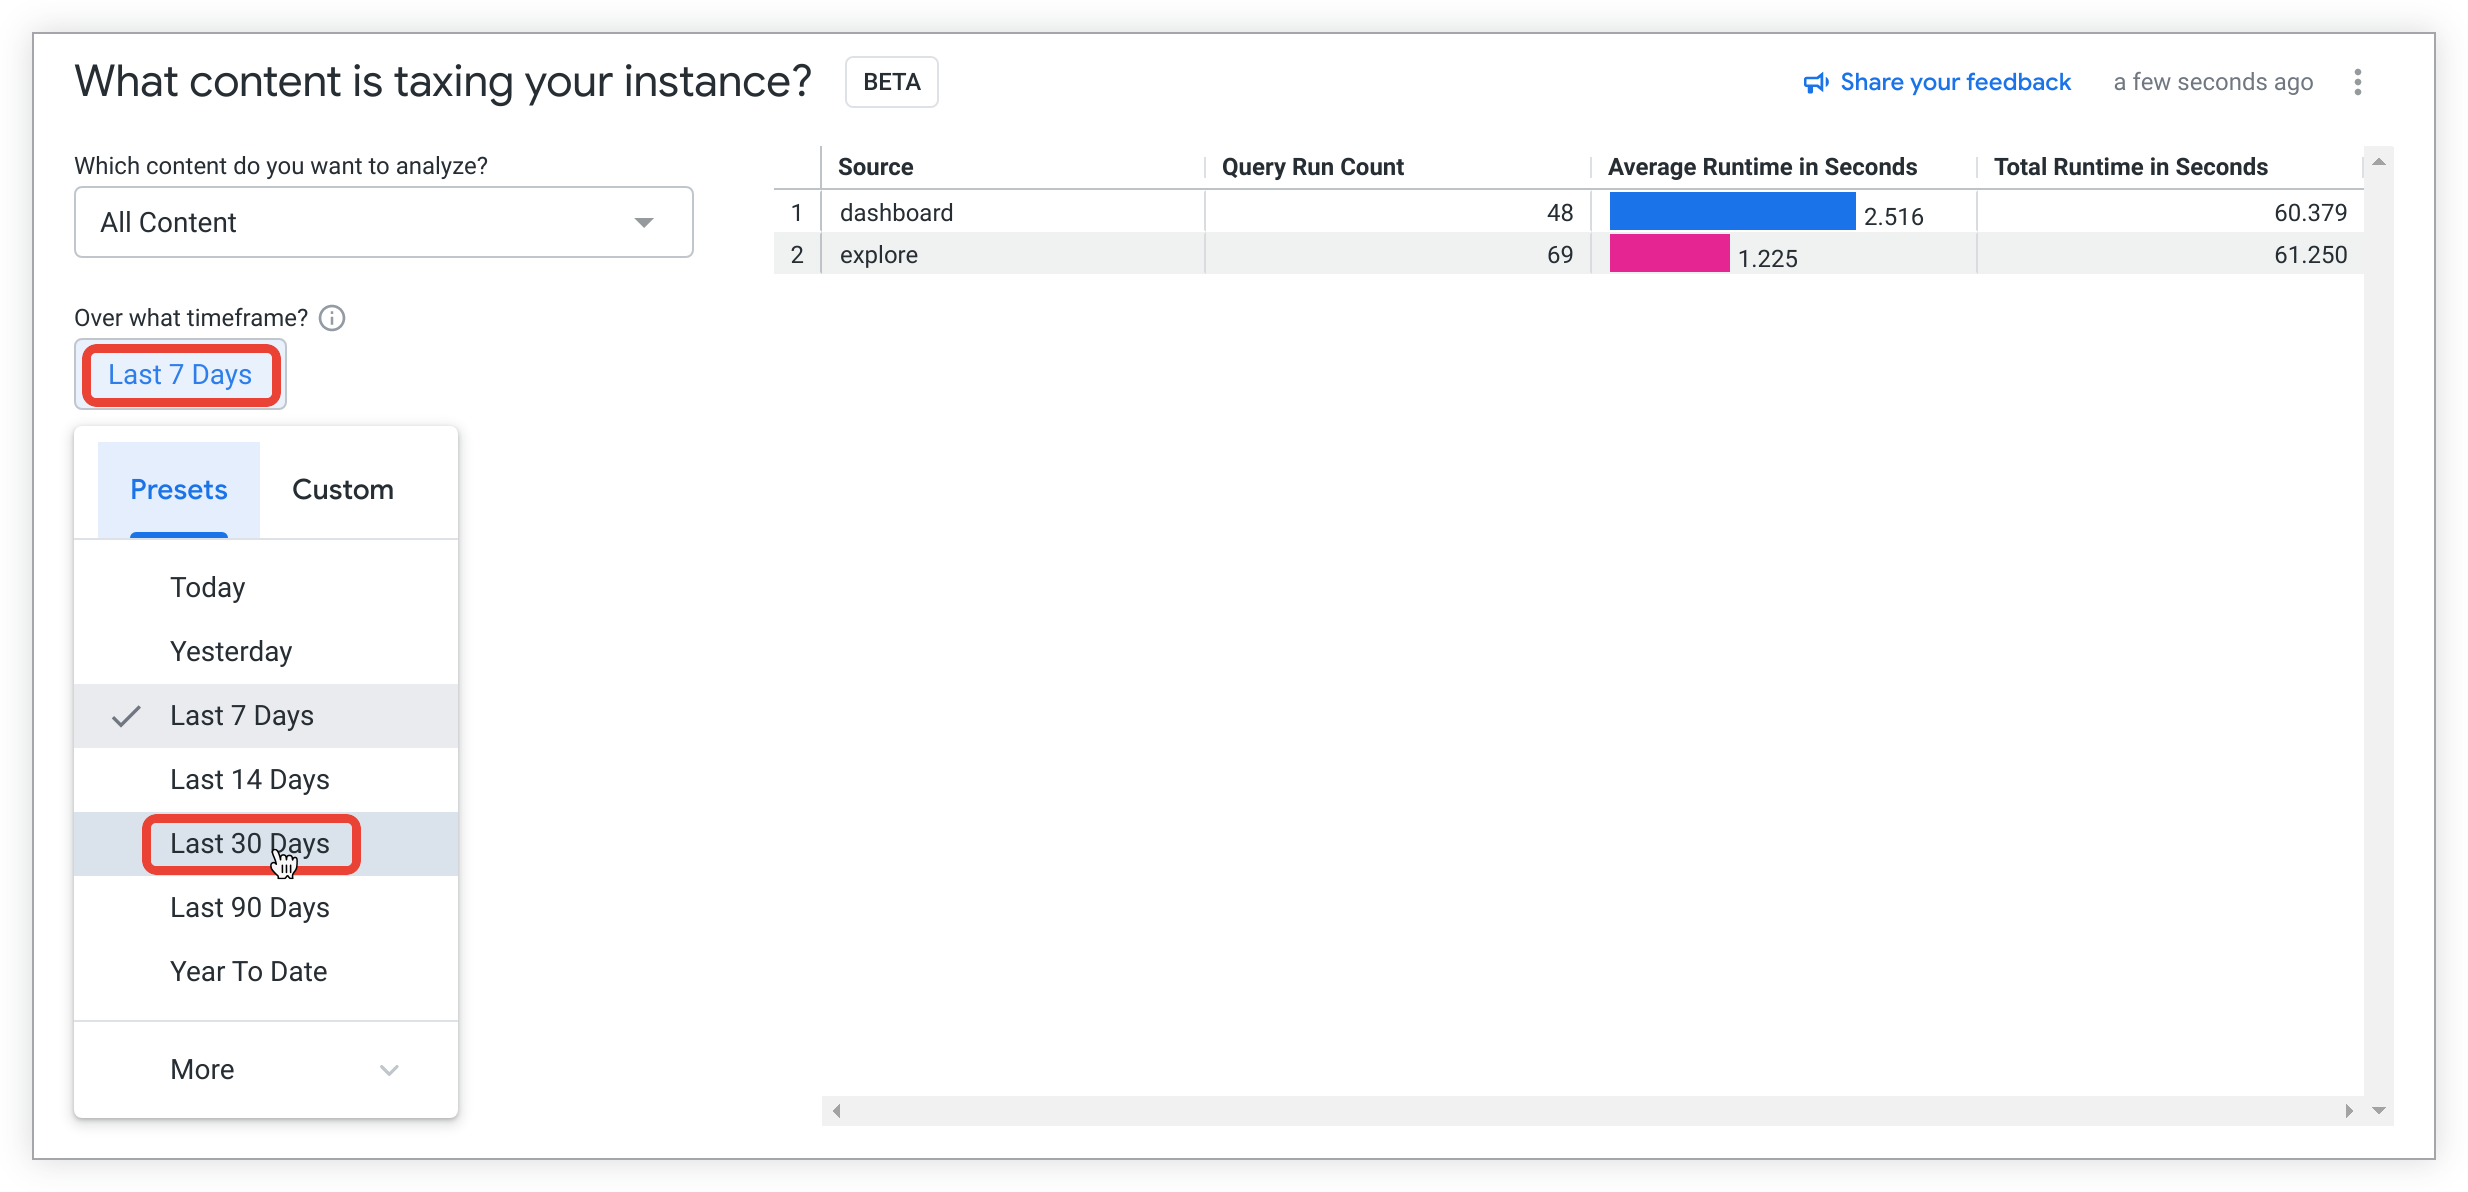
The guided analysis will automatically update with the selected timeframe value.
At this stage, you can choose whether to make additional insights into the analysis by exploring the data further. You can save the analysis as a Look or to a dashboard to share with other users who have access, or you can close the analysis by closing its browser window.
Guided Analysis three-dot Options menu
The three-dot Optionsmenu in a guided analysis lets users:

Exploring further into a guided analysis
Once you have the initial data from a guided analysis, you may choose to further explore the data. To do so, you can select the three-dot Optionsmenu, and then select Explore from Here.
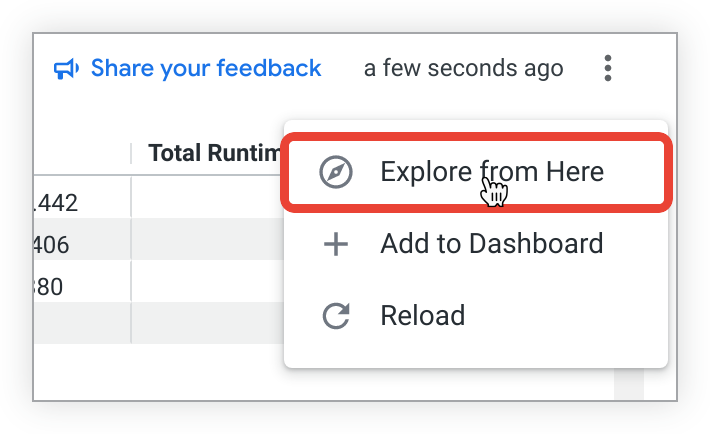
A new browser tab will open with an Explore that is pre-loaded with the fields and visualization from the guided analysis.
You can make further data insights by adding or removing fields, pivots, or filters, among other customizations. See the Creating and editing Explores documentation page for more Explore best practices and tips.
Saving a guided analysis
After customizing a guided analysis, you may want to save the analysis to share with others that have access. You can save a guided analysis in two ways:
Adding a guided analysis visualization to a dashboard
To add a guided analysis visualization to a dashboard, open the Save Guided Analysis to a Dashboardmenu by selecting + Add to Dashboardfrom the three-dot Optionsmenu.
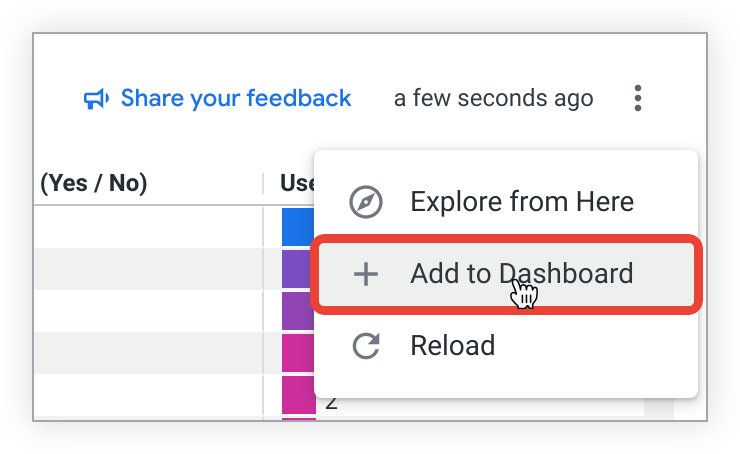
Once the Save Guided Analysis to a Dashboardmenu opens, follow these steps:

- Input a title for the guided analysis dashboard tile.
- Select a folder where the dashboard to which you would like to add the guided analysis is saved.
- Select the dashboard.
-
Select Save.
A dialog will pop up to notify you that the guided analysis has been added to the selected dashboard.
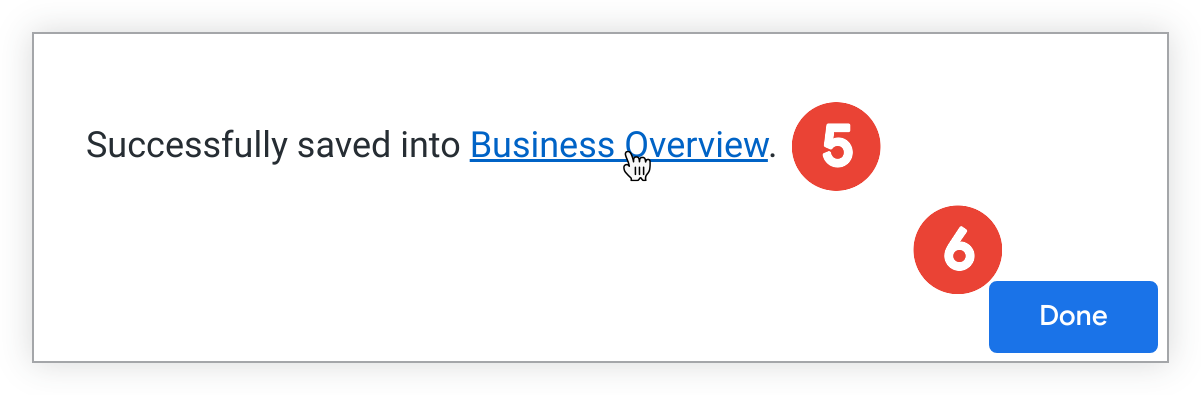
-
Select the link to navigate to the dashboard to view or make edits to the dashboard.
-
Alternatively, select Doneto exit the pop-up.
Saving a guided analysis as a Look
To save a guided analysis as a Look, select the Explore from Hereoption from the three-dot Optionsmenu:
A new browser tab will open with an Explore that is pre-loaded with the fields and visualization from the guided analysis:

Follow these steps to save the Explore as a Look:
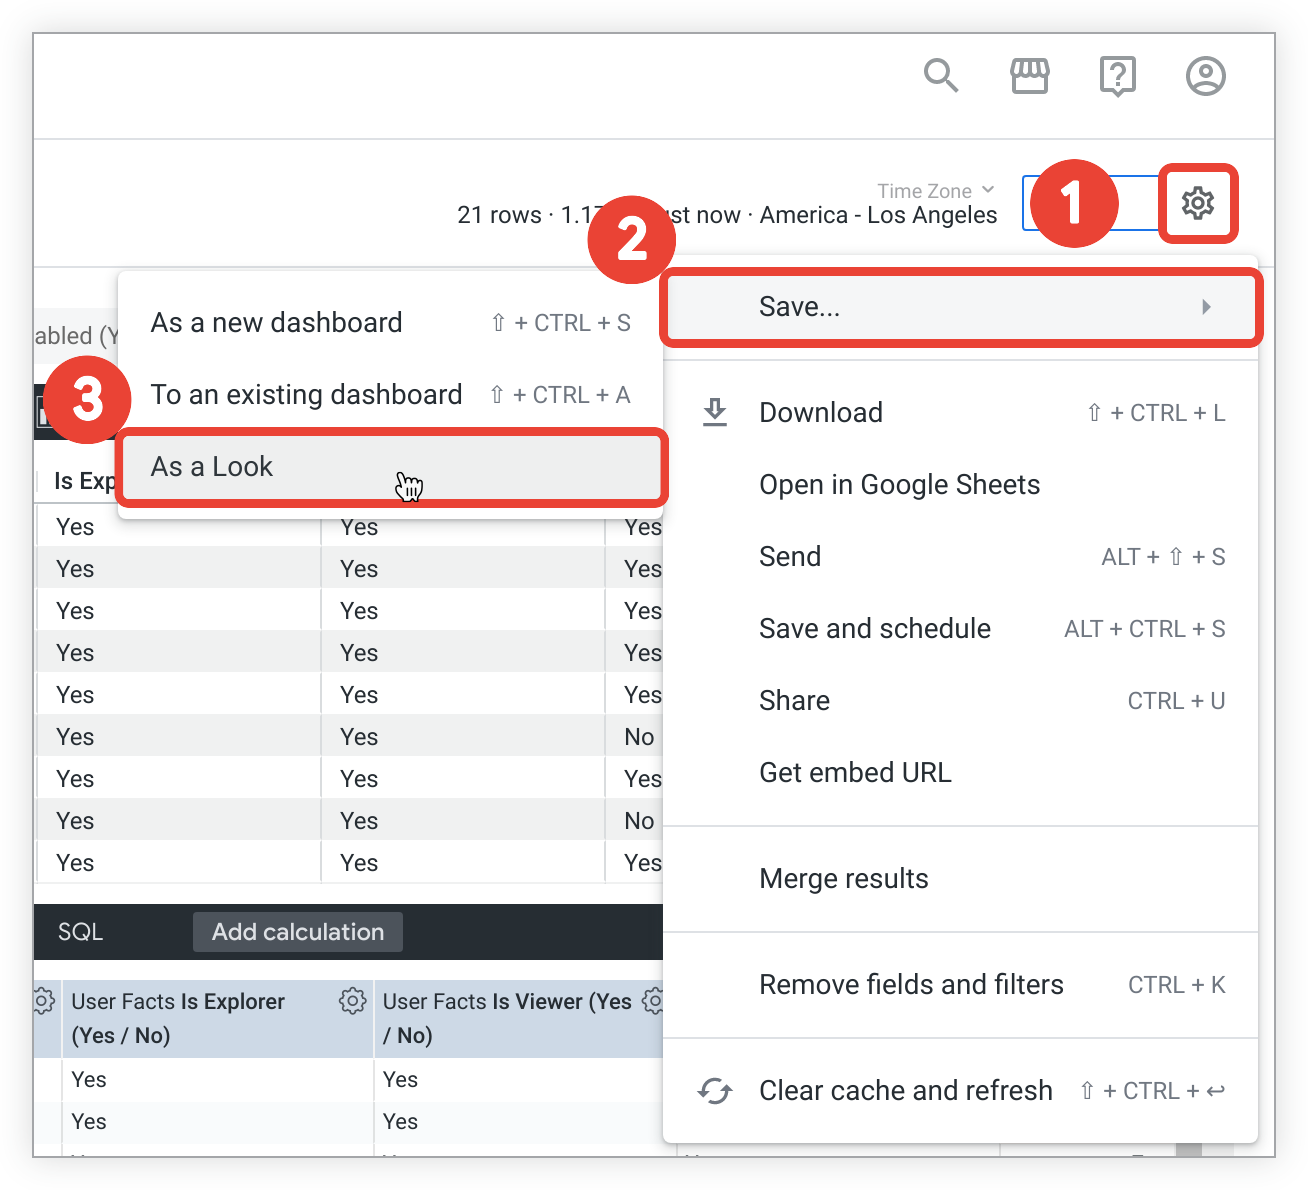
- In the upper right of the Explore, select the gear menu.
- Choose Save.
-
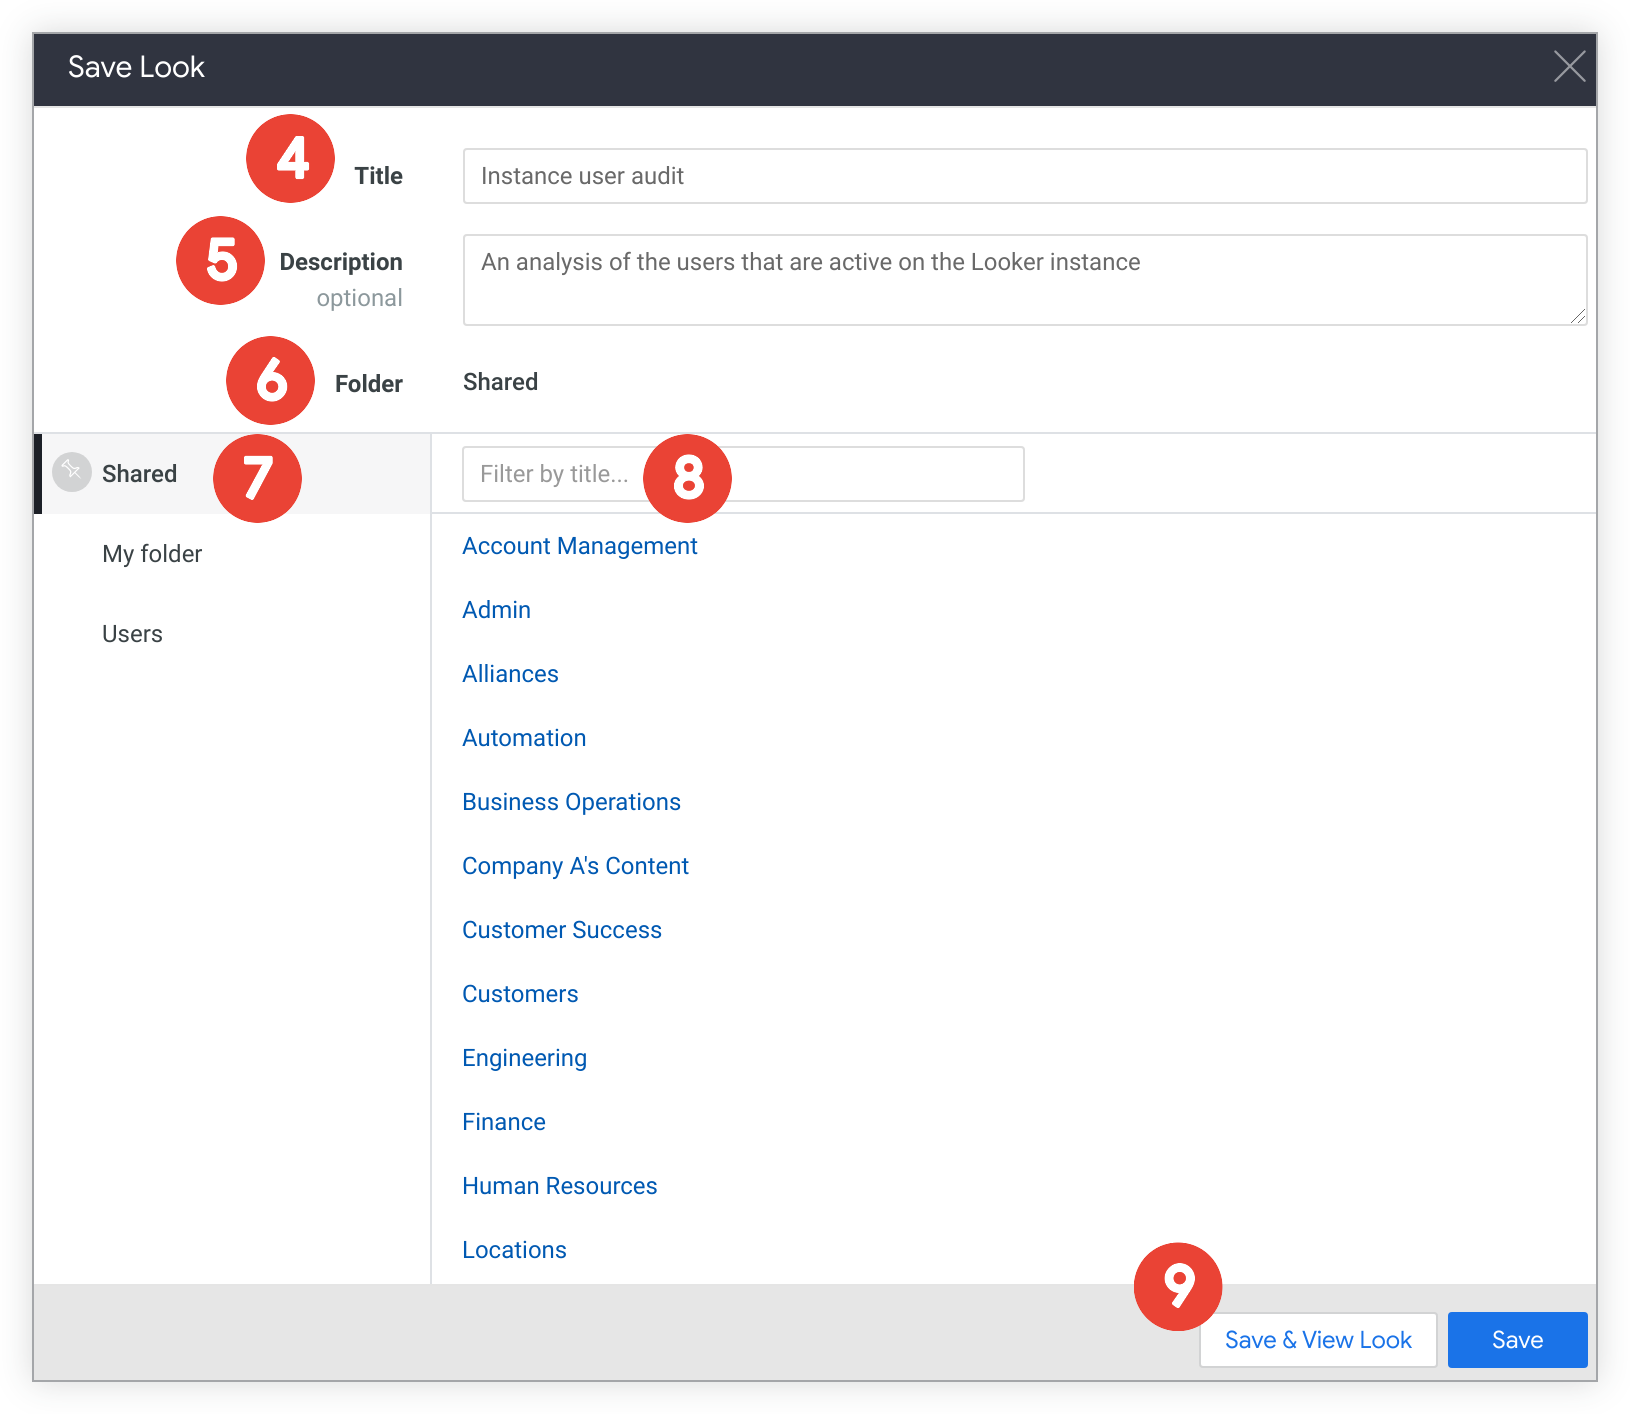
Select As a Lookto open the Save Lookmenu.
-
In the Titlefield, enter a new title. If you will be saving over an existing Look, leave this field blank.
-
In the Descriptionfield, you can enter a description of the Look. If you will be saving over an existing Look, leave this field blank.
-
In the Folderfield, check whether the current folder is the correct destination. The Folderfield shows the name and location of the selected folder, and the contents of the selected folder. If you choose a folder in which you are not allowed to save the Look, a warning will be displayed, and the Save & View Lookbutton will be deactivated.
-
If you want to save to a different folder, navigate to the folder where you want to save your Look. You can navigate to the folder in any of the following ways:
- In the Folderfield, select any parent folders to navigate there.
- Select the name of a top-level folder to navigate to it.
- Select the name of a subfolder that you want to use, or navigate to one of its subfolders.
- If there are many subfolders, you can enter the subfolder name into the Filter by titlefield to have the list filtered to just that subfolder.
-
If you want to save over an existing Look, navigate through the list of Looks or use the Filter by titlefield to find and select the Look that you want. The Look's title and description (if any) appear in the Titleand Descriptionfields.
-
Save your Look.
- To save your Look and return to the Explore page, select Save.
- To save and view your Look, select Save & View Look.
You can also select other options from the Explore to save or share the Guided AnalysisExplore, such as:
- Download — To download the Guided AnalysisExplore
- Send — To send the Guided AnalysisExplore as a one-off delivery
- Save and Schedule — To save the Guided AnalysisExplore as a Look or dashboard and set a recurring delivery
- Merge Results — To merge the Guided AnalysisExplore results with other Explore results
Reloading a guided analysis
To reload the data in a guided analysis, select the Reloadoption from the three-dot Optionsmenu.
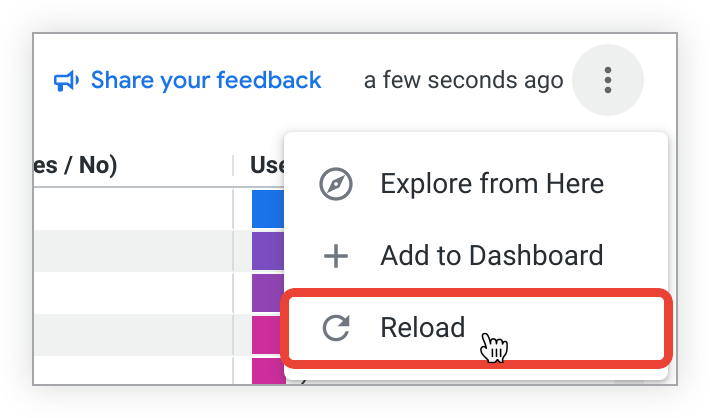
The guided analysis will refresh and display the latest data.