Google Distributed Cloud (software only) for bare metal supports multiple options for cluster logging and monitoring, including cloud-based managed services, open source tools, and validated compatibility with third-party commercial solutions. This page explains these options and provides basic guidance on selecting the right solution for your environment.
This page is for Admins and architects and Operators who want to monitor the health of deployed applications or services, such as for service level objective (SLO) compliance. To learn more about common roles and example tasks that are referenced in Google Cloud content, see Common GKE user roles and tasks .
Options for Google Distributed Cloud
You have several logging and monitoring options for your cluster:
- Cloud Logging and Cloud Monitoring, enabled by default on bare metal system components.
- Prometheus and Grafana are available from the Cloud Marketplace.
- Validated configurations with third-party solutions.
Cloud Logging and Cloud Monitoring
Google Cloud Observability is the built-in observability solution for Google Cloud. It offers a fully managed logging solution, metrics collection, monitoring, dashboarding, and alerting. Cloud Monitoring monitors Google Distributed Cloud clusters in a similar way as cloud-based GKE clusters.
Cloud Logging and Cloud Monitoring are enabled by default when you create clusters with the required service accounts and Identity and Access Management (IAM) roles. You can't disable Cloud Logging and Cloud Monitoring. For more information about service accounts and the required roles, see Configure service accounts .
The agents can be configured to change the following:
- Scope of logging and monitoring, from only system components (the default) to both system components and applications.
- Level of metrics collected, from only an optimized set of metrics (the default) to all metrics.
See Configure Stackdriver agents for Google Distributed Cloud on this document for more information.
Logging and Monitoring provide a single, easy-to-configure, powerful cloud-based observability solution. We highly recommend Logging and Monitoring when running workloads on Google Distributed Cloud. For applications with components running on Google Distributed Cloud and standard on-premises infrastructure, you might consider other solutions for an end-to-end view of those applications.
-
For details about architecture, configuration, and what data is replicated to your Google Cloud project by default, see How Logging and Monitoring for Google Distributed Cloud works .
-
For more information about Logging, see the Cloud Logging documentation.
-
For more information about Monitoring, see the Cloud Monitoring documentation.
-
To learn how to view and use Cloud Monitoring resource utilization metrics from Google Distributed Cloud at fleet level, see Use the Google Kubernetes Engine overview .
Prometheus and Grafana
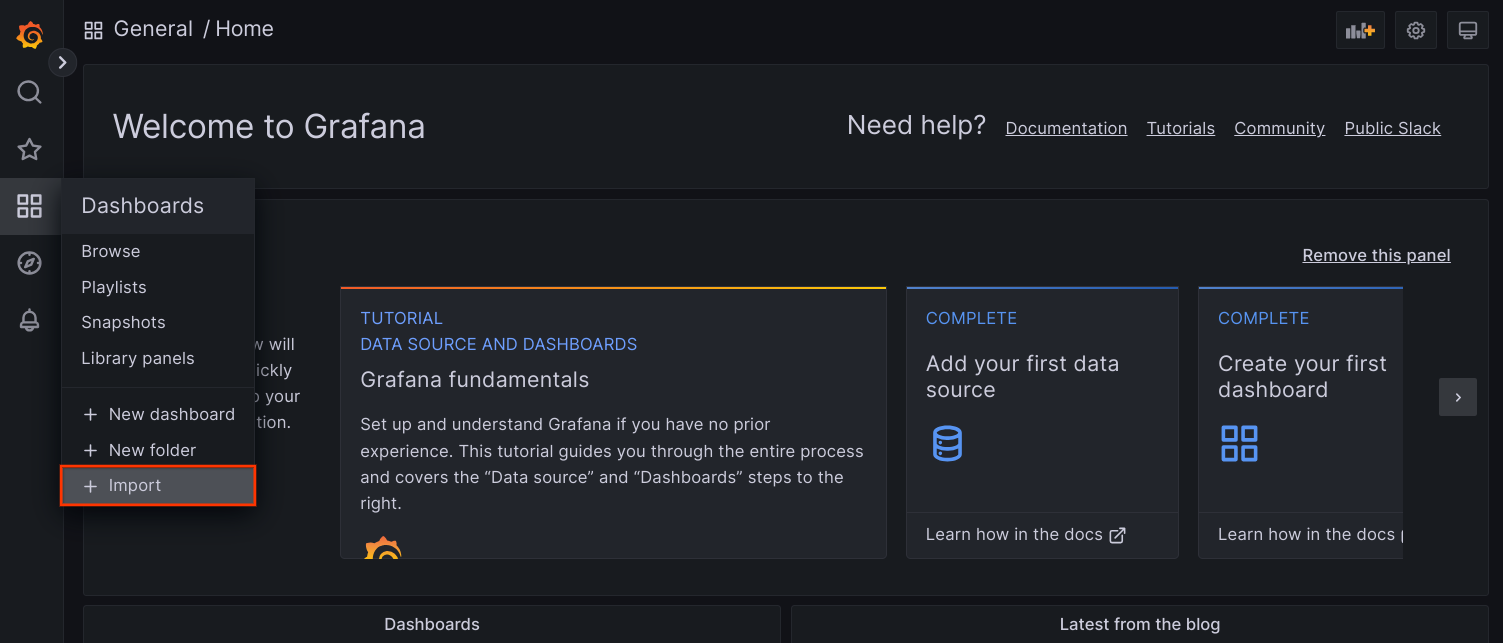
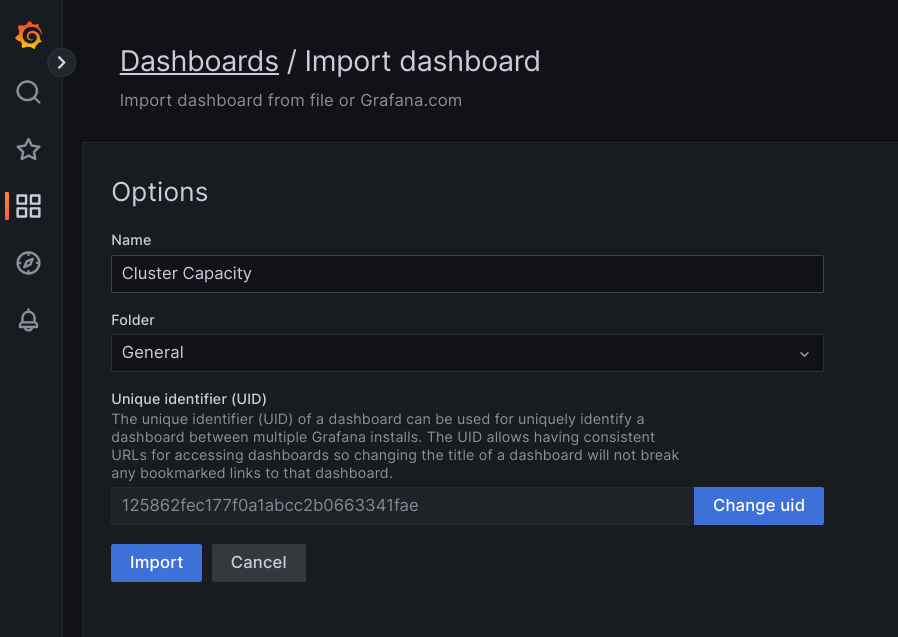
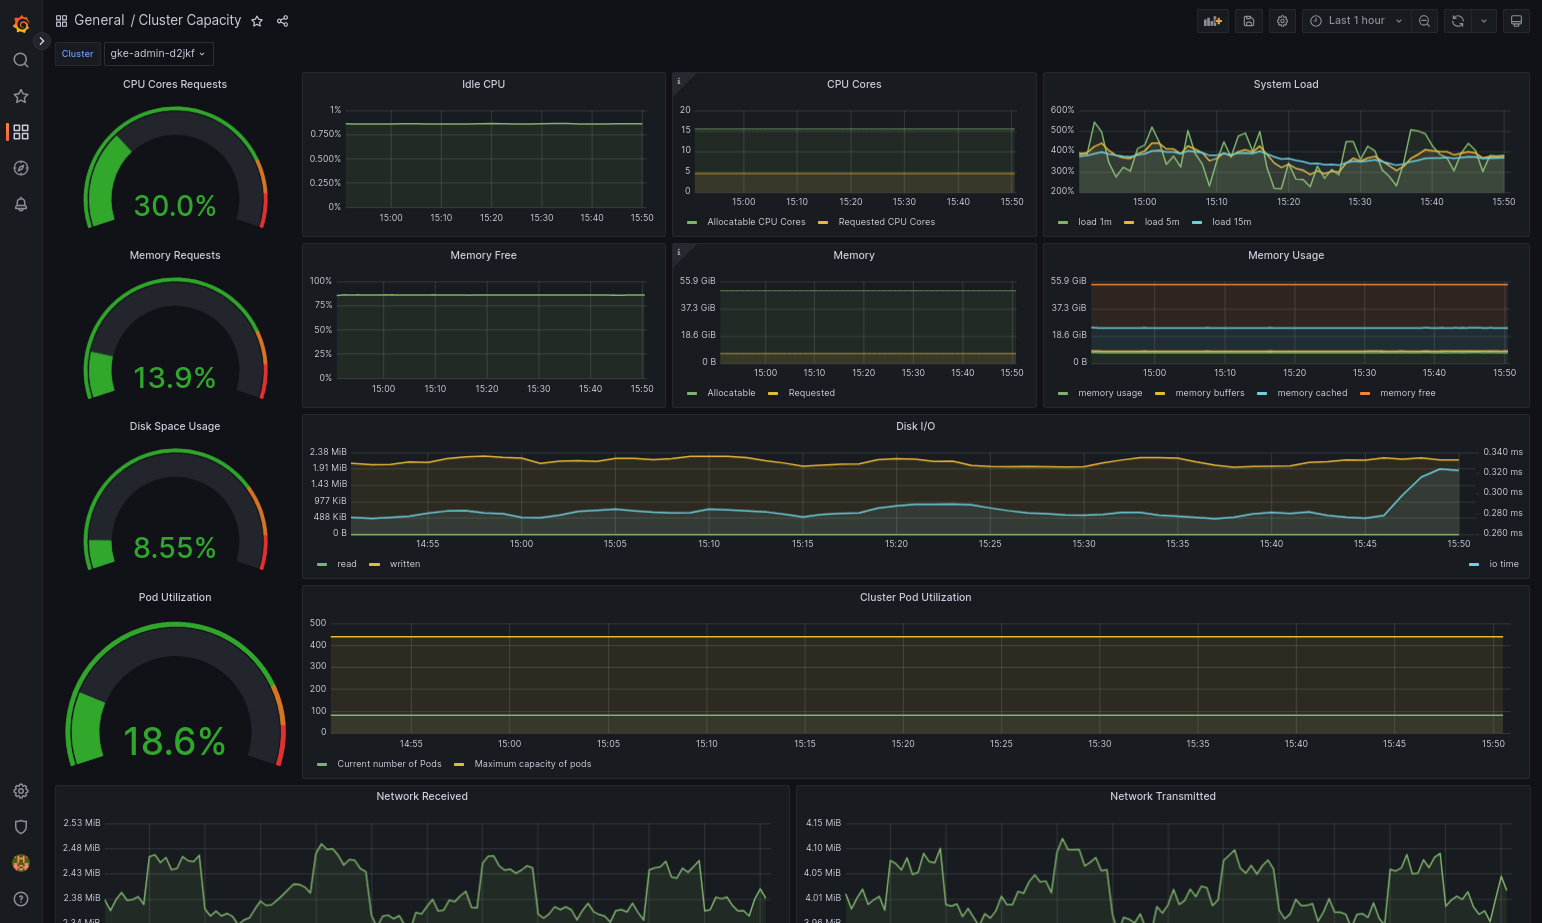
Prometheus and Grafana are two popular open source monitoring products available in the Cloud Marketplace :
-
Prometheus collects application and system metrics.
-
Alertmanager handles sending alerts with several different alerting mechanisms.
-
Grafana is a dashboarding tool.
We recommend that you use Google Cloud Managed Service for Prometheus, which is based in Cloud Monitoring, for all your monitoring needs. With Google Cloud Managed Service for Prometheus you can monitor system components without charge. Google Cloud Managed Service for Prometheus is also compatible with Grafana. However, if you prefer a pure local monitoring system, you can choose to install Prometheus and Grafana in your clusters.
If you installed Prometheus locally and want to collect metrics from system components, you need to give permission to your local Prometheus instance to access the metrics endpoints of system components:
-
Bind the service account for your Prometheus instance to the predefined
gke-metrics-agentClusterRole, and use service account token as credential to scrape metrics from the following system components:-
kube-apiserver -
kube-scheduler -
kube-controller-manager -
kubelet -
node-exporter
-
-
Use the client key and cert stored in the
kube-system/stackdriver-prometheus-etcd-scrapesecret to authenticate the metric scrape from etcd. -
Create a NetworkPolicy to allow access from your namespace to kube-state-metrics.
Third-party solutions
Google has worked with several third-party logging and monitoring solution providers to help their products work well with Google Distributed Cloud. These include Datadog, Elastic, and Splunk. Additional validated third parties will be added in the future.
The following solution guides are available for using third-party solutions with Google Distributed Cloud:
- Monitoring Google Distributed Cloud with the Elastic Stack
- Collect logs on Google Distributed Cloud with Splunk Connect
How Logging and Monitoring for Google Distributed Cloud works
Cloud Logging and Cloud Monitoring are installed and activated in each cluster when you create a new admin or user cluster.
The Stackdriver agents include several components on each cluster:
-
Stackdriver Operator(
stackdriver-operator-*). Manages the lifecycle for all other Stackdriver agents deployed onto the cluster. -
Stackdriver Custom Resource.A resource that is automatically created as part of the Google Distributed Cloud installation process.
-
GKE Metrics Agent(
gke-metrics-agent-*). An OpenTelemetry Collector based DaemonSet that scrapes metrics from each node to Cloud Monitoring. Anode-exporterDaemonSet and akube-state-metricsdeployment are also included to provide more metrics about the cluster. -
Stackdriver Log Forwarder(
stackdriver-log-forwarder-*). A Fluent Bit DaemonSet that forwards logs from each machine to the Cloud Logging. The log Forwarder buffers the log entries on the node locally and re-sends them for up to 4 hours. If the buffer gets full or if the Log Forwarder can't reach the Cloud Logging API for more than 4 hours, logs are dropped. -
Metadata Agent(
stackdriver-metadata-agent-). A deployment that sends metadata for Kubernetes resources such as pods, deployments, or nodes to the Config Monitoring for Ops API. This addition of metadata lets you query your metrics data by deployment name, node name, or even Kubernetes service name.
You can see the agents installed by Stackdriver by running the following command:
 kubectl
-n
kube-system
get
pods
-l
 "managed-by=stackdriver"
The output of this command is similar to the following:
 kube-system   gke-metrics-agent-4th8r                                     1/1     Running   1 (40h ago)   40h
kube-system   gke-metrics-agent-8lt4s                                     1/1     Running   1 (40h ago)   40h
kube-system   gke-metrics-agent-dhxld                                     1/1     Running   1 (40h ago)   40h
kube-system   gke-metrics-agent-lbkl2                                     1/1     Running   1 (40h ago)   40h
kube-system   gke-metrics-agent-pblfk                                     1/1     Running   1 (40h ago)   40h
kube-system   gke-metrics-agent-qfwft                                     1/1     Running   1 (40h ago)   40h
kube-system   kube-state-metrics-9948b86dd-6chhh                          1/1     Running   1 (40h ago)   40h
kube-system   node-exporter-5s4pg                                         1/1     Running   1 (40h ago)   40h
kube-system   node-exporter-d9gwv                                         1/1     Running   2 (40h ago)   40h
kube-system   node-exporter-fhbql                                         1/1     Running   1 (40h ago)   40h
kube-system   node-exporter-gzf8t                                         1/1     Running   1 (40h ago)   40h
kube-system   node-exporter-tsrpp                                         1/1     Running   1 (40h ago)   40h
kube-system   node-exporter-xzww7                                         1/1     Running   1 (40h ago)   40h
kube-system   stackdriver-log-forwarder-8lwxh                             1/1     Running   1 (40h ago)   40h
kube-system   stackdriver-log-forwarder-f7cgf                             1/1     Running   2 (40h ago)   40h
kube-system   stackdriver-log-forwarder-fl5gf                             1/1     Running   1 (40h ago)   40h
kube-system   stackdriver-log-forwarder-q5lq8                             1/1     Running   2 (40h ago)   40h
kube-system   stackdriver-log-forwarder-www4b                             1/1     Running   1 (40h ago)   40h
kube-system   stackdriver-log-forwarder-xqgjc                             1/1     Running   1 (40h ago)   40h
kube-system   stackdriver-metadata-agent-cluster-level-5bb5b6d6bc-z9rx7   1/1     Running   1 (40h ago)   40h
Configuration requirements for Logging and Monitoring
There are several configuration requirements to enable Cloud Logging and Cloud Monitoring with Google Distributed Cloud. These steps are included in Configuring a service account for use with Logging and Monitoring on the Enabling Google services page, and in the following list:
- A Cloud Monitoring Workspace must be created within the Google Cloud project. This is accomplished by clicking Monitoringin Google Cloud console and following the workflow.
-
You need to enable the following Stackdriver APIs:
-
You need to assign the following IAM roles to the service account used by the Stackdriver agents:
-
logging.logWriter -
monitoring.metricWriter -
stackdriver.resourceMetadata.writer -
monitoring.dashboardEditor -
opsconfigmonitoring.resourceMetadata.writer
-
Logs and metrics routing
Stackdriver log forwarder ( stackdriver-log-forwarder
) sends logs from each
node machine to Cloud Logging. Similarly, GKE metrics agent
( gke-metrics-agent
) sends metrics from each node machine to
Cloud Monitoring. Before the logs and metrics are sent, the Stackdriver
Operator ( stackdriver-operator
) attaches the value from the clusterLocation
field in the stackdriver
custom resource to each log entry and metric before
they're routed to Google Cloud. Additionally, the logs and metrics are
associated with the Google Cloud project
specified in the stackdriver
custom resource spec ( spec.projectID
).
All metrics and log entries sent by stackdriver agents are routed to a global ingestion endpoint. From there, the data is forwarded to the closest reachable regional Google Cloud endpoint to ensure the reliability of the data transport.
After the global endpoint receives the metric or log entry, what happens next is service-dependent:
-
How logs routing is configured: when the logging endpoint receives a log message, Cloud Logging passes the message through the Log Router. The sinks and filters in the Log Router configuration determine how to route the message. You can route log entries to destinations like regional Logging buckets, which store the log entry, or to Pub/Sub. For more information about how log routing works and how to configure it, see Routing and storage overview .
Neither the
clusterLocationfield in thestackdrivercustom resource or theclusterOperations.locationfield in the Cluster spec are considered in this routing process. For logs,clusterLocationis used to label log entries only, which can be helpful for filtering in Logs Explorer. -
How metrics routing is configured: when the metrics endpoint receives a metric entry, the entry is routed automatically to be stored in the location specified by the metric. The location in the metric came from the
clusterLocationfield in thestackdrivercustom resource. -
Plan your configuration: when you configure your Cloud Logging and Cloud Monitoring, configure Log Router and specify an appropriate
clusterLocationwith locations that best support your needs. For example, if you want logs and metrics to go to the same location, setclusterLocationto the same Google Cloud region that Log Router is using for your Google Cloud project. -
Update your configuration when needed: you can make changes anytime to the destination settings for logs and metrics due to business requirements, such as disaster recovery plans. Changes to the Log Router configuration in Google Cloud take effect quickly. The
locationandprojectIDfields in theclusterOperationssection of the Cluster resource are immutable, so they can't be updated after you create your cluster. We don't recommend that you change values in thestackdriverresource directly. This resource is reverted to the original cluster creation state whenever a cluster operation, such as an upgrade, triggers a reconciliation.
stackdriver
resource gets values for the clusterLocation
and projectID
fields from the location
and projectID
fields in the clusterOperations
section of the Cluster resource at cluster
creation time. Cloud Monitoring metrics
For a list of metrics collected by Cloud Monitoring, see View Google Distributed Cloud metrics .
Metrics Server
Metrics Server is the source of the container resource metrics for various autoscaling pipelines. Metrics Server retrieves metrics from kubelets and exposes them through the Kubernetes Metrics API. HPA and VPA then use these metrics to determine when to trigger autoscaling. Metrics server is scaled using addon- resizer.
In extreme cases where high pod density creates too much logging and monitoring
overhead, Metrics Server might be stopped and restarted due to resource
limitations. In this case, you can allocate more resources to metrics server by
editing the metrics-server-config
configmap in gke-managed-metrics-server
namespace, and changing the value for cpuPerNode
and memoryPerNode
.
 kubectl
edit
cm
metrics-server-config
-n
gke-managed-metrics-server
The example content of the ConfigMap is:
  apiVersion
 :

 v1
 data
 :

 NannyConfiguration
 :

 |-

 apiVersion: nannyconfig/v1alpha1

 kind: NannyConfiguration

 cpuPerNode: 3m

 memoryPerNode: 20Mi
 kind
 :

 ConfigMap
After updating the ConfigMap, recreate the metrics-server pods with the following command:
 kubectl
delete
pod
-l
k8s-app =
metrics-server
-n
gke-managed-metrics-server
Configure the Stackdriver custom resource
When you create a cluster, Google Distributed Cloud automatically creates a Stackdriver custom resource. You can edit the spec in the custom resource to override the default values for CPU and memory requests and limits for a Stackdriver component, and you can separately override the default storage size and storage class.
Override the default CPU and memory requests and limits for a Stackdriver component
Clusters with high pod density introduce higher logging and monitoring overhead. In extreme cases, Stackdriver components may report close to the CPU and memory utilization limit or even may be subject to constant restarts due to resource limits. In this case, to override the default values for CPU and memory requests and limits for a Stackdriver component, use the following steps:
-
Run the following command to open your Stackdriver custom resource in a command-line editor:
kubectl -n kube-system edit stackdriver stackdriver
-
In the Stackdriver custom resource, add the
resourceAttrOverridesection under thespecfield:resourceAttrOverride: DAEMONSET_OR_DEPLOYMENT_NAME / CONTAINER_NAME : LIMITS_OR_REQUESTS : RESOURCE : RESOURCE_QUANTITY
Note that the
resourceAttrOverridesection overrides all existing default limits and requests for the component you specify. The following components are supported byresourceAttrOverride:-
gke-metrics-agent/gke-metrics-agent -
stackdriver-log-forwarder/stackdriver-log-forwarder -
stackdriver-metadata-agent-cluster-level/metadata-agent -
node-exporter/node-exporter -
kube-state-metrics/kube-state-metrics
An example file looks like the following:
apiVersion: addons.gke.io/v1alpha1 kind: Stackdriver metadata: name: stackdriver namespace: kube-system spec: projectID: my-project clusterName: my-cluster clusterLocation: us-west-1a resourceAttrOverride: gke-metrics-agent/gke-metrics-agent: requests: cpu: 110m memory: 240Mi limits: cpu: 200m memory: 4.5Gi -
-
To save changes to the Stackdriver custom resource, save and quit your command-line editor.
-
Check the health of your Pod:
kubectl -n kube-system get pods -l "managed-by=stackdriver"
A response for a healthy Pod looks like the following:
gke-metrics-agent-4th8r 1/1 Running 1 40h
-
Check the Pod spec of the component to make sure the resources are set correctly.
kubectl -n kube-system describe pod POD_NAMEReplace
POD_NAMEwith the name of the Pod you just changed. For example,gke-metrics-agent-4th8r.The response looks like the following:
Name:         gke-metrics-agent-4th8r
  Namespace:    kube-system
  ...
  Containers:
    gke-metrics-agent:
      Limits:
        cpu: 200m
        memory: 4.5Gi
      Requests:
        cpu: 110m
        memory: 240Mi
      ...
Disable optimized metrics
By default, the metrics agents running in the cluster collect and report an optimized set of container, kubelet and kube-state-metrics metrics to Google Cloud Observability (formerly Stackdriver). If you require additional metrics, we recommend that you find a replacement from the list of Google Distributed Cloud metrics .
Here are some examples of replacements you might use:
| Disabled metric | Replacements |
|---|---|
kube_pod_start_time
|
container/uptime
|
kube_pod_container_resource_requests
|
container/cpu/request_cores
container/memory/request_bytes
|
kube_pod_container_resource_limits
|
container/cpu/limit_cores
container/memory/limit_bytes
|
To disable the optimized metrics default setting (not recommended), do the following:
-
Open your Stackdriver custom resource in a command-line editor:
kubectl -n kube-system edit stackdriver stackdriver
-
Set the
optimizedMetricsfield tofalse:apiVersion: addons.gke.io/v1alpha1 kind: Stackdriver metadata: name: stackdriver namespace: kube-system spec: projectID: my-project clusterName: my-cluster clusterLocation: us-west-1a optimizedMetrics: false
-
Save changes, and quit your command-line editor.
Configure Stackdriver agents for Google Distributed Cloud
The Stackdriver agents installed with Google Distributed Cloud collect data about system components for the purposes of maintaining and troubleshooting issues with your clusters. The following sections describe Stackdriver configuration and operating modes.
System Components Only (Default Mode)
Upon installation, Stackdriver agents are configured by default to collect logs and metrics, including performance details (for example, CPU and memory utilization), and similar metadata, for Google-provided system components. These include all workloads in the admin cluster, and for user clusters, workloads in the kube-system, gke-system, gke-connect, istio-system, and config-management- system namespaces.
System Components and Applications
To enable application logging and monitoring on top of the default mode, follow the steps in Enable application logging and monitoring .
Optimized metrics (Default metrics)
By default, the kube-state-metrics
deployments running in the cluster collect and report an
optimized set of kube metrics to Google Cloud Observability (formerly Stackdriver).
Fewer resources are needed to collect this optimized set of metrics, which improves overall performance and scalability.
Excluded kube metrics
The following kube metrics are excluded from the optimized metrics:
- kube_certificatesigningrequest_cert_length
- kube_certificatesigningrequest_condition
- kube_certificatesigningrequest_created
- kube_certificatesigningrequest_labels
- kube_configmap_annotations
- kube_configmap_info
- kube_configmap_labels
- kube_configmap_metadata_resource_version
- kube_daemonset_annotations
- kube_daemonset_created
- kube_daemonset_labels
- kube_daemonset_metadata_generation
- kube_daemonset_status_observed_generation
- kube_deployment_annotations
- kube_deployment_created
- kube_deployment_labels
- kube_deployment_spec_paused
- kube_deployment_spec_strategy_rollingupdate_max_surge
- kube_deployment_spec_strategy_rollingupdate_max_unavailable
- kube_deployment_status_condition
- kube_deployment_status_replicas_ready
- kube_endpoint_annotations
- kube_endpoint_created
- kube_endpoint_info
- kube_endpoint_labels
- kube_endpoint_ports
- kube_horizontalpodautoscaler_annotations
- kube_horizontalpodautoscaler_info
- kube_horizontalpodautoscaler_labels
- kube_horizontalpodautoscaler_metadata_generation
- kube_horizontalpodautoscaler_status_condition
- kube_job_annotations
- kube_job_complete
- kube_job_created
- kube_job_info
- kube_job_labels
- kube_job_owner
- kube_job_spec_completions
- kube_job_spec_parallelism
- kube_job_status_completion_time
- kube_job_status_start_time
- kube_job_status_succeeded
- kube_lease_owner
- kube_lease_renew_time
- kube_limitrange
- kube_limitrange_created
- kube_mutatingwebhookconfiguration_info
- kube_namespace_labels
- kube_networkpolicy_annotations
- kube_networkpolicy_labels
- kube_networkpolicy_spec_egress_rules
- kube_networkpolicy_spec_ingress_rules
- kube_node_annotations
- kube_node_role
- kube_persistentvolume_annotations
- kube_persistentvolume_labels
- kube_persistentvolumeclaim_access_mode
- kube_persistentvolumeclaim_annotations
- kube_persistentvolumeclaim_labels
- kube_pod_annotations
- kube_pod_completion_time
- kube_pod_container_resource_limits
- kube_pod_container_resource_requests
- kube_pod_container_state_started
- kube_pod_created
- kube_pod_init_container_info
- kube_pod_init_container_resource_limits
- kube_pod_init_container_resource_requests
- kube_pod_init_container_status_last_terminated_reason
- kube_pod_init_container_status_ready
- kube_pod_init_container_status_restarts_total
- kube_pod_init_container_status_running
- kube_pod_init_container_status_terminated
- kube_pod_init_container_status_terminated_reason
- kube_pod_init_container_status_waiting
- kube_pod_init_container_status_waiting_reason
- kube_pod_labels
- kube_pod_owner
- kube_pod_restart_policy
- kube_pod_spec_volumes_persistentvolumeclaims_readonly
- kube_pod_start_time
- kube_poddisruptionbudget_annotations
- kube_poddisruptionbudget_created
- kube_poddisruptionbudget_labels
- kube_poddisruptionbudget_status_expected_pods
- kube_poddisruptionbudget_status_observed_generation
- kube_poddisruptionbudget_status_pod_disruptions_allowed
- kube_replicaset_annotations
- kube_replicaset_created
- kube_replicaset_labels
- kube_replicaset_metadata_generation
- kube_replicaset_owner
- kube_replicaset_status_observed_generation
- kube_resourcequota_created
- kube_secret_annotations
- kube_secret_info
- kube_secret_labels
- kube_secret_metadata_resource_version
- kube_secret_type
- kube_service_annotations
- kube_service_created
- kube_service_info
- kube_service_labels
- kube_service_spec_type
- kube_statefulset_annotations
- kube_statefulset_created
- kube_statefulset_labels
- kube_statefulset_status_current_revision
- kube_statefulset_status_update_revision
- kube_storageclass_annotations
- kube_storageclass_created
- kube_storageclass_info
- kube_storageclass_labels
- kube_validatingwebhookconfiguration_info
- kube_validatingwebhookconfiguration_metadata_resource_version
- kube_volumeattachment_created
- kube_volumeattachment_info
- kube_volumeattachment_labels
- kube_volumeattachment_spec_source_persistentvolume
- kube_volumeattachment_status_attached
- kube_volumeattachment_status_attachment_metadata
The complete set of Google Distributed Cloud metrics is documented in View Anthos metrics .