

Monitor performance with client-side traces
To monitor and debug Firestore requests end-to-end, you can enable traces in the client libraries. Client-side tracing can provide a signal about the performance as experienced by your application, as well as insights that can help with debugging issues.
Client-side traces, which are collected by executing RPCs from the client, provide the following information:
- Spans with timestamps of when the client sent the RPC request and when the client received the RPC response, including latency introduced by the network and client system
- Attributes (key-value pairs) that surface information about the client and its configuration
- Logs associated with key events in the spans
- Stack traces if a crash occurs in the client
OpenTelemetry
Traces for the client libraries are instrumented using OpenTelemetry APIs. OpenTelemetry is an industry standard, open-source observability framework. OpenTelemetry offers a wide range of tools such as instrumentation APIs and SDKs, collectors, backend-specific exporters and flexible configuration options such as sampling controls and span limits.
Export traces with exporters and collectors
As part of your configurations, you can export your traces to an observability backend. Most observability service providers offer exporters for you to use, such as Cloud Trace .
In addition to an exporter, OpenTelemetry recommends setting up a Collector . A Collector lets your service offload data quickly and lets the collector take care of additional handling like retries, batching, and encryption. A Collector runs alongside your application. The collector receives OTLP messages, processes the messages, and exports them to your observability backend.
Limitations
Client-side traces have the following limitations:
- Trace spans are available for the Java and Node.js client libraries.
- The client library does not produce trace spans for real-time listeners .
Billing
In addition to Firestore usage, client-side tracing can incur charges.
There are no charges for collecting traces or usage of the OpenTelemetry framework.
Ingestion of trace spans into your observability backend may be billable. For example, if you use Cloud Trace as your backend, you are billed according to Cloud Trace pricing . If you use another observability service provider, find out their billing model and associated costs.
To better understand billing, start with a small trace sampling ratio (trace a small percentage of your RPCs) based on your traffic.
Before you begin
Before you begin:
-
Make sure you set up the service account under which your app writes traces to your observability backend with the necessary Identity and Access Management roles :
Trace operation IAM role Read traces roles/cloudtrace.userWrite traces roles/cloudtrace.agentRead/write traces roles/cloudtrace.admin -
Verify Trace API is enabled on this project.
Configure client-side traces
This section provides example configurations for client-side traces. You can export to a Collector or directly to an observability backend. You also have the following options for configuring client-side traces:
- You can configure traces with the OpenTelemetry APIs. This requires code changes to your application. See the following examples:
- You can configure traces without code changes by following the examples in Zero-code instrumentation .
Export traces to a Collector with OpenTelemetry APIs
The following code configures the client library to export spans with a 10% sampling ratio to an OpenTelemetry Collector.
Java (Admin)
  Resource

 resource

 =

 Resource

 .
 getDefault
 ().
 merge
 (
 Resource
 .
 builder
 ().
 put
 (
 SERVICE_NAME
 ,

 "My App"
 ).
 build
 ());
 OtlpGrpcSpanExporter

 otlpGrpcSpanExporter

 =

 OtlpGrpcSpanExporter

 .
 builder
 ()

 .
 setEndpoint
 (
 "http://localhost:4317"
 )

 // Replace with your OTLP endpoint

 .
 build
 ();
 // Using a batch span processor
 // You can also use other `BatchSpanProcessorBuilder` methods
 // to further customize.
 BatchSpanProcessor

 otlpGrpcSpanProcessor

 =

 BatchSpanProcessor
 .
 builder
 (
 otlpGrpcSpanExporter
 ).
 build
 ();
 // Export to a collector that is expecting OTLP using gRPC.
 OpenTelemetrySdk

 otel

 =

 OpenTelemetrySdk
 .
 builder
 ()

 .
 setTracerProvider
 (

 SdkTracerProvider
 .
 builder
 ()

 .
 setResource
 (
 resource
 )

 .
 addSpanProcessor
 (
 otlpGrpcSpanProcessor
 )

 .
 setSampler
 (
 Sampler
 .
 traceIdRatioBased
 (
 0.1
 ))

 .
 build
 ())

 .
 build
 ();
 Firestore

 firestore

 =

 FirestoreOptions

 .
 newBuilder
 ()

 .
 setOpenTelemetryOptions
 (

 FirestoreOpenTelemetryOptions
 .
 newBuilder
 ()

 .
 setTracingEnabled
 (
 true
 )

 .
 setOpenTelemetry
 (
 otel
 )

 .
 build
 ())

 .
 build
 ().
 getService
 ();
Node.js (Admin)
  import

 {

 trace

 }

 from

 "@opentelemetry/api"
 ;
 import

 {
 GrpcInstrumentation
 }

 from

 '@opentelemetry/instrumentation-grpc'
 ;
 import

 pkg1

 from

 "@opentelemetry/sdk-trace-node"
 ;
 import

 pkg2

 from

 "@opentelemetry/instrumentation"
 ;
 import

 pkg3

 from

 "@opentelemetry/exporter-trace-otlp-grpc"
 ;
 const

 {

 NodeTracerProvider
 ,

 BatchSpanProcessor
 ,

 TraceIdRatioBasedSampler

 }

 =

 pkg1
 ;
 const

 {

 registerInstrumentations

 }

 =

 pkg2
 ;
 const

 {

 OTLPTraceExporter

 }

 =

 pkg3
 ;
 const

 provider

 =

 new

 NodeTracerProvider
 (

 // Provide your chosen NodeTracerConfig such as sampler and span limit

 {

 sampler
 :

 new

 TraceIdRatioBasedSampler
 (
 0.1
 ),

 }
 );
 provider
 .
 addSpanProcessor
 (
 new

 BatchSpanProcessor
 (
 new

 OTLPTraceExporter
 ()));
 provider
 .
 register
 ();
 // If you'd like to see gRPC spans (recommended), enable GrpcInstrumentation
 registerInstrumentations
 ({

 instrumentations
 :

 [

 new

 GrpcInstrumentation
 (

 // (optional): you can add GrpcInstrumentationConfig here

 ),

 ],
 });
 const

 settings
 :

 Settings

 =

 {

 projectId
 :

 'my-project-id'
 ,

 preferRest
 :

 false
 ,

 openTelemetry
 :

 {

 tracerProvider
 :

 trace
 .
 getTracerProvider
 ()

 }
 };
 // Initialize Firestore
 const

 firestore

 =

 new

 Firestore
 (
 settings
 );
 // Add app code here
 // Make sure to shut down your TracerProvider to flush any traces left in memory.
 process
 .
 on
 (
 'SIGINT'
 ,

 async

 ()

 =>

 {

 await

 provider

 .
 shutdown
 ()

 .
 catch
 (
 error

 =>

 console
 .
 error
 (
 'Error terminating NodeTracerProvider:'
 ,

 error
 ));
 });
Export directly to an observability backend with OpenTelemetry APIs
If your observability service provider supports OTLP ingestion, you can use their OpenTelemetry exporter to export traces directly to their backend. The following code configures the client library to directly export trace spans to Cloud Trace with a 10% trace sampling ratio.
Java (Admin)
  // TraceExporter needed for this use case
 import

 com.google.cloud.opentelemetry.trace.TraceExporter
 ;
 Resource

 resource

 =

 Resource

 .
 getDefault
 ().
 merge
 (
 Resource
 .
 builder
 ().
 put
 (
 SERVICE_NAME
 ,

 "My App"
 ).
 build
 ());
 SpanExporter

 gcpTraceExporter

 =

 TraceExporter
 .
 createWithDefaultConfiguration
 ();
 // Using a batch span processor
 // You can also use other `BatchSpanProcessorBuilder` methods
 // to further customize.
 SpanProcessor

 gcpBatchSpanProcessor

 =

 BatchSpanProcessor
 .
 builder
 (
 gcpTraceExporter
 ).
 build
 ();
 // Export directly to Cloud Trace with 10% trace sampling ratio
 OpenTelemetrySdk

 otel

 =

 OpenTelemetrySdk
 .
 builder
 ()

 .
 setTracerProvider
 (
 SdkTracerProvider
 .
 builder
 ()

 .
 setResource
 (
 resource
 )

 .
 addSpanProcessor
 (
 gcpBatchSpanProcessor
 )

 .
 setSampler
 (
 Sampler
 .
 traceIdRatioBased
 (
 0.1
 ))

 .
 build
 ())

 .
 build
 ();
 Firestore

 firestore

 =

 FirestoreOptions

 .
 newBuilder
 ()

 .
 setOpenTelemetryOptions
 (

 FirestoreOpenTelemetryOptions
 .
 newBuilder
 ()

 .
 setTracingEnabled
 (
 true
 )

 .
 setOpenTelemetry
 (
 otel
 )

 .
 build
 ())

 .
 build
 ().
 getService
 ();
Node.js (Admin)
  import

 {

 trace

 }

 from

 "@opentelemetry/api"
 ;
 import

 {
 GrpcInstrumentation
 }

 from

 '@opentelemetry/instrumentation-grpc'
 ;
 import

 {

 TraceExporter

 }

 from

 "@google-cloud/opentelemetry-cloud-trace-exporter"
 ;
 import

 pkg1

 from

 "@opentelemetry/sdk-trace-node"
 ;
 import

 pkg2

 from

 "@opentelemetry/instrumentation"
 ;
 const

 {

 NodeTracerProvider
 ,

 BatchSpanProcessor
 ,

 TraceIdRatioBasedSampler

 }

 =

 pkg1
 ;
 const

 {

 registerInstrumentations

 }

 =

 pkg2
 ;
 const

 provider

 =

 new

 NodeTracerProvider
 (

 // Provide your chosen NodeTracerConfig such as sampler and span limits

 {

 sampler
 :

 new

 TraceIdRatioBasedSampler
 (
 0.1
 ),

 }
 );
 provider
 .
 addSpanProcessor
 (
 new

 BatchSpanProcessor
 (
 new

 TraceExporter
 ()));
 provider
 .
 register
 ();
 // If you'd like to see gRPC spans (recommended), enable GrpcInstrumentation
 registerInstrumentations
 ({

 instrumentations
 :

 [

 new

 GrpcInstrumentation
 (

 // (optional): you can add GrpcInstrumentationConfig here

 ),

 ],
 });
 const

 settings
 :

 Settings

 =

 {

 projectId
 :

 'my-project-id'
 ,

 preferRest
 :

 false
 ,

 openTelemetry
 :

 {

 tracerProvider
 :

 trace
 .
 getTracerProvider
 ()

 }
 };
 // Initialize Firestore
 const

 firestore

 =

 new

 Firestore
 (
 settings
 );
 // ...
 // Make sure to shut down your TracerProvider to flush any traces left in memory.
 process
 .
 on
 (
 'SIGINT'
 ,

 async

 ()

 =>

 {

 await

 provider

 .
 shutdown
 ()

 .
 catch
 (
 error

 =>

 console
 .
 error
 (
 'Error terminating NodeTracerProvider:'
 ,

 error
 ));
 });
Zero-code instrumentation
Complete the following instructions to configure traces without code changes:
Java (Admin)
You can configure traces without code changes using auto agents. You need to set the environment variableFIRESTORE_ENABLE_TRACING=ON
. You also
need to set other configuration settings
as described in Agent Configuration
.
See the following examples. Export to a Collector with Auto Agents
Run your OpenTelemetry Collector with OTLP gRPC receivers enabled. Set the
agent's exporter to otlp
and specify the endpoint where the agent should
export the data. The following example uses a 10% sampling ratio and sends
traces to the Collector that listens on localhost port 4317
.
  FIRESTORE_ENABLE_TRACING
 =
 ON

\ java

\ -
 javaagent
 :
 path
 /
 to
 /
 opentelemetry
 -
 javaagent
 .
 jar

\ -
 Dotel
 .
 traces
 .
 exporter
 =
 otlp

\ -
 Dotel
 .
 exporter
 .
 otlp
 .
 endpoint
 =
 "http://localhost:4317"

\ -
 Dotel
 .
 traces
 .
 sampler
 =
 traceidratio

\ -
 Dotel
 .
 traces
 .
 sampler
 .
 arg
 =
 0.1

\ -
 Dotel
 .
 service
 .
 name
 =
 "My App"

\ -
 jar

 myapp
 .
 jar
Export directly to an observability backend with Auto Agents
In addition to setting the environment variable FIRESTORE_ENABLE_TRACING=ON
,
you need to add the OpenTelemetry Java agent extension for your specific
backend. The following example uses the Trace exporter extension
and a 10% trace sampling ratio.
  FIRESTORE_ENABLE_TRACING
 =
 ON

\ java

\ -
 javaagent
 :
 path
 /
 to
 /
 opentelemetry
 -
 javaagent
 .
 jar

\ -
 Dotel
 .
 javaagent
 .
 extensions
 =/
 path
 /
 to
 /
 exporter
 -
 auto
 -
 0.26
 .
 0
 -
 alpha
 -
 shaded
 .
 jar

\ -
 Dotel
 .
 traces
 .
 exporter
 =
 google_cloud_trace

\ -
 Dotel
 .
 traces
 .
 sampler
 =
 traceidratio

\ -
 Dotel
 .
 traces
 .
 sampler
 .
 arg
 =
 0.1

\
Node.js (Admin)
To set up zero-code instrumentation, follow the OpenTelemetry instructions for JavaScript instrumentation . The following example code snippet enables instrumentation and sends traces to an OpenTelemetry collector:
  npm

 install

 @
 opentelemetry
 /
 api
 npm

 install

 @
 opentelemetry
 /
 auto
 -
 instrumentations
 -
 node
 env

 \
 FIRESTORE_ENABLE_TRACING
 =
 ON

 \
 OTEL_TRACES_EXPORTER
 =
 otlp

 \
 OTEL_NODE_ENABLED_INSTRUMENTATIONS
 =
 "http,grpc"

 \
 OTEL_NODE_RESOURCE_DETECTORS
 =
 "none"

 \
 node

 --
 require

 @
 opentelemetry
 /
 auto
 -
 instrumentations
 -
 node
 /
 register

 my_app
 .
 js
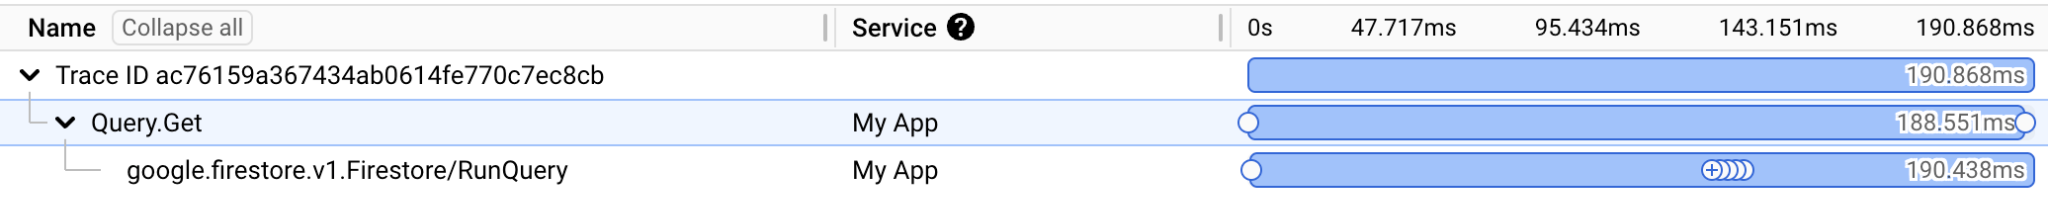
Example trace
The following examples show how trace information is displayed in Cloud Trace. For more information about possible attributes and values, see Trace span attributes and events .
Example trace span
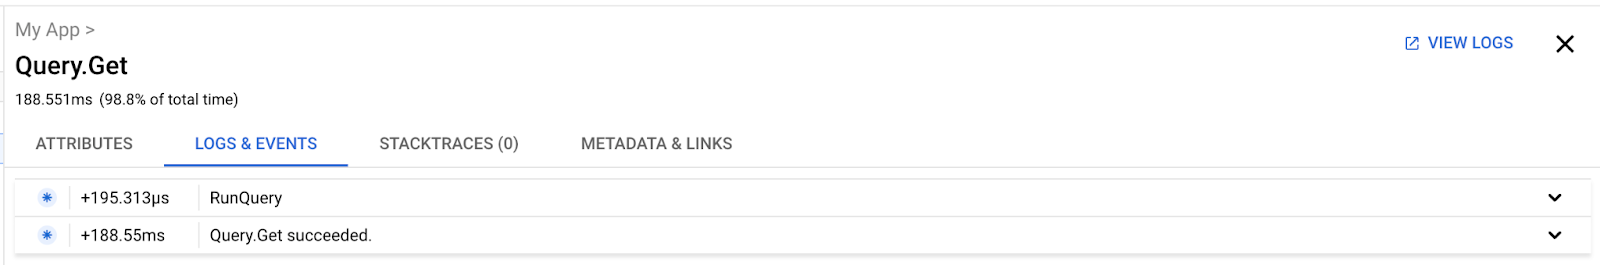
Example event log
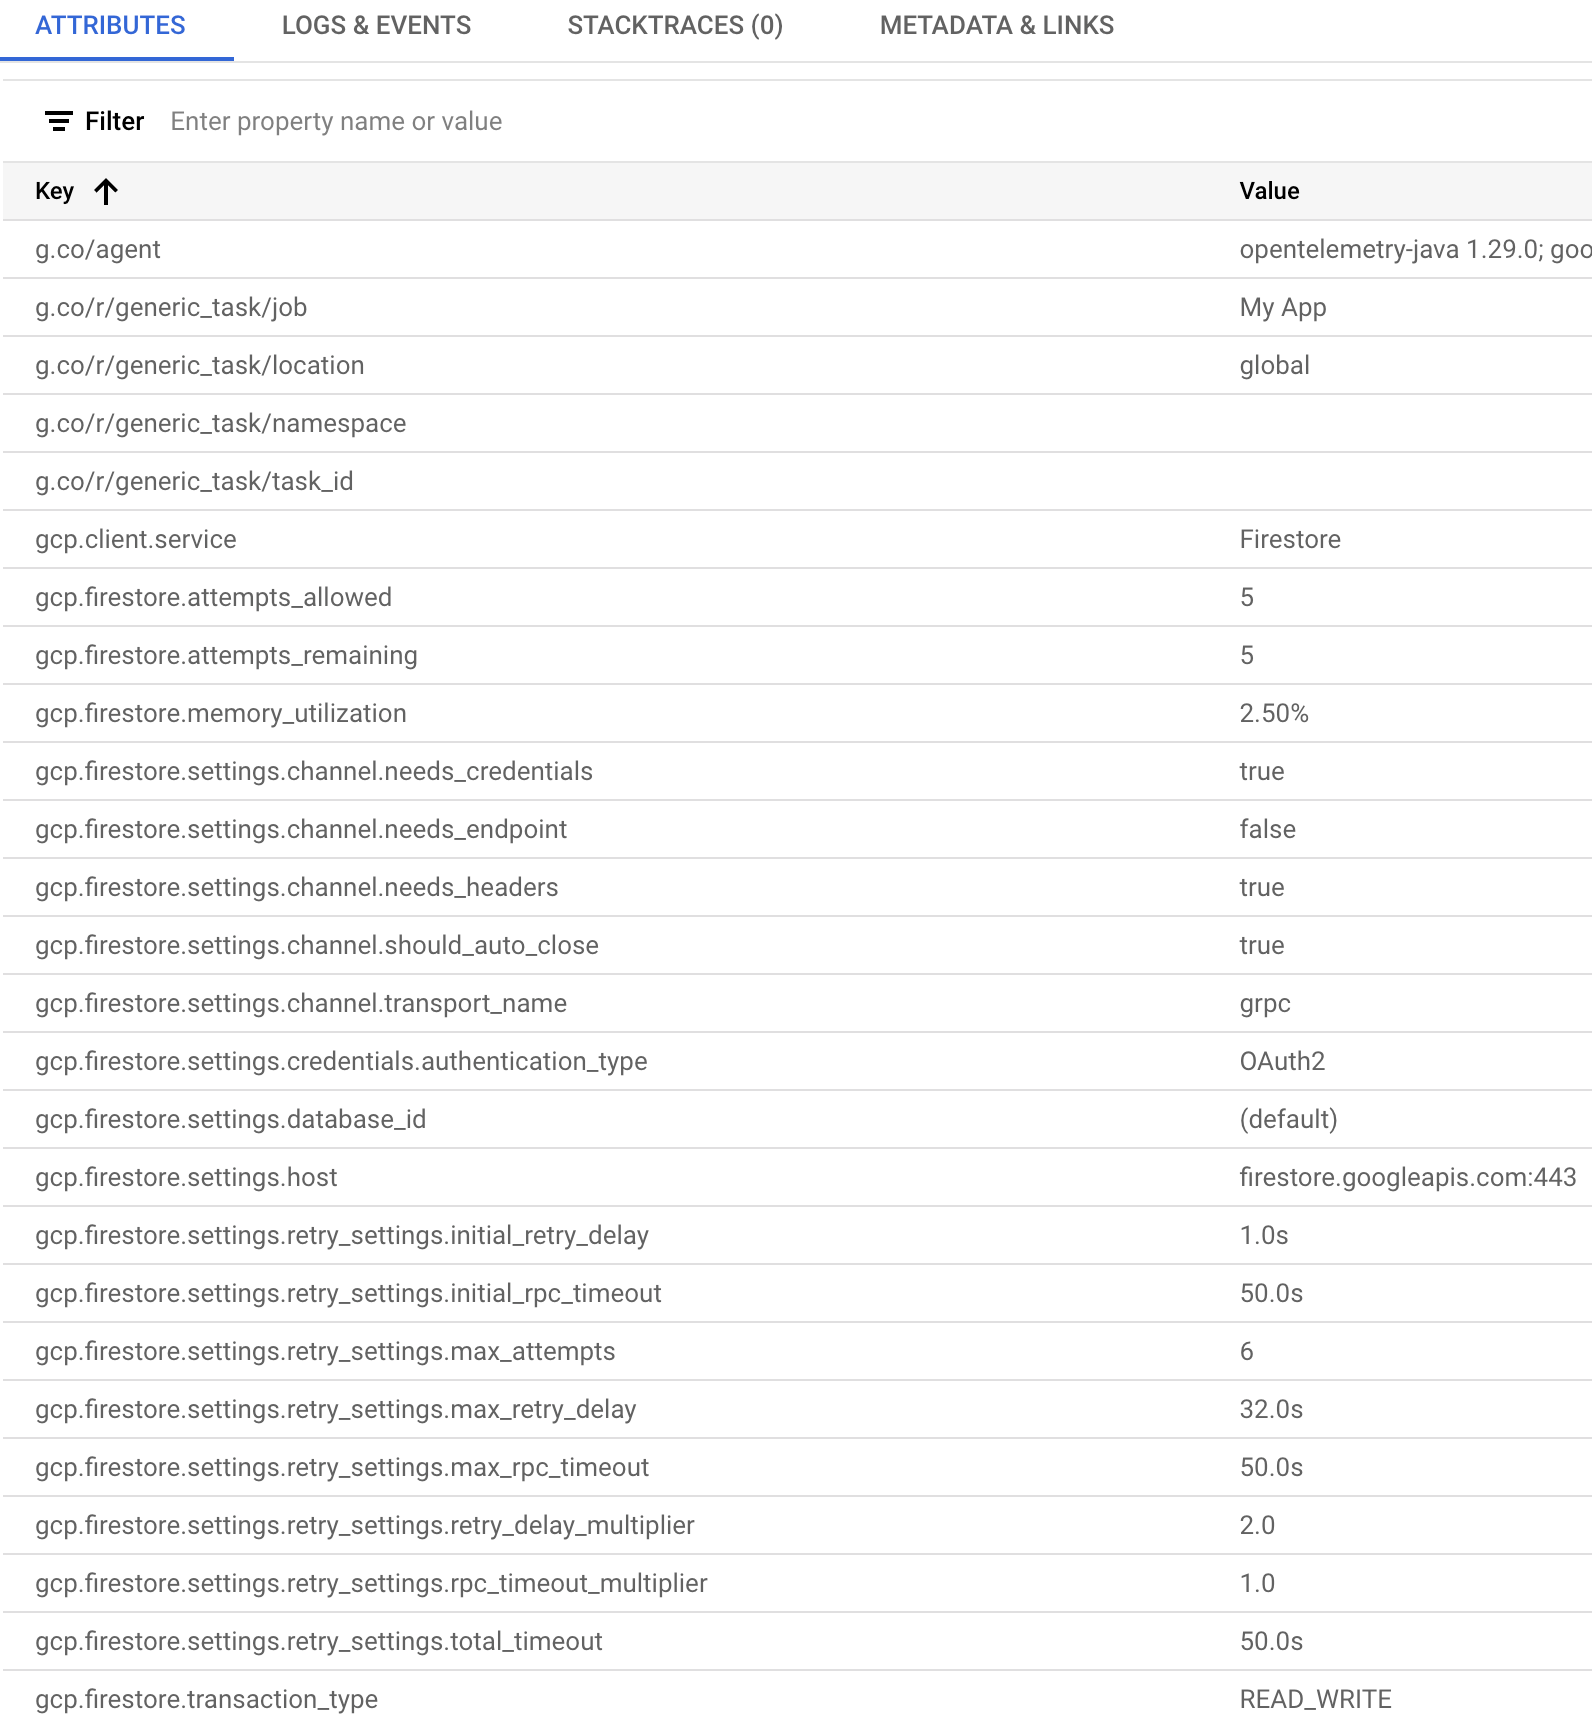
Example attribute values
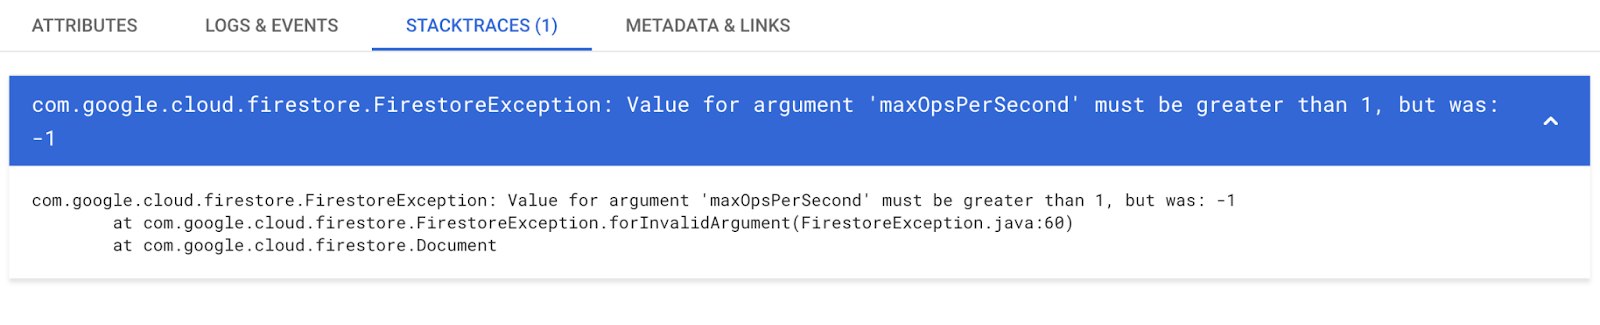
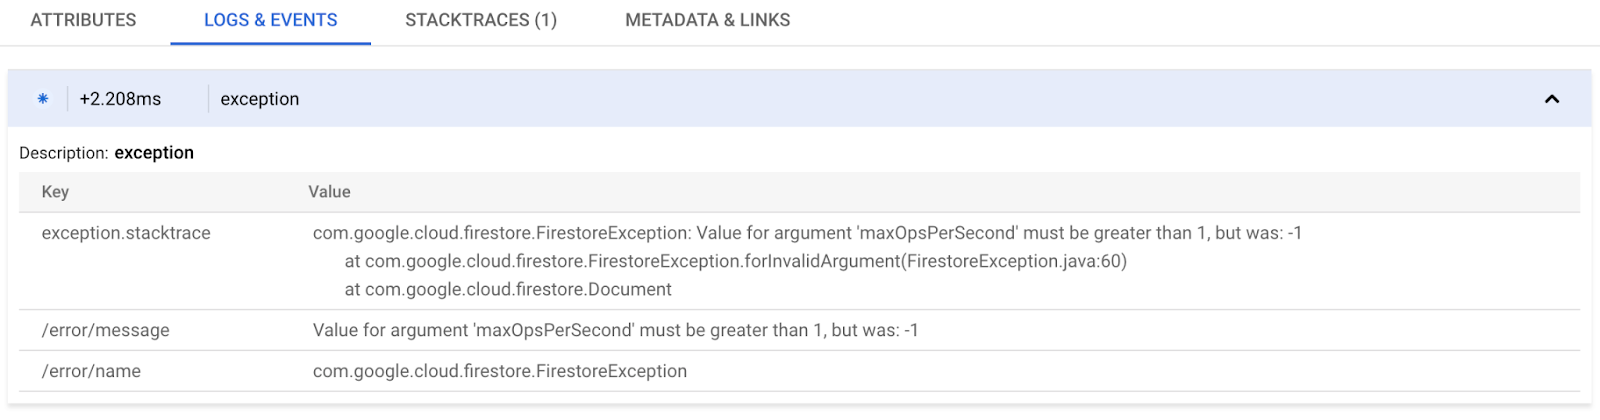
Example Stack Trace and Exception Event
What's next
- View the reference for Trace span attributes and events
- Learn about server-side monitoring