Create and manage notification channelsStay organized with collectionsSave and categorize content based on your preferences.
This document describes how to configure notification channels by using
the Google Cloud console. Cloud Monitoring uses these channels to notify you,
or your on-call team, when an alerting policy fires. When you create an
alerting policy, you select who is notified by making selections from the
list of configured notification channels. For example, you might configure
alerting policies that monitor Compute Engine instances to publish a
Pub/Sub topic and to notify the Slack channel for the on-call team.
This feature is supported only for Google Cloud projects.
ForApp Hubconfigurations, select the App Hub host project or management project.
Before you begin
To get the permissions that
you need to view and configure notification channels by using the Google Cloud console,
ask your administrator to grant you theMonitoring Editor(roles/monitoring.editor)
IAM role on your project.
For more information about granting roles, seeManage access to projects, folders, and organizations.
We recommend that you create multiple types of notification channels for
redundancy purposes due to the following reasons:
Google Cloud has no control of many of the delivery systems after we have
passed the notification to that system.
A single Google Cloud service supports Cloud Mobile App, PagerDuty,
Webhooks, and Slack. If you use one of these notification channels, then use
email or Pub/Sub as the redundant channel.
We discourage relying solely on SMS channels for notifications.
If you plan to use automation tools to read, reroute, transform, or otherwise
act on notifications, then use the Webhooks or Pub/Sub
channels. We don't recommend using other channel types with automation tools
because the notification format is subject to change.
Create a notification channel
When you are creating an alerting policy, you can select any
configured notification channel and add it to your policy. You can
pre-configure your notification channels, or you can configure them as part of
the process of creating an alerting policy. For more information,
seeCreate a channel on demand.
To create a notification channel by using the Google Cloud console,
follow the channel-specific instructions contained in the following table:
Email
To add an email notification channel, do the following:
In the Google Cloud console, go to thenotificationsAlertingpage:
If you use the search bar to find this page, then select the result whose subheading isMonitoring.
In the toolbar of the Google Cloud console,
select your Google Cloud project. ForApp Hubconfigurations, select the App Hub host project or management project.
ClickEdit notification channels.
In theEmailsection, clickAdd new.
Enter a single email address and a description.
ClickSave.
If you use a group email address as the notification channel for
an alerting policy, then configure the group to accept mail fromalerting-noreply@google.com.
You can create email channels during the creation of an alerting
policy. For more information, seeCreate a channel on demand.
Mobile App
Use theGoogle Cloud console Mobile Appto monitor your
Google Cloud console resources and Monitoring
information from anywhere. Google Cloud console Mobile App notifications are either
sent to a specific device or to a specific user:
Deviceindicates that notifications are sent only to the
specific device that created the notification channel. For
device-scoped notification channels, theDisplay namefield includes device information.
Userindicates that the notifications are sent to all of
your devices that have the Google Cloud console Mobile App installed.
Cloud Monitoring determines the notification scope when the channel
is created. You can't select or change the scope.
To configure a Google Cloud console Mobile App notification channel for a specific
Google Cloud project, do the following:
Install the Google Cloud console Mobile App from your mobile device's app store.
Select a project for viewing in the Google Cloud console Mobile App.
After you select a project, a data exchange between the app and
the selected Google Cloud project occurs.
A notification channel is created when one doesn't
exist, and after a few minutes, this channel is listed
under theMobile Devicessection of theNotification channelspage.
To add your mobile device as a notification channel for an alerting
policy, in the alertingNotificationssection, selectGoogle Cloud console (mobile)and then choose
your mobile device from the list.
PagerDuty
PagerDuty supports two-way synchronization
with Monitoring. As a result, the following are true:
If an incident is created in Monitoring, then
an incident is opened in PagerDuty.
You can't use PagerDuty to close an incident in
Monitoring.
If you resolve an incident in PagerDuty and if
Monitoring has the incident open, then the
incident is reopened in PagerDuty.
To set up PagerDuty notifications,
do the following:
In yourPagerDutyaccount, configure the integration in a new
service or add the integration to an existing service.
Create an account or sign in to an existing account.
Go to theServicespage.
To create a service, do the following:
Click+ New Service.
Enter a service name and description, and then clickNext.
Configure an escalation policy, and then clickNext.
If your PagerDuty account supports incident grouping
and transient alerts, configure them, and then clickNext.
On the integrations setup page, in theSearch for an
integration(s)toolbar, enterEvents API v1,
and then clickCreate Service. You are then returned to
theIntegrationspanel of your new service.
To edit an existing service, do the following:
Select a service from your Service Directory.
On your service page, select theIntegrationspanel.
Click+ Add another integrationto go to the integrations
setup page.
On the integrations setup page, in theSearch for an
integration(s)toolbar, enterEvents API v1,
and then clickAdd. You are then returned to theIntegrationspanel of your edited service.
On your service'sIntegrationspanel, find the listing for your
new integration, expand its menu, and then copy the integration key.
If you use the search bar to find this page, then select the result whose subheading isMonitoring.
In the toolbar of the Google Cloud console,
select your Google Cloud project. ForApp Hubconfigurations, select the App Hub host project or management project.
ClickEdit notification channels.
In thePagerDutysection, clickAdd new.
Enter theDisplay Name. This name should match the
name of the PagerDuty service where you configured your new
integration in Step 1.
Paste the integration key that you copied in Step 1 into theService Keyfield.
ClickSave.
When you create an alerting policy, selectPagerDutyin theNotificationssection and choose your PagerDuty configuration.
The JSON packet for PagerDuty has the following format:
To view an example and the schema for thedetailsfield,
expand the following sections.
JSON examples
By default, the alerting backend attempts to generate a JSON packet
with version 1.2 formatting. For more information about this formatting, see
the next section.
The following is an example of such a packet:
 {
  "incident": {
    "incident_id": "0.opqiw61fsv7p",
    "renotify": true,
    "scoping_project_id": "internal-project",
    "scoping_project_number": 12345,
    "url": "https://console.cloud.google.com/monitoring/alerting/incidents/0.lxfiw61fsv7p?project=internal-project",
    "severity": "no severity",
    "started_at": 1577840461,
    "ended_at": 1577877071,
    "state": "closed",
    "resource_id": "11223344",
    "resource_name": "internal-project gke-cluster-1-default-pool-e2df4cbd-dgp3",
    "resource_display_name": "gke-cluster-1-default-pool-e2df4cbd-dgp3",
    "resource_type_display_name": "VM Instance",
    "resource": {
      "type": "gce_instance",
      "labels": {
        "instance_id": "11223344",
        "project_id": "internal-project",
        "zone": "us-central1-c"
      }
    },
    "metric": {
      "type": "compute.googleapis.com/instance/cpu/utilization",
      "displayName": "CPU utilization",
      "labels": {
        "instance_name": "the name of the VM instance"
      }
    },
    "metadata": {
      "system_labels": { "labelkey": "labelvalue" },
      "user_labels": { "labelkey": "labelvalue" }
    },
    "policy_name": "Monitor-Project-Cluster",
    "policy_user_labels" : {
        "user-label-1" : "important label",
        "user-label-2" : "another label"
    },
    "condition_name": "VM Instance - CPU utilization [MAX]",
    "threshold_value": "0.9",
    "observed_value": "0.835",
    "condition": {
      "name": "projects/internal-project/alertPolicies/1234567890123456789/conditions/1234567890123456789",
      "displayName": "VM Instance - CPU utilization [MAX]",
      "conditionThreshold": {
        "filter": "metric.type=\"compute.googleapis.com/instance/cpu/utilization\" resource.type=\"gce_instance\" metadata.system_labels.\"state\"=\"ACTIVE\"",
        "aggregations": [
          {
            "alignmentPeriod": "120s",
            "perSeriesAligner": "ALIGN_MEAN"
          }
        ],
        "comparison": "COMPARISON_GT",
        "thresholdValue": 0.9,
        "duration": "0s",
        "trigger": {
          "count": 1
        }
      }
    },
    "documentation": {
      "content": "TEST ALERT\n\npolicy.name=projects/internal-project/alertPolicies/1234567890123456789\n\npolicy.display_name=Monitored-Project-NO-GROUPBY\n\ncondition.name=projects/nternal-project/alertPolicies/1234567890123456789/conditions/1234567890123456789\n\ncondition.display_name=VM Instance - CPU utilization [MAX]\n\nproject=internal-project\n\nresrouce.project=internal-project \n\nDONE\n",
      "mime_type": "text/markdown",
      "subject": "ALERT - No severity",
      "links": [
        {
          "displayName": "Playbook",
          "url": "https://myownpersonaldomain.com/playbook?name=${resource.name}"
        }
      ]
    },
    "summary": "CPU utilization for internal-project gke-cluster-1-16-default-pool-e2df4cbd-dgp3 with metric labels {instance_name=gke-cluster-1-default-pool-e2df4cbd-dgp3} and system labels {state=ACTIVE} returned to normal with a value of 0.835."
  },
  "version": "1.2"
}
Schema structure, version 1.2
This section describes version 1.2 of the payload schema. Some
fields might not appear in all returned packets or might have empty values,
depending on the configuration of the alerting policy, the state
of the incident, or the resource being monitored. Some fields
take embedded structures as values; these structures
are described by reference because their contents can also vary.
In a returned packet, the fields can occur in any order. In the
description that follows, they are organized into related groups.
{ "version": "1.2", "incident": {
Information about the incident.
"incident_id":
string, generated ID for this incident. "renotify": bool, optional. Set totruewhen the message is a repeated notification. "scoping_project_id":
string, the project ID that hosts the metrics scope. "scoping_project_number":
number, the project number of the scoping project. "url":
string, Google Cloud console URL for this incident. "started_at":
number, time (in Unix epoch seconds) when the incident was opened. "ended_at":
number, time (in Unix epoch seconds) when the incident was closed.
Populated only whenstateisclosed. "state":
string, state of the incident:openorclosed. Ifopen, thenended_atis null. "summary":
string, generated textual summary of the incident. "apigee_url":
string,ApigeeURL for this incident, only for Apigee
resource typesEnvironmentandProxy*. "observed_value":
string, observed value that triggered/resolved the alert, may
be empty if the condition is expired.
Information about the monitored resource for which the incident was opened.
"resource": { "type":
string, identifier of the monitored resource type being alerted on, for example,gce_instance; seeList of monitored resources. "labels":
object, key-value pairs for labels associated with the monitored resource. }, "resource_type_display_name":
string, display name of the monitored resource type. "resource_id":
string, instance ID of the monitored resource, same value asresource.labels.instance_id. "resource_display_name":
string, display name of the monitored resource. "resource_name":
string, generated name of this monitored resource; consists of values from other fields.
Information about the metric type of the time-series data.
"metric": { "type":
string, identifier of the metric type being alerted on, for example,compute.googleapis.com/instance/cpu/utilization;
seeList of metrics. "displayName":
string, display name of the metric type. "labels":
object, key-value pairs for labels associated with the metric. }, "metadata": { "system_labels":
object, key-value pairs for system metadata labels. "user_labels":
object, key-value pairs for user metadata labels. },
Information about the alerting policy and condition that opened/resolved the incident. The values are drawn from the relevantAlertPolicyobject.
"policy_name":
string, display name for the alerting policy. "policy_user_labels":
object, key-value pairs for any user labels attached to the policy. "documentation":
object, an embedded structure of the formDocumentation. "condition":
object, an embedded structure of the formCondition. "condition_name":
string, display name of the condition, same value ascondition.displayName. "severity":
string, severity level of incidents.
If this field isn't defined during alerting policy creation,
then Cloud Monitoring sets the alerting policy severity tono severity. "threshold_value":
string, the threshold value of this condition, may be empty if the condition isn't a threshold condition. }, }
Deprecation policy
The payload schema is subject to the Google Cloud deprecation policy
outlined in Section 1.4(d) of theGoogle Cloud Platform Terms of Service.
Note that the schema does not control the formats of generated field values,
and these formats can change without notice. For example,incident.summary,incident.documentation.content, andincident.urlare meant to include data pertaining to their fields, but the schema doesn't
have constraints to guarantee accurate parsing of these fields. You can
consume the value as a whole and expect that it adheres to the deprecation
policy, but don't rely on parsing the generated fields.
Configure PagerDuty to map severity levels
By default, PagerDuty notifications show all incident severity
levels as "critical". You can configure event orchestration rules in
PagerDuty so that the PagerDuty alert severity matches the
Monitoring incident severity:
In your PagerDuty account, go to theServicespage.
Select the PagerDuty service where you receive Google Cloud
notifications.
ClickSettings.
Go to theEvent Managementsection and then clickView Orchestration Rules.
ClickNew Rule.
For each Monitoring severity value that you want to
convert, create a conditional rule that maps the severity value
to an equivalent PagerDuty value:
In the menu underStep 1: When should this rule
be applied?,
selectIf events match certain conditions.
Select the code editor.
In theIfsection, enterevent.custom_details.incident.severity matches part'VALUE', whereVALUEis the name of a
Monitoring severity value, then clickNext.
UnderStep 2: What action(s) should be applied, selectAlert Data.
Set the alert severity to a value that matches the
Monitoring value that you entered in Step C,
then save your changes.
Optional: To add additional rules, clickElse rule.
SMS
To configure SMS notifications, do the following:
In the Google Cloud console, go to thenotificationsAlertingpage:
If you use the search bar to find this page, then select the result whose subheading isMonitoring.
In the toolbar of the Google Cloud console,
select your Google Cloud project. ForApp Hubconfigurations, select the App Hub host project or management project.
ClickEdit notification channels.
In theSMSsection, clickAdd new.
Complete the dialog and clickSend Verification Code.
A verification code is sent to the contact number you provided.
When you set up your alerting policy, select theSMSnotification
type and choose a verified phone number from the list.
Slack
The Monitoring Slack integration allows your alerting
policies to post to a Slack channel when a new incident is created.
To set up Slack notifications, do the following:
In Slack: Create a Slack workspace and channel at theSlack site. Record
the channel URL.
In the Google Cloud console, go to thenotificationsAlertingpage:
If you use the search bar to find this page, then select the result whose subheading isMonitoring.
In the toolbar of the Google Cloud console,
select your Google Cloud project. ForApp Hubconfigurations, select the App Hub host project or management project.
ClickEdit notification channels.
In theSlacksection, clickAdd newto open the
Slack sign-in page:
Select your Slack workspace.
ClickAllowto enable Cloud Monitoring
access to your Slack workspace. This action takes you back to the
Monitoring configuration page for your notification
channel.
In theSlack Channel Namefield, enter the name of the
Slack channel you want to use for notifications.
In theCloud Alerting Display Namefield, enter a short
descriptive statement. Monitoring displays the value
of this field on theNotifications channelpage.
(Optional) To test the connection between
Cloud Monitoring and your Slack workspace, clickSend test notification. If the connection is successful, then
you see a messageThis is a test alert notification...in the
Slack notification channel that you specified. Check the
notification channel to confirm receipt.
If the Slack channel you want to use for notifications is a
private channel, then you must manually invite the
Monitoring app to the channel:
Open Slack.
Go to the channel you specified as your
Monitoring notification channel.
Invite the Monitoring app to the channel by
entering and sending the following message in the channel:
/invite @Google Cloud Monitoring
Be sure you invite the Monitoring app to the private
channel you specified when creating the notification channel in
Monitoring. Inviting the Monitoring app
to public channels is optional.
When you create an alerting policy, selectSlackin theNotificationssection and choose your Slack configuration.
Webhooks
Before you configure a Webhook notification channel, consider the
following:
Webhooks only support public endpoints. A public endpoint is fully
accessible from the public internet, such as by HTTP (port:80) or
HTTPS (port:443). The notification service must be able to establish
a connection to the endpoint and, in the case of HTTPS, verify the
server's security certificate.
If you need notifications sent to an endpoint that isn't public, then
create a Pub/Sub notification channel and configure a
subscription to the Pub/Sub topic. For more information, seeWebhook notifications fail when configured for a private endpoint.
If a Cloud Run function is
configured as webhook endpoint for a notification channel,
then make sure the user invoking the function has the required
authentication permission. For more information, seeAuthenticate for invocationandEnabling access to a function.
To send notification data from Monitoring to Microsoft
Teams, you must use an intermediary service such as Power Automate orCloud Run functions.
Configure the service to receive the Monitoring
webhook notification, convert the data into a Teams-compatible format,
and forward the data to the appropriate Microsoft Teams channel.
Configure Webhook notification channels
To configure Webhooks notifications, do the following:
The webhook handler: Identify the public endpoint URL to receive
webhook data from Monitoring.
In the Google Cloud console, go to thenotificationsAlertingpage:
If you use the search bar to find this page, then select the result whose subheading isMonitoring.
In the toolbar of the Google Cloud console,
select your Google Cloud project. ForApp Hubconfigurations, select the App Hub host project or management project.
ClickEdit notification channels.
In theWebhooksection, clickAdd new.
Complete the dialog.
ClickTest Connectionto send a test payload to the Webhook
endpoint. You can go to the receiving endpoint to verify delivery.
ClickSave.
When you create an alerting policy, selectWebhookin theNotificationssection and choose your webhook configuration.
The notifications sent by Error Reporting follow the1.0 schemawhile notifications sent by Monitoring follow the
1.2 schema:
JSON examples
By default, the alerting backend attempts to generate a JSON packet
with version 1.2 formatting. For more information about this formatting, see
the next section.
The following is an example of such a packet:
 {
  "incident": {
    "incident_id": "0.opqiw61fsv7p",
    "renotify": true,
    "scoping_project_id": "internal-project",
    "scoping_project_number": 12345,
    "url": "https://console.cloud.google.com/monitoring/alerting/incidents/0.lxfiw61fsv7p?project=internal-project",
    "severity": "no severity",
    "started_at": 1577840461,
    "ended_at": 1577877071,
    "state": "closed",
    "resource_id": "11223344",
    "resource_name": "internal-project gke-cluster-1-default-pool-e2df4cbd-dgp3",
    "resource_display_name": "gke-cluster-1-default-pool-e2df4cbd-dgp3",
    "resource_type_display_name": "VM Instance",
    "resource": {
      "type": "gce_instance",
      "labels": {
        "instance_id": "11223344",
        "project_id": "internal-project",
        "zone": "us-central1-c"
      }
    },
    "metric": {
      "type": "compute.googleapis.com/instance/cpu/utilization",
      "displayName": "CPU utilization",
      "labels": {
        "instance_name": "the name of the VM instance"
      }
    },
    "metadata": {
      "system_labels": { "labelkey": "labelvalue" },
      "user_labels": { "labelkey": "labelvalue" }
    },
    "policy_name": "Monitor-Project-Cluster",
    "policy_user_labels" : {
        "user-label-1" : "important label",
        "user-label-2" : "another label"
    },
    "condition_name": "VM Instance - CPU utilization [MAX]",
    "threshold_value": "0.9",
    "observed_value": "0.835",
    "condition": {
      "name": "projects/internal-project/alertPolicies/1234567890123456789/conditions/1234567890123456789",
      "displayName": "VM Instance - CPU utilization [MAX]",
      "conditionThreshold": {
        "filter": "metric.type=\"compute.googleapis.com/instance/cpu/utilization\" resource.type=\"gce_instance\" metadata.system_labels.\"state\"=\"ACTIVE\"",
        "aggregations": [
          {
            "alignmentPeriod": "120s",
            "perSeriesAligner": "ALIGN_MEAN"
          }
        ],
        "comparison": "COMPARISON_GT",
        "thresholdValue": 0.9,
        "duration": "0s",
        "trigger": {
          "count": 1
        }
      }
    },
    "documentation": {
      "content": "TEST ALERT\n\npolicy.name=projects/internal-project/alertPolicies/1234567890123456789\n\npolicy.display_name=Monitored-Project-NO-GROUPBY\n\ncondition.name=projects/nternal-project/alertPolicies/1234567890123456789/conditions/1234567890123456789\n\ncondition.display_name=VM Instance - CPU utilization [MAX]\n\nproject=internal-project\n\nresrouce.project=internal-project \n\nDONE\n",
      "mime_type": "text/markdown",
      "subject": "ALERT - No severity",
      "links": [
        {
          "displayName": "Playbook",
          "url": "https://myownpersonaldomain.com/playbook?name=${resource.name}"
        }
      ]
    },
    "summary": "CPU utilization for internal-project gke-cluster-1-16-default-pool-e2df4cbd-dgp3 with metric labels {instance_name=gke-cluster-1-default-pool-e2df4cbd-dgp3} and system labels {state=ACTIVE} returned to normal with a value of 0.835."
  },
  "version": "1.2"
}
Schema structure, version 1.2
This section describes version 1.2 of the payload schema. Some
fields might not appear in all returned packets or might have empty values,
depending on the configuration of the alerting policy, the state
of the incident, or the resource being monitored. Some fields
take embedded structures as values; these structures
are described by reference because their contents can also vary.
In a returned packet, the fields can occur in any order. In the
description that follows, they are organized into related groups.
{ "version": "1.2", "incident": {
Information about the incident.
"incident_id":
string, generated ID for this incident. "renotify": bool, optional. Set totruewhen the message is a repeated notification. "scoping_project_id":
string, the project ID that hosts the metrics scope. "scoping_project_number":
number, the project number of the scoping project. "url":
string, Google Cloud console URL for this incident. "started_at":
number, time (in Unix epoch seconds) when the incident was opened. "ended_at":
number, time (in Unix epoch seconds) when the incident was closed.
Populated only whenstateisclosed. "state":
string, state of the incident:openorclosed. Ifopen, thenended_atis null. "summary":
string, generated textual summary of the incident. "apigee_url":
string,ApigeeURL for this incident, only for Apigee
resource typesEnvironmentandProxy*. "observed_value":
string, observed value that triggered/resolved the alert, may
be empty if the condition is expired.
Information about the monitored resource for which the incident was opened.
"resource": { "type":
string, identifier of the monitored resource type being alerted on, for example,gce_instance; seeList of monitored resources. "labels":
object, key-value pairs for labels associated with the monitored resource. }, "resource_type_display_name":
string, display name of the monitored resource type. "resource_id":
string, instance ID of the monitored resource, same value asresource.labels.instance_id. "resource_display_name":
string, display name of the monitored resource. "resource_name":
string, generated name of this monitored resource; consists of values from other fields.
Information about the metric type of the time-series data.
"metric": { "type":
string, identifier of the metric type being alerted on, for example,compute.googleapis.com/instance/cpu/utilization;
seeList of metrics. "displayName":
string, display name of the metric type. "labels":
object, key-value pairs for labels associated with the metric. }, "metadata": { "system_labels":
object, key-value pairs for system metadata labels. "user_labels":
object, key-value pairs for user metadata labels. },
Information about the alerting policy and condition that opened/resolved the incident. The values are drawn from the relevantAlertPolicyobject.
"policy_name":
string, display name for the alerting policy. "policy_user_labels":
object, key-value pairs for any user labels attached to the policy. "documentation":
object, an embedded structure of the formDocumentation. "condition":
object, an embedded structure of the formCondition. "condition_name":
string, display name of the condition, same value ascondition.displayName. "severity":
string, severity level of incidents.
If this field isn't defined during alerting policy creation,
then Cloud Monitoring sets the alerting policy severity tono severity. "threshold_value":
string, the threshold value of this condition, may be empty if the condition isn't a threshold condition. }, }
Basic authentication
In addition to the webhook request sent by Cloud Monitoring, basic
authentication utilizes the HTTP specification for the username and
password. Cloud Monitoring requires your server to return a 401
response with the properWWW-Authenticateheader. For more
information about basic authentication, see the following:
Token Authentication requires
a query string parameter in the endpoint URL and a key that the
server expects to be secret between itself and Monitoring.
The following is a sample URL that includes a token:
If Monitoring posts an incident to the endpoint URL,
your server can validate the attached token. This method of
authentication is most effective when used with SSL/TLS
to encrypt the HTTP request preventing snoopers from learning the token.
For an example server in Python, see thissample server.
Deprecation policy
The payload schema is subject to the Google Cloud deprecation policy
outlined in Section 1.4(d) of theGoogle Cloud Platform Terms of Service.
Note that the schema does not control the formats of generated field values,
and these formats can change without notice. For example,incident.summary,incident.documentation.content, andincident.urlare meant to include data pertaining to their fields, but the schema doesn't
have constraints to guarantee accurate parsing of these fields. You can
consume the value as a whole and expect that it adheres to the deprecation
policy, but don't rely on parsing the generated fields.
Pub/Sub
This section describes how to configure Pub/Sub notification
channels. For redundancy, we recommend that you create multiple
notification channels. Pairing Pub/Sub with Google Cloud console Mobile App,
PagerDuty, Webhooks, or Slack is recommended, because Pub/Sub
uses a different delivery mechanism.
To receive the alert notifications, you must also create one of the following subscriptions:pull,push, orBigQuery.
When the subscription is in a different project than the topic,
create a service account in the subscriber project, and grant it the
role ofroles/pubsub.subscriber.
Before you begin
When you add the first Pub/Sub notification channel to a
Google Cloud project,
Cloud Monitoring creates a service account for that project. It
also grants the Identity and Access Management roleMonitoring Notification Service Agentto the service account.
This service account lets Monitoring send notifications
to Pub/Sub-based notification channels in this project.
The name of the notifications service account includes a
unique Google Cloud projectnumber. You can find the project name, ID, and number on
the project's dashboard in the Google Cloud console, or you
can retrieve it with the following command:
You can view and edit the service account by using the
Google Cloud console or the Google Cloud CLI.
Enable required APIs and create a topic
In the Google Cloud project where you plan to create the notification channel
and Pub/Sub topic, do the following:
Sign in to your Google Cloud account. If you're new to
Google Cloud,create an accountto evaluate how our products perform in
real-world scenarios. New customers also get $300 in free credits to
run, test, and deploy workloads.
In the Google Cloud console, on the project selector page,
select or create a Google Cloud project.
Roles required to select or create a project
Select a project: Selecting a project doesn't require a specific
IAM role—you can select any project that you've been
granted a role on.
Create a project: To create a project, you need the Project Creator role
(roles/resourcemanager.projectCreator), which contains theresourcemanager.projects.createpermission.Learn how to grant
roles.
To enable APIs, you need the Service Usage Admin IAM
role (roles/serviceusage.serviceUsageAdmin), which
contains theserviceusage.services.enablepermission.Learn how to grant
roles.
Create a Pub/Sub topic. For information about how to
create a topic, seeCreate a topic.
For example, to create a topic callednotificationTopicby using the Google Cloud CLI, run the following command:
gcloud pubsub topics create notificationTopic
Next, configure your Pub/Sub notification channels.
Configure notifications for a topic
To create a Pub/Sub notification channel, you can use the
Monitoring API, the Google Cloud CLI, or the
Google Cloud console. After you create the notification
channel, authorize the notifications service account to
publish each topic that you are using as a notification channel.
For information about using the Monitoring API or the
Google Cloud CLI to create the notification channel, seeCreating channels.
To use the Google Cloud console to create the notification channel,
do the following:
In the Google Cloud console, go to thenotificationsAlertingpage:
If you use the search bar to find this page, then select the result whose subheading isMonitoring.
In the toolbar of the Google Cloud console,
select your Google Cloud project. ForApp Hubconfigurations, select the App Hub host project or management project.
Select the Google Cloud project that contains the
Pub/Sub topic you created.
ClickEdit notification channels.
In thePub/Subsection, clickAdd new.
TheCreated Pub/Sub Channeldialog displays the name of
the service account that Monitoring
created.
Authorize the service account. Your service account can publish
all topics or specific topics:
To publish all topics, selectManage roles,
and add the role ofPub/Sub Publisher.
After you complete these steps that configure the notification
channel, skip the next section, which is titledAuthorize service account, and proceed toSet the notification channel in an alerting policy.
To publish specific topics, proceed to the next step and
authorize the service account to publish specific topics after you
complete configuring the notification channel. For instructions
to authorize the service account, seeAuthorize service account.
Enter a display name for your channel and the
Pub/Sub topic name.
(Optional) To verify that the channel is correctly configured,
clickSend test notification.
SelectAdd channel.
Next, authorize the service account.
Authorize service account
Authorization lets the notifications service account
publish each Pub/Sub topic that you are using as a
notification channel. This section describes how you can do the following:
Authorize a service account for a specific topic.
Authorize a service account for all topics.
Authorize a service account for a specific topic
You can authorize a service account to publish a specific topic by
using the Google Cloud console and the Google Cloud CLI. This section describes
both approaches.
To authorize your service account for a specific topic by using
the Google Cloud console, do the following:
If you use the search bar to find this page, then select the result whose subheading isPub/Sub.
In the toolbar of the Google Cloud console,
select your Google Cloud project. ForApp Hubconfigurations, select the App Hub host project or management project.
Select the topic.
In thePermissionstab, selectAdd principal.
In theNew principalfield, enter the name of the notifications
service account. The service account has the following naming
convention:
Select the rolePub/Sub Publisher, and then selectSave.
To authorize your service account for a specific topic by using
the Google Cloud CLI, grant thepubsub.publisherIAM role for the topic to the service account.
For example, the following command configures the
IAM role for thenotificationTopictopic:
If you use the search bar to find this page, then select the result whose subheading isIAM & Admin.
In the toolbar of the Google Cloud console,
select your Google Cloud project. ForApp Hubconfigurations, select the App Hub host project or management project.
SelectInclude Google-provided role grantsas shown in
the following image:
Search for the service account that has the following format:
Reload the page when the service account isn't listed.
SelecteditEditfor the notifications service
account, selectAdd another role, and then add the rolePub/Sub Publisher.
Next, set the notification channel in an alerting policy.
Set the notification channel in an alerting policy
To use a Pub/Sub notification channel in an alerting policy,
selectPub/Subas the channel type,
and then select the topic.
Schema example
To view an example JSON packet and the schema, expand the following
sections.
JSON examples
By default, the alerting backend attempts to generate a JSON packet
with version 1.2 formatting. For more information about this formatting, see
the next section.
The following is an example of such a packet:
 {
  "incident": {
    "incident_id": "0.opqiw61fsv7p",
    "renotify": true,
    "scoping_project_id": "internal-project",
    "scoping_project_number": 12345,
    "url": "https://console.cloud.google.com/monitoring/alerting/incidents/0.lxfiw61fsv7p?project=internal-project",
    "severity": "no severity",
    "started_at": 1577840461,
    "ended_at": 1577877071,
    "state": "closed",
    "resource_id": "11223344",
    "resource_name": "internal-project gke-cluster-1-default-pool-e2df4cbd-dgp3",
    "resource_display_name": "gke-cluster-1-default-pool-e2df4cbd-dgp3",
    "resource_type_display_name": "VM Instance",
    "resource": {
      "type": "gce_instance",
      "labels": {
        "instance_id": "11223344",
        "project_id": "internal-project",
        "zone": "us-central1-c"
      }
    },
    "metric": {
      "type": "compute.googleapis.com/instance/cpu/utilization",
      "displayName": "CPU utilization",
      "labels": {
        "instance_name": "the name of the VM instance"
      }
    },
    "metadata": {
      "system_labels": { "labelkey": "labelvalue" },
      "user_labels": { "labelkey": "labelvalue" }
    },
    "policy_name": "Monitor-Project-Cluster",
    "policy_user_labels" : {
        "user-label-1" : "important label",
        "user-label-2" : "another label"
    },
    "condition_name": "VM Instance - CPU utilization [MAX]",
    "threshold_value": "0.9",
    "observed_value": "0.835",
    "condition": {
      "name": "projects/internal-project/alertPolicies/1234567890123456789/conditions/1234567890123456789",
      "displayName": "VM Instance - CPU utilization [MAX]",
      "conditionThreshold": {
        "filter": "metric.type=\"compute.googleapis.com/instance/cpu/utilization\" resource.type=\"gce_instance\" metadata.system_labels.\"state\"=\"ACTIVE\"",
        "aggregations": [
          {
            "alignmentPeriod": "120s",
            "perSeriesAligner": "ALIGN_MEAN"
          }
        ],
        "comparison": "COMPARISON_GT",
        "thresholdValue": 0.9,
        "duration": "0s",
        "trigger": {
          "count": 1
        }
      }
    },
    "documentation": {
      "content": "TEST ALERT\n\npolicy.name=projects/internal-project/alertPolicies/1234567890123456789\n\npolicy.display_name=Monitored-Project-NO-GROUPBY\n\ncondition.name=projects/nternal-project/alertPolicies/1234567890123456789/conditions/1234567890123456789\n\ncondition.display_name=VM Instance - CPU utilization [MAX]\n\nproject=internal-project\n\nresrouce.project=internal-project \n\nDONE\n",
      "mime_type": "text/markdown",
      "subject": "ALERT - No severity",
      "links": [
        {
          "displayName": "Playbook",
          "url": "https://myownpersonaldomain.com/playbook?name=${resource.name}"
        }
      ]
    },
    "summary": "CPU utilization for internal-project gke-cluster-1-16-default-pool-e2df4cbd-dgp3 with metric labels {instance_name=gke-cluster-1-default-pool-e2df4cbd-dgp3} and system labels {state=ACTIVE} returned to normal with a value of 0.835."
  },
  "version": "1.2"
}
Schema structure, version 1.2
This section describes version 1.2 of the payload schema. Some
fields might not appear in all returned packets or might have empty values,
depending on the configuration of the alerting policy, the state
of the incident, or the resource being monitored. Some fields
take embedded structures as values; these structures
are described by reference because their contents can also vary.
In a returned packet, the fields can occur in any order. In the
description that follows, they are organized into related groups.
{ "version": "1.2", "incident": {
Information about the incident.
"incident_id":
string, generated ID for this incident. "renotify": bool, optional. Set totruewhen the message is a repeated notification. "scoping_project_id":
string, the project ID that hosts the metrics scope. "scoping_project_number":
number, the project number of the scoping project. "url":
string, Google Cloud console URL for this incident. "started_at":
number, time (in Unix epoch seconds) when the incident was opened. "ended_at":
number, time (in Unix epoch seconds) when the incident was closed.
Populated only whenstateisclosed. "state":
string, state of the incident:openorclosed. Ifopen, thenended_atis null. "summary":
string, generated textual summary of the incident. "apigee_url":
string,ApigeeURL for this incident, only for Apigee
resource typesEnvironmentandProxy*. "observed_value":
string, observed value that triggered/resolved the alert, may
be empty if the condition is expired.
Information about the monitored resource for which the incident was opened.
"resource": { "type":
string, identifier of the monitored resource type being alerted on, for example,gce_instance; seeList of monitored resources. "labels":
object, key-value pairs for labels associated with the monitored resource. }, "resource_type_display_name":
string, display name of the monitored resource type. "resource_id":
string, instance ID of the monitored resource, same value asresource.labels.instance_id. "resource_display_name":
string, display name of the monitored resource. "resource_name":
string, generated name of this monitored resource; consists of values from other fields.
Information about the metric type of the time-series data.
"metric": { "type":
string, identifier of the metric type being alerted on, for example,compute.googleapis.com/instance/cpu/utilization;
seeList of metrics. "displayName":
string, display name of the metric type. "labels":
object, key-value pairs for labels associated with the metric. }, "metadata": { "system_labels":
object, key-value pairs for system metadata labels. "user_labels":
object, key-value pairs for user metadata labels. },
Information about the alerting policy and condition that opened/resolved the incident. The values are drawn from the relevantAlertPolicyobject.
"policy_name":
string, display name for the alerting policy. "policy_user_labels":
object, key-value pairs for any user labels attached to the policy. "documentation":
object, an embedded structure of the formDocumentation. "condition":
object, an embedded structure of the formCondition. "condition_name":
string, display name of the condition, same value ascondition.displayName. "severity":
string, severity level of incidents.
If this field isn't defined during alerting policy creation,
then Cloud Monitoring sets the alerting policy severity tono severity. "threshold_value":
string, the threshold value of this condition, may be empty if the condition isn't a threshold condition. }, }
Deprecation policy
The payload schema is subject to the Google Cloud deprecation policy
outlined in Section 1.4(d) of theGoogle Cloud Platform Terms of Service.
Note that the schema does not control the formats of generated field values,
and these formats can change without notice. For example,incident.summary,incident.documentation.content, andincident.urlare meant to include data pertaining to their fields, but the schema doesn't
have constraints to guarantee accurate parsing of these fields. You can
consume the value as a whole and expect that it adheres to the deprecation
policy, but don't rely on parsing the generated fields.
Google Chat
Preview
This product or feature is
subject to the "Pre-GA Offerings Terms" in the General Service Terms section
of theService Specific
Terms.
Pre-GA products and features are available "as is" and might have limited support.
For more information, see thelaunch stage descriptions.
The Google Cloud Monitoring app allows your Google Chat spaces to
receive notifications.
Before you begin
If you are in an organization, then to install the
Google Cloud Monitoring app, you must have access to the
Google Cloud Monitoring app. If you don't have access, then
request that a Google Workspace administrator do the following:
You must use the following procedure to install the
Google Cloud Monitoring app. Installation from theGoogle Workspace Marketplace listingisn't supported.
To install the app and configure a space as a
notification channel, do the following:
In Google Chat, open or create the space where you want to
receive notifications.
Install the Google Cloud Monitoring app:
Select your space name and then selectApps and Integrations.
If the Google Cloud Monitoring app doesn't appear in the Apps list,
then return to your space, enter@Google Cloud Monitoring, and then
pressEnter.
ClickAdd to space.
Copy the chat space ID to your clipboard.
If you installed the Google Cloud Monitoring app, then the chat space
ID is included in the installation confirmation. Otherwise, you
can find the chat space ID as the series of numbers and letters
followingspace/at the end of your chat space URL.
Open a new browser tab and then configure the notification channel:
In the Google Cloud console, go to thenotificationsAlertingpage:
If you use the search bar to find this page, then select the result whose subheading isMonitoring.
In the toolbar of the Google Cloud console,
select your Google Cloud project. ForApp Hubconfigurations, select the App Hub host project or management project.
ClickEdit notification channels.
Go to theGoogle Chatsection and clickAdd New.
Enter your chat space ID in theChat Space IDfield and then clickSave.
Create a channel on demand
When adding a notification channel to an alerting policy, you must select
a channel from a list. To update the list of options when you are
creating an alerting policy, use the following process:
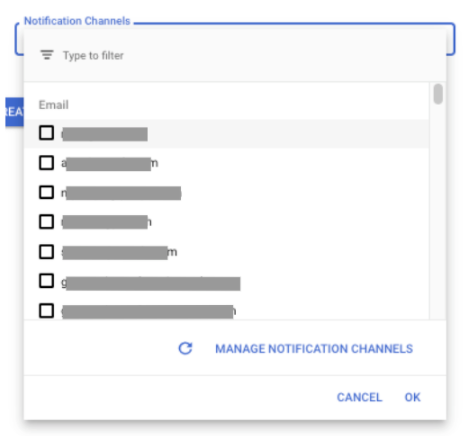
In the notification dialog, clickManage Notification Channels.
You're taken to theNotification channelswindow in a new
browser tab.
To add a new notification channel, locate the channel type, clickAdd new, and then follow the channel-specific instructions contained
in the previous table.
Return to the original tab, and in the notification dialog, clickrefreshRefresh.
Select the notification channel from the updated list.
Cloud Monitoring doesn't support a test option for notification channels.
However, you can verify that a notification channel is properly configured by
creating an alerting policy and configuring the condition to be met.
To manually test your notification channels, you could
create an alerting policy that monitors
the CPU utilization of one of your virtual machine (VM) instances:
Optional: If you don't have a VM in your Google Cloud project yet or want
to use a different VM for testing, then create a VM:
In the Google Cloud console, go to theVM instancespage:
If you use the search bar to find this page, then select the result whose subheading isCompute Engine.
In the toolbar of the Google Cloud console,
select your Google Cloud project. ForApp Hubconfigurations, select the App Hub host project or management project.
If you use the search bar to find this page, then select the result whose subheading isMonitoring.
In the toolbar of the Google Cloud console,
select your Google Cloud project. ForApp Hubconfigurations, select the App Hub host project or management project.
SelectCreate policy.
Use theSelect a metricmenu to select theCPU Utilizationmetric
for a VM instance.
Select a value that is larger than the CPU utilization for your
instance. For example, if the chart displays the CPU utilization to
be about 5%, then set the threshold to 10%.
These settings configure the condition to be met when the CPU utilization
of a VM instance is less than the specified threshold. Because you
selected the threshold to be larger than the CPU utilization of your
VM instance, the condition of the alerting policy is met.
Add the notification channels to your policy.
ExpandIncident autoclose durationand select30 min.
Enter a policy name and clickCreate policy.
After the condition is met, verify that you received a notification on
each notification channel.
Delete the alerting policy. The incident is closed automatically after
the autoclose duration expires.
If you created a VM instance for this test, then delete it.
If you aren't receiving expected notifications, then you can
search the Logs Explorer for log entries with information about the missing
notifications. For more information, seeNotifications aren't received.
Edit and delete notification channels
To edit or delete a notification channel by using the Google Cloud console,
do the following:
In the Google Cloud console, go to thenotificationsAlertingpage:
If you use the search bar to find this page, then select the result whose subheading isLogging.
In the toolbar of the Google Cloud console,
select your Google Cloud project. ForApp Hubconfigurations, select the App Hub host project or management project.
Enter and run your query. For queries specific to
notification channel errors, seeCloud Monitoring queries.
What's next
For information about incidents, see the following documents:
[[["Easy to understand","easyToUnderstand","thumb-up"],["Solved my problem","solvedMyProblem","thumb-up"],["Other","otherUp","thumb-up"]],[["Hard to understand","hardToUnderstand","thumb-down"],["Incorrect information or sample code","incorrectInformationOrSampleCode","thumb-down"],["Missing the information/samples I need","missingTheInformationSamplesINeed","thumb-down"],["Other","otherDown","thumb-down"]],["Last updated 2025-12-15 UTC."],[],[]]