
This document shows how to configure logging and monitoring for system components in Google Distributed Cloud.
By default, Cloud Logging, Cloud Monitoring, and Google Cloud Managed Service for Prometheus are enabled.
For more information about the options, see Logging and monitoring overview .
Monitored resources
Monitored resources are how Google represents resources such as clusters, nodes, Pods, and containers. To learn more, refer to Cloud Monitoring's Monitored resource types documentation.
To query for logs and metrics, you'll need to know at least these resource labels:
-
project_id: Project ID of the cluster's logging-monitoring project . You provided this value in thestackdriver.projectIDfield of your cluster configuration file. -
location: A Google Cloud region where you want to store Cloud Logging logs and Cloud Monitoring metrics. It's a good idea to choose a region that is near your on-premises data center. You provided this value during installation in thestackdriver.clusterLocationfield of your cluster configuration file. -
cluster_name: Cluster name that you chose when you created the cluster.You can retrieve the
cluster_namevalue for either the admin or the user cluster by inspecting the Stackdriver custom resource:kubectl get stackdriver stackdriver --namespace kube-system \ --kubeconfig CLUSTER_KUBECONFIG --output yaml | grep 'clusterName:'
where
-
CLUSTER_KUBECONFIGis the path to the admin cluster's or user cluster's kubeconfig file for which the cluster name is required.
-
Using Cloud Logging
You don't have to take any action to enable Cloud Logging for a cluster.
However, you must specify the Google Cloud project where you want to view logs. In
the cluster configuration file, you specify the Google Cloud project in
the stackdriver
section.
You can access logs using the Logs Explorer in the Google Cloud console. For example, to access a container's logs:
- Open the Logs Explorer in Google Cloud console for your project.
- Find logs for a container by:
- Clicking on the top-left log catalog drop-down box and selecting Kubernetes Container.
- Selecting the cluster name, then the namespace, and then a container from the hierarchy.
Viewing logs for controllers in bootstrap cluster
-
Find onprem-admin-cluster-controller / clusterapi-controllers pod name
By default, the kind cluster name is
gkectl-bootstrap-cluster." ADMIN_CLUSTER_NAME " resource.type="k8s_container" resource.labels.cluster_name="gkectl-bootstrap-cluster"
-
Modify the query using the pod name you find, and get the log
resource.type="k8s_container"
resource.labels.cluster_name="gkectl-bootstrap-cluster"
resource.labels.pod_name=" POD_NAME
"
Using Cloud Monitoring
You don't have to take any action to enable Cloud Monitoring for a cluster.
However, you must specify the Google Cloud project where you want to view metrics.
In the cluster configuration file, you specify the Google Cloud project in
the stackdriver
section.
You can choose from over 1,500 metrics by using Metrics Explorer. To access Metrics Explorer, do the following:
-
In the Google Cloud console, select Monitoring, or use the following button:
-
Select Resources> Metrics Explorer.
You can also view metrics in dashboards in the Google Cloud console. For information about creating dashboards and viewing metrics, see Creating dashboards .
Viewing fleet-level monitoring data
For an overall view of your fleet's resource utilization using Cloud Monitoring data, including your Google Distributed Cloud, you can use the GKE Enterprise overview in the Google Cloud console. See Use the GKE Enterprise overview to find out more.
Default Cloud Monitoring quota limits
Google Distributed Cloud monitoring has a default limit of 6000 API calls per minute for each project. If you exceed this limit, your metrics may not be displayed. If you need a higher monitoring limit, request a quota adjustment .
Using Managed Service for Prometheus
Google Cloud Managed Service for Prometheus is part of Cloud Monitoring and is available by default. The benefits of Managed Service for Prometheus include the following:
-
You can continue to use your existing Prometheus based monitoring without altering your alerts and Grafana dashboards.
-
If you use both GKE and Google Distributed Cloud, you can use the same PromQL for metrics on all your clusters. You can also use the PROMQLtab in Metrics Explorer in the Google Cloud console.
Enabling and disabling Managed Service for Prometheus
Managed Service for Prometheus is enabled by default in Google Distributed Cloud.
To disable Managed Service for Prometheus in a cluster:
-
Open the Stackdriver object named
stackdriverfor editing:kubectl --kubeconfig CLUSTER_KUBECONFIG --namespace kube-system \ edit stackdriver stackdriver
-
Add the
enableGMPForSystemMetricsfeature gate, and set it tofalse:apiVersion: addons.gke.io/v1alpha1 kind: Stackdriver metadata: name: stackdriver namespace: kube-system spec: featureGates: enableGMPForSystemMetrics: false -
Close your editing session.
Viewing metric data
When Managed Service for Prometheus is enabled, metrics for the following components have a different format for how they are stored and queried in Cloud Monitoring:
- kube-apiserver
- kube-scheduler
- kube-controller-manager
- kubelet and cadvisor
- kube-state-metrics
- node-exporter
In the new format, you can query the preceding metrics by using either PromQL or Monitoring Query Language (MQL) .
PromQL example:
histogram_quantile(0.95, sum(rate(apiserver_request_duration_seconds_bucket[5m])) by (le))
To use MQL, set the monitored resource to prometheus_target
, and add the
Prometheus type as a suffix to the metric.
MQL example:
fetch prometheus_target
| metric 'kubernetes.io/anthos/apiserver_request_duration_seconds/histogram'
| align delta(5m)
| every 5m
| group_by [], [value_histogram_percentile: percentile(value.histogram, 95)]
Configuring Grafana dashboards with Managed Service for Prometheus
To use Grafana with metrics data from Managed Service for Prometheus, follow the steps in Query using Grafana to authenticate and configure a Grafana data source to query data from Managed Service for Prometheus.
A set of sample Grafana dashboards are provided in the anthos-samples repository on GitHub. To install the sample dashboards, do the following:
-
Download the sample
.jsonfiles:git clone https://github.com/GoogleCloudPlatform/anthos-samples.git cd anthos-samples/gmp-grafana-dashboards
-
If your Grafana data source was created with a name different with
Managed Service for Prometheus, change thedatasourcefield in all the.jsonfiles:sed -i "s/Managed Service for Prometheus/ [DATASOURCE_NAME] /g" ./*.json
Replace [DATASOURCE_NAME] with the name of the data source in your Grafana that was pointed to the Prometheus
frontendservice. -
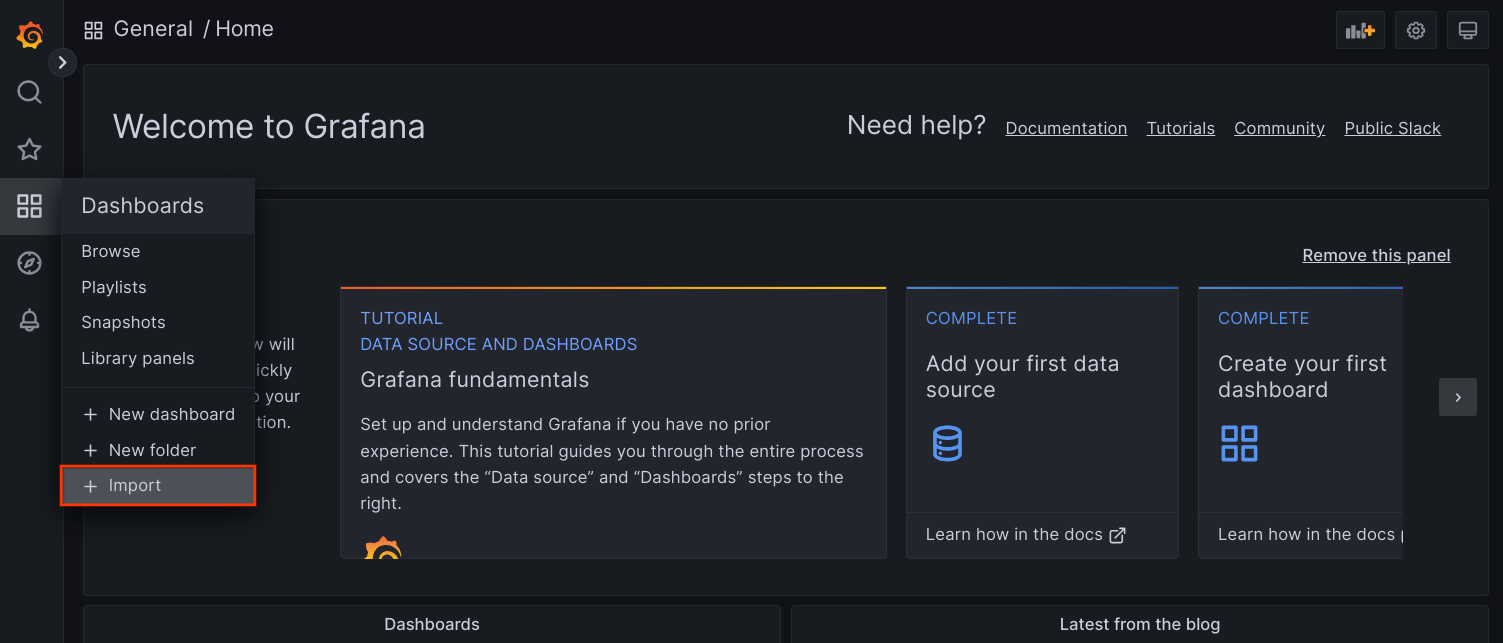
Access Grafana UI from your browser, and select + Importunder the Dashboardsmenu.
-
Either upload the
.jsonfile, or copy and paste the file content and select Load. Once the file content is successfully loaded, select Import. Optionally you can also change the dashboard name and UID before importing.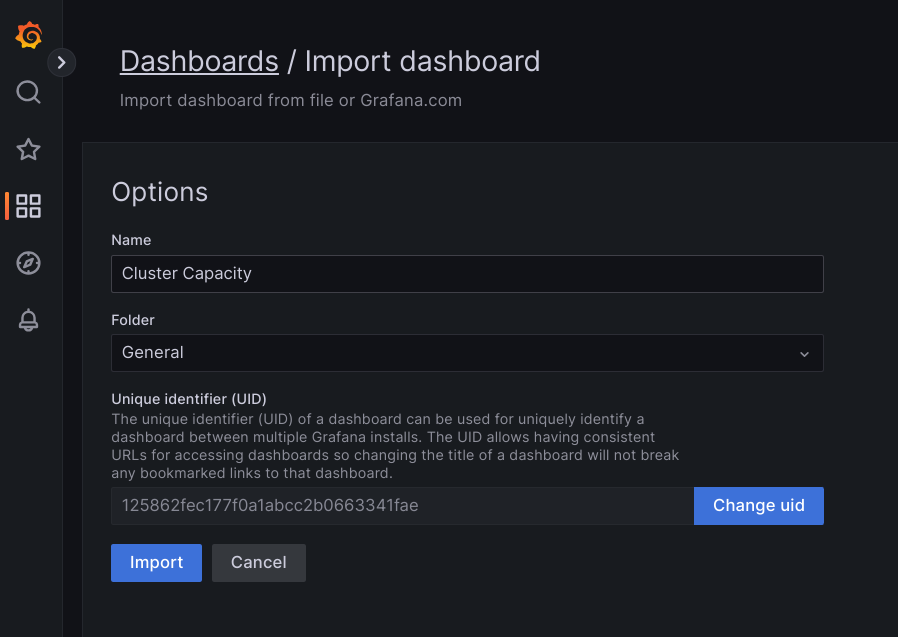
-
The imported dashboard should load successfully if your Google Distributed Cloud and the data source are configured correctly. For example, the following screenshot shows the dashboard configured by
cluster-capacity.json.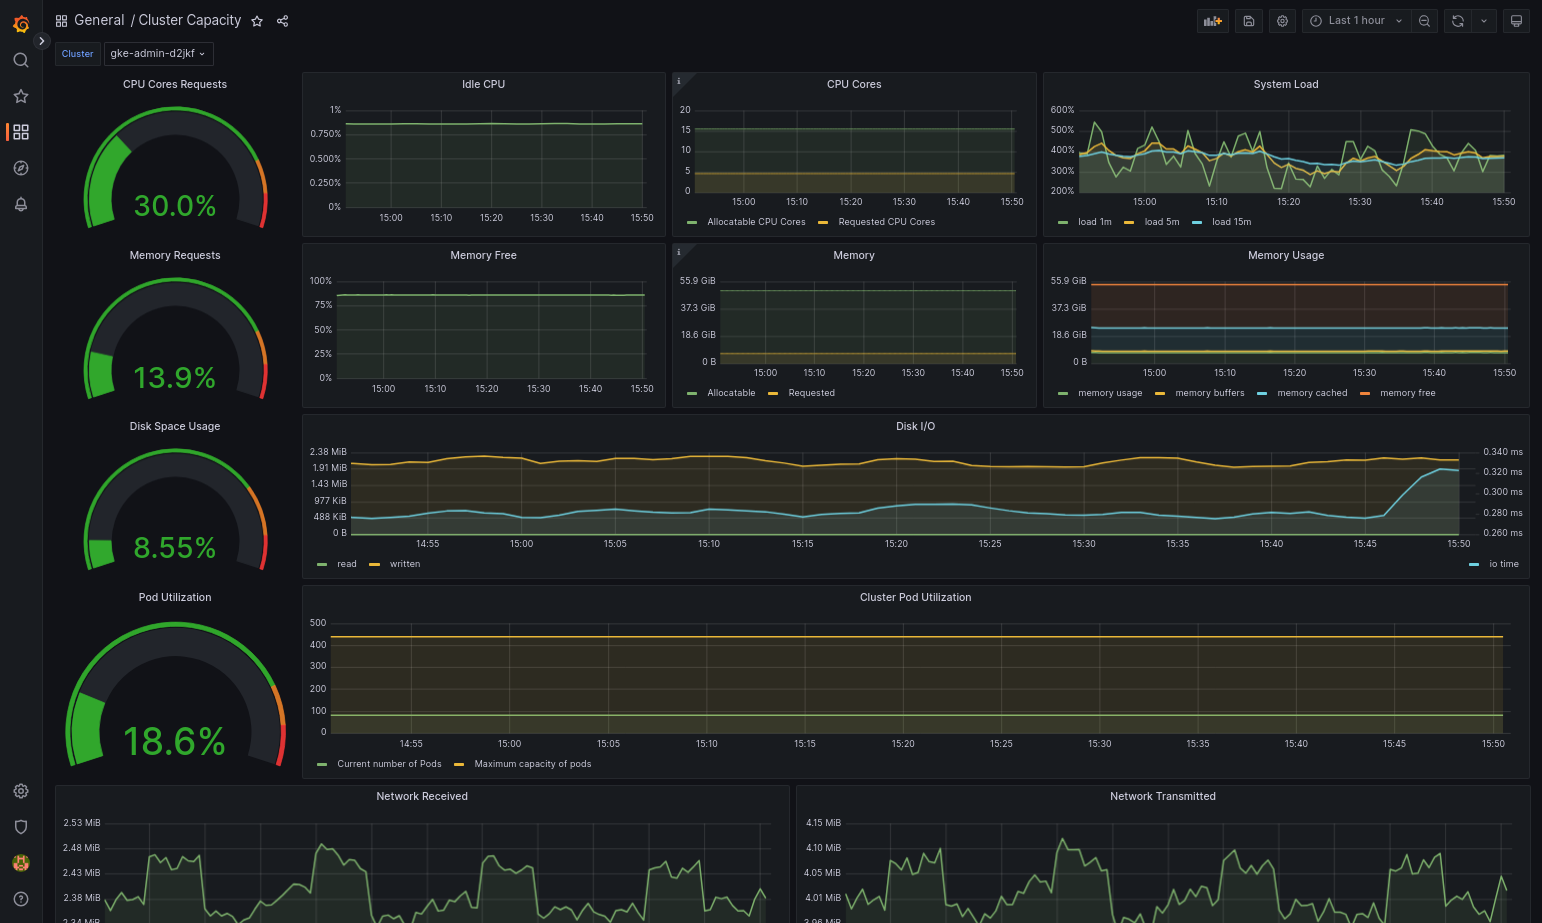
Additional resources
For more information about Managed Service for Prometheus, see the following:
Using Prometheus and Grafana
Starting in version 1.16, Prometheus and Grafana are not available in newly created clusters. We recommend that you use Managed Service for Prometheus as a replacement for in-cluster monitoring.
If you upgrade a 1.15 cluster that has Prometheus and Grafana enabled to 1.16, Prometheus and Grafana will continue to work as is, but they will not be updated or given security patches.
If you want to delete all the Prometheus and Grafana resources after upgrading to 1.16, run the following command:
kubectl --kubeconfig KUBECONFIG
delete -n kube-system \
    statefulsets,services,configmaps,secrets,serviceaccounts,clusterroles,clusterrolebindings,certificates,deployments \
    -l addons.gke.io/legacy-pg=true
As an alternative to using the Prometheus and Grafana components included in earlier versions of Google Distributed Cloud, you can switch to an open source community version of Prometheus and Grafana .
Known issue
In user clusters, Prometheus and Grafana get automatically disabled during upgrade. However, the configuration and metrics data are not lost.
To work around this issue, after the upgrade, open monitoring-sample
for
editing and set enablePrometheus
to true
.
Accessing monitoring metrics from Grafana dashboards
Grafana displays metrics gathered from your clusters. To view these metrics, you need to access Grafana's dashboards:
-
Get the name of the Grafana Pod running in a user cluster's
kube-systemnamespace:kubectl --kubeconfig [USER_CLUSTER_KUBECONFIG] -n kube-system get pods
where [USER_CLUSTER_KUBECONFIG] is the user cluster's kubeconfig file.
-
The Grafana Pod has an HTTP server listening on TCP localhost port 3000. Forward a local port to port 3000 in the Pod, so that you can view Grafana's dashboards from a web browser.
For example, suppose the name of the Pod is
grafana-0. To forward port 50000 to port 3000 in the Pod, enter this command::kubectl --kubeconfig [USER_CLUSTER_KUBECONFIG] -n kube-system port-forward grafana-0 50000:3000
-
From a web browser, navigate to
http://localhost:50000. -
On the login page, enter
adminfor username and password. -
If login is successful, you will see a prompt to change the password. After you have changed the default password, the user cluster's Grafana Home Dashboard should load.
-
To access other dashboards, click the Homedrop-down menu in the top-left corner of the page.
For an example of using Grafana, see Create a Grafana dashboard .
Accessing alerts
Prometheus Alertmanager collects alerts from the Prometheus server. You can view these alerts in a Grafana dashboard. To view the alerts, you need to access the dashboard:
-
The container in the
alertmanager-0Pod listens on TCP port 9093. Forward a local port to port 9093 in the Pod:kubectl --kubeconfig [USER_CLUSTER_KUBECONFIG] port-forward \ -n kube-system alertmanager-0 50001:9093
-
From a web browser, navigate to
http://localhost:50001.
Changing Prometheus Alertmanager configuration
You can change Prometheus Alertmanager's default configuration by editing your
user cluster's monitoring.yaml
file. You should do this if you want to direct
alerts to a specific destination, rather than keep them in the dashboard. You
can learn how to configure Alertmanager in Prometheus' Configuration
documentation.
To change the Alertmanager configuration, perform the following steps:
-
Make a copy of the user cluster's
monitoring.yamlmanifest file:kubectl --kubeconfig [USER_CLUSTER_KUBECONFIG] -n kube-system \ get monitoring monitoring-sample -o yaml > monitoring.yaml
-
To configure Alertmanager, make changes to the fields under
spec.alertmanager.yml. When you're finished, save the changed manifest. -
Apply the manifest to your cluster:
kubectl apply --kubeconfig [USER_CLUSTER_KUBECONIFG]
-f monitoring.yaml
Create a Grafana dashboard
You've deployed an application that exposes a metric, verified that the metric is exposed, and verified that Prometheus scrapes the metric. Now you can add the application-level metric to a custom Grafana dashboard.
To create a Grafana dashboard, perform the following steps:
- If necessary, gain access to Grafana .
- From the Home Dashboard, click the Homedrop-down menu in the top-left corner of the page.
- From the right-side menu, click New dashboard.
- From the New panelsection, click Graph. An empty graph dashboard appears.
- Click Panel title, then click Edit. The bottom Graphpanel opens to the Metricstab.
- From the Data Sourcedrop-down menu, select user. Click Add
query, and enter
fooin the searchfield. - Click the Back to dashboardbutton in the top-right corner of the screen. Your dashboard is displayed.
- To save the dashboard, click Save dashboardin the top-right corner of the screen. Choose a name for the dashboard, then click Save.
Disabling Prometheus and Grafana
Starting from version 1.16, Prometheus and Grafana are no longer controlled by
the enablePrometheus
field in the monitoring-sample
object.
See Using Prometheus and Grafana
for details.
Example: Adding application-level metrics to a Grafana dashboard
The following sections walk you through adding metrics for an application. In this section, you complete the following tasks:
- Deploy an example application that exposes a metric called
foo. - Verify that Prometheus exposes and scrapes the metric.
- Create a custom Grafana dashboard.
Deploy the example application
The example application runs in a single Pod. The Pod's container exposes a
metric, foo
, with a constant value of 40
.
Create the following Pod manifest, pro-pod.yaml
:
apiVersion: v1
kind: Pod
metadata:
  name: prometheus-example
  annotations:
    prometheus.io/scrape: 'true'
    prometheus.io/port: '8080'
    prometheus.io/path: '/metrics'
spec:
  containers:
  - image: registry.k8s.io/prometheus-dummy-exporter:v0.1.0
    name: prometheus-example
    command:
    - /bin/sh
    - -c
    - ./prometheus_dummy_exporter --metric-name=foo --metric-value=40 --port=8080
Then apply the Pod manifest to your user cluster:
kubectl --kubeconfig [USER_CLUSTER_KUBECONFIG]
apply -f pro-pod.yaml
Verify that the metric is exposed and scraped
-
The container in the
prometheus-examplepod listens on TCP port 8080. Forward a local port to port 8080 in the Pod:kubectl --kubeconfig [USER_CLUSTER_KUBECONFIG] port-forward prometheus-example 50002:8080
-
To verify that the application exposes the metric, run the following command:
 curl
localhost:50002/metrics
 |

grep
foo
The command returns the following output:
# HELP foo Custom metric
# TYPE foo gauge
foo 40
-
The container in the
prometheus-0Pod listens on TCP port 9090. Forward a local port to port 9090 in the Pod:kubectl --kubeconfig [USER_CLUSTER_KUBECONFIG] port-forward prometheus-0 50003:9090
-
To verify that Prometheus is scraping the metric, navigate to http://localhost:50003/targets, which should take you to the
prometheus-0Pod under theprometheus-io-podstarget group. -
To view metrics in Prometheus, navigate to http://localhost:50003/graph. From the searchfield, enter
foo, then click Execute. The page should display the metric.
Configuring the Stackdriver custom resource
When you create a cluster, Google Distributed Cloud automatically creates a Stackdriver custom resource. You can edit the spec in the custom resource to override the default values for CPU and memory requests and limits for a Stackdriver component, and you can separately override the default storage size and storage class.
Override default values for requests and limits for CPU and memory
To override these defaults, do the following:
-
Open your Stackdriver custom resource in a command line editor:
kubectl --kubeconfig= KUBECONFIG
-n kube-system edit stackdriver stackdriver
where KUBECONFIG is the path to your kubeconfig file for the cluster. This can be either an admin cluster or user cluster.
-
In the Stackdriver custom resource, add the
resourceAttrOverridefield under thespecsection:resourceAttrOverride: POD_NAME_WITHOUT_RANDOM_SUFFIX / CONTAINER_NAME : LIMITS_OR_REQUESTS : RESOURCE : RESOURCE_QUANTITY
Note that the
resourceAttrOverridefield overrides all existing default limits and requests for the component you specify. The following components are supported byresourceAttrOverride:- gke-metrics-agent/gke-metrics-agent
- stackdriver-log-forwarder/stackdriver-log-forwarder
- stackdriver-metadata-agent-cluster-level/metadata-agent
- node-exporter/node-exporter
- kube-state-metrics/kube-state-metrics
An example file looks like the following
apiVersion: addons.gke.io/v1alpha1
    kind: Stackdriver
    metadata:
      name: stackdriver
      namespace: kube-system
    spec:
      projectID: my-project
      clusterName: my-cluster
      clusterLocation: us-west-1a
      resourceAttrOverride:
        gke-metrics-agent/gke-metrics-agent:
          requests:
            cpu: 110m
            memory: 240Mi
          limits:
            cpu: 200m
            memory: 4.5Gi