
This document gives an overview of the debugging process to understand the usage of APIs and Servicesin the Google Cloud console and also their latency spike.
First, follow these steps to identify conversation IDs with high latency:
- Open Google Cloud console and go to the APIs & Services.
- Click Enabled APIs and Services.
- Go to Metricsand select the API methodunder Methods.
The latency traffic graph appears, labeled Traffic by API method.

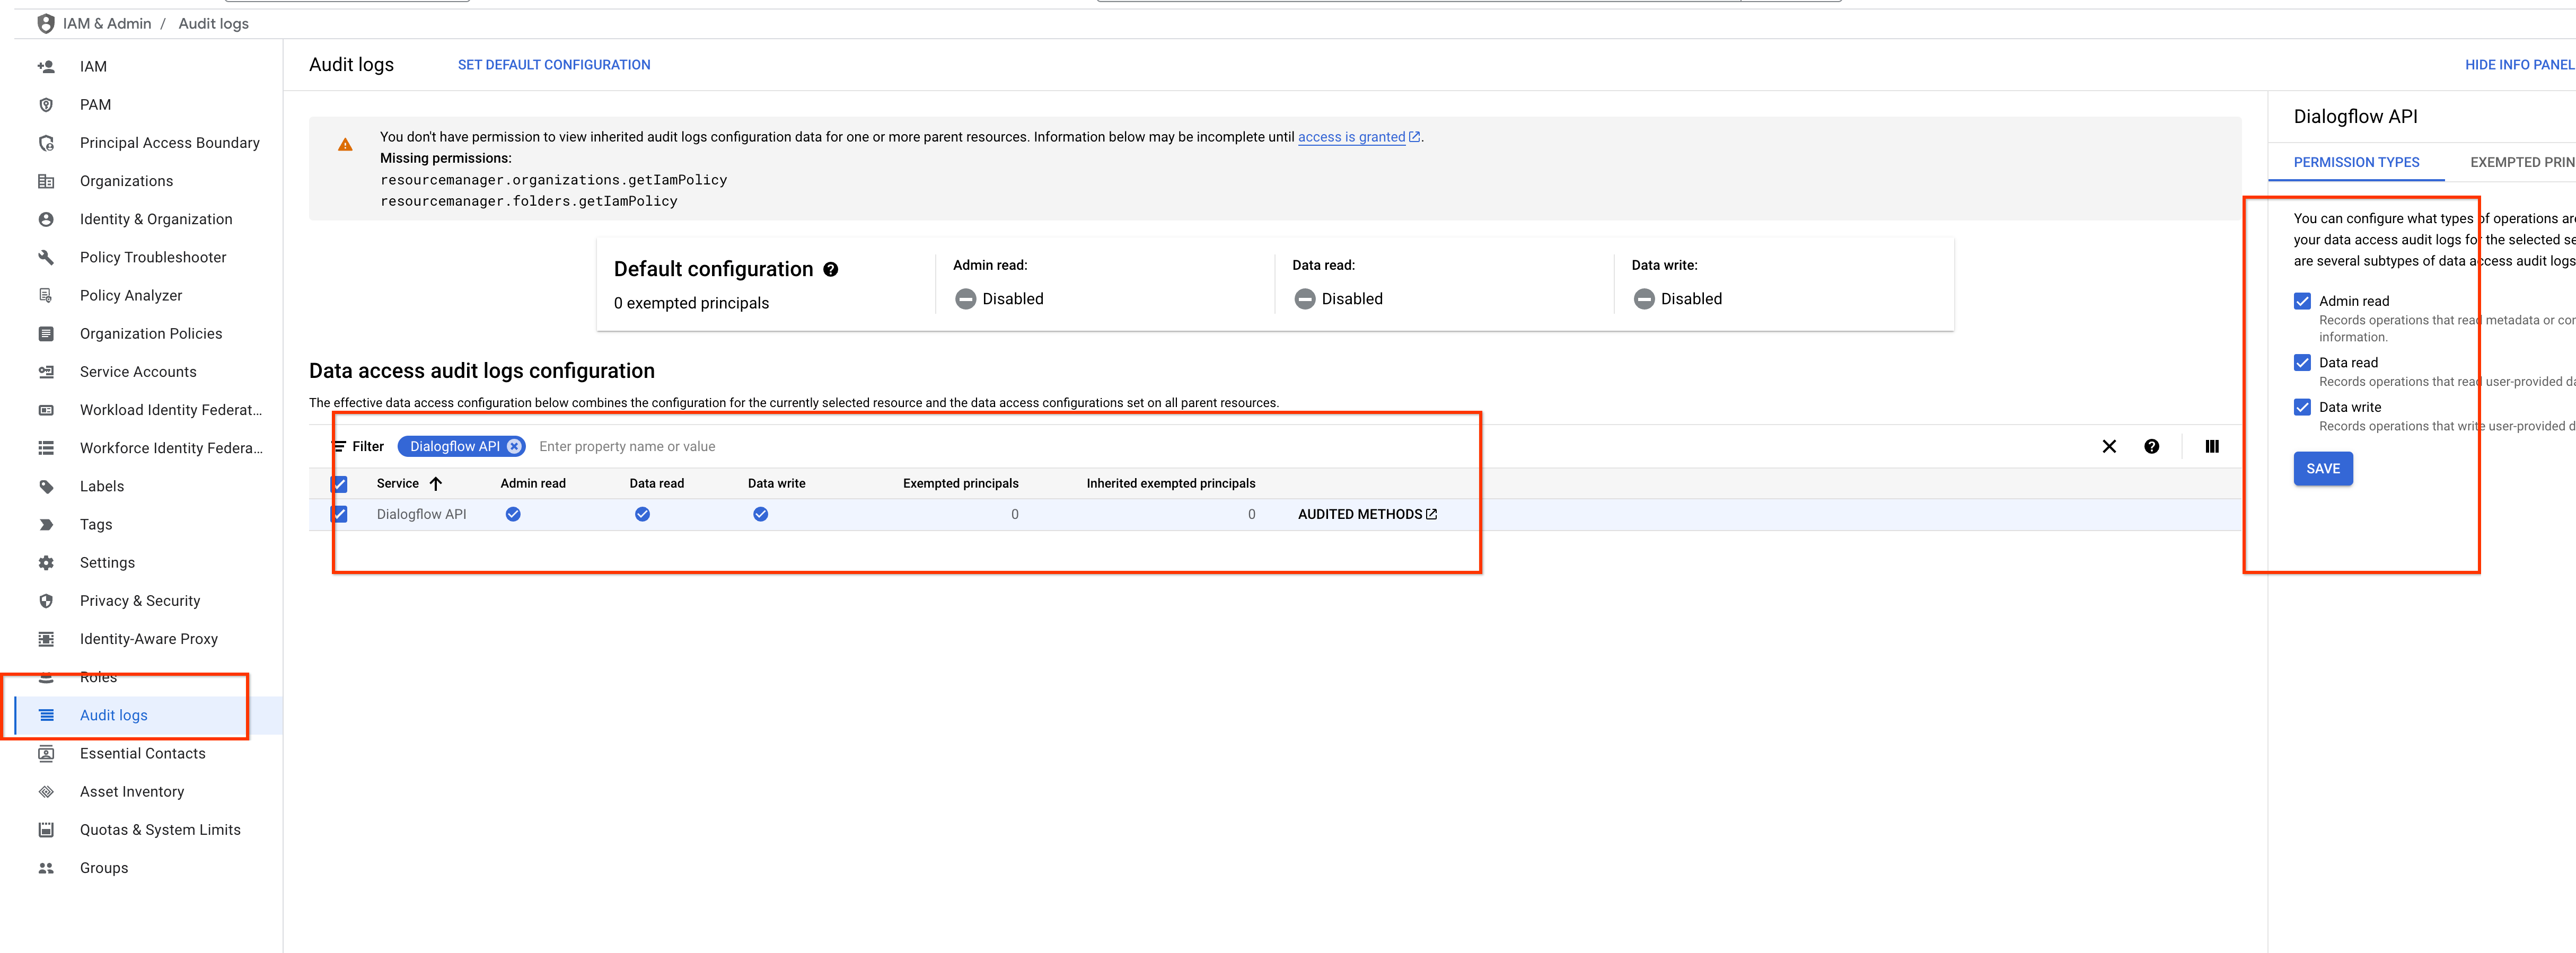
Next, ensure that you enable audit logging.
- Go to Audit Logs.
- Check the options Admin Read, Data Readand Data Write.
- Click Save.
Next, identify the conversation IDs with latency longer than a certain value in Log analytics
. For example, in the following screenshot, you can see conversations longer than 10 seconds on a particular day.
- Go to Log analytics.
- Provide the time against TIMESTAMP_DIFF.

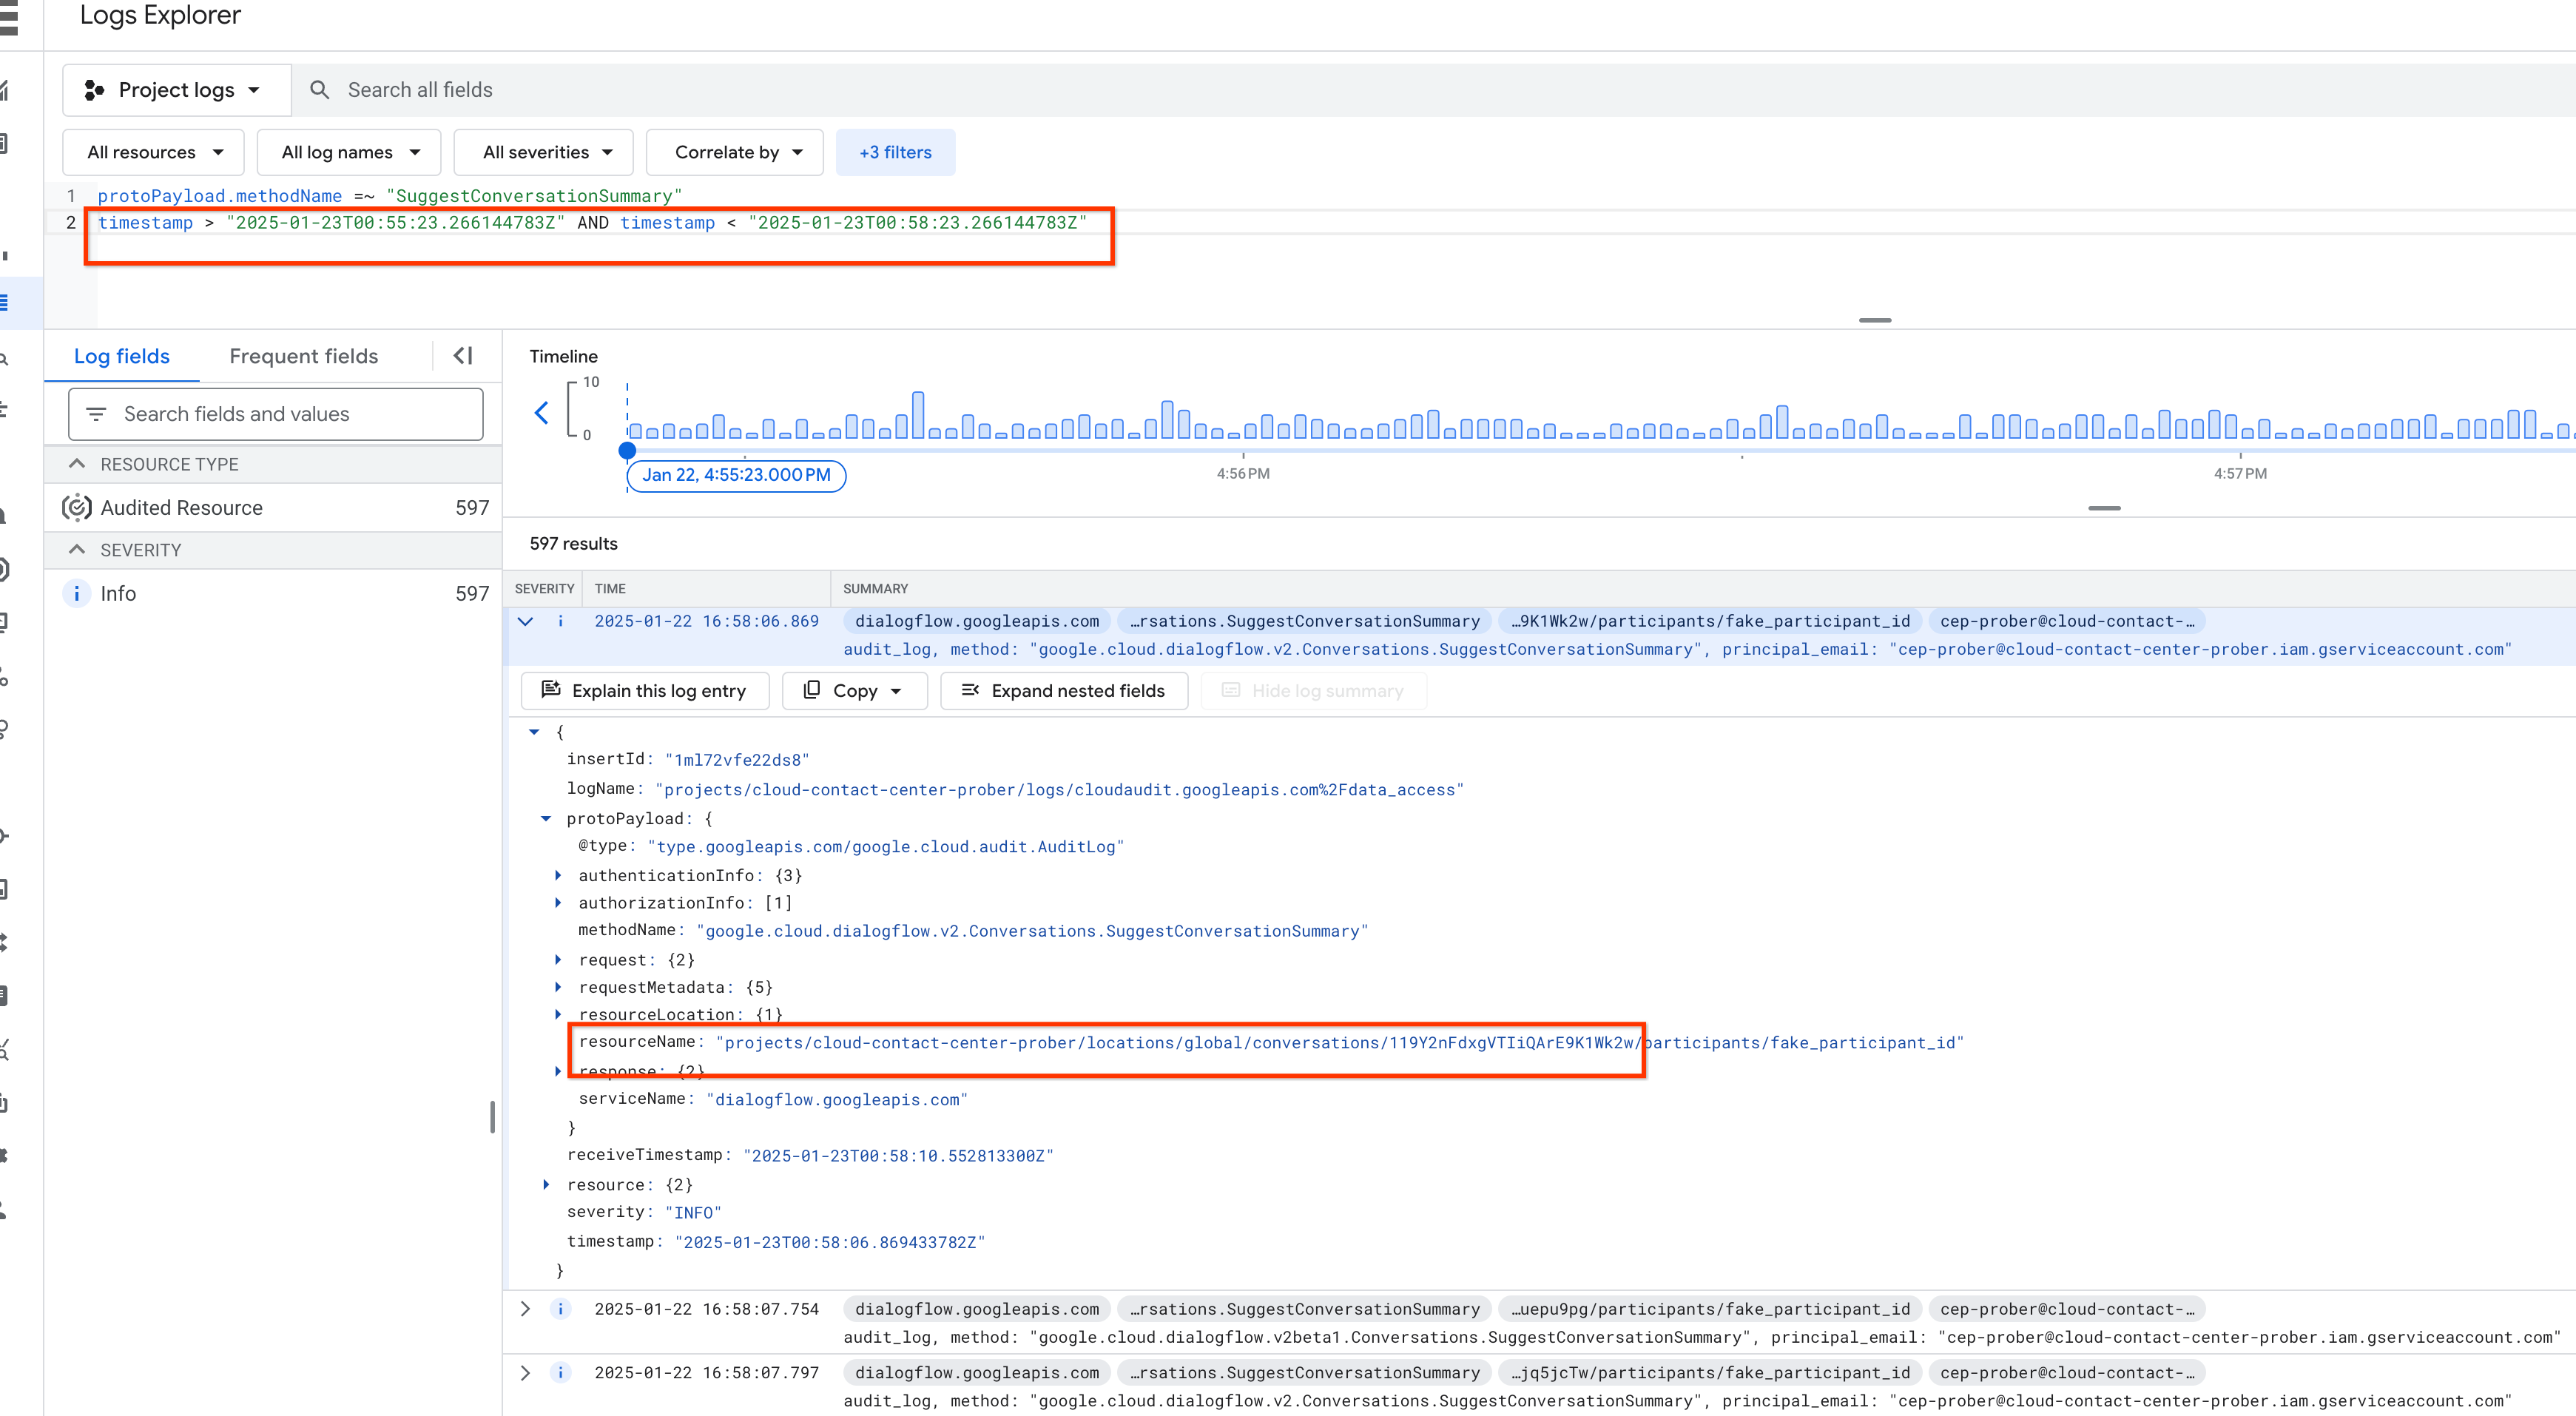
Alternatively, use the timestamp to identify specific conversations during a certain period in Log explorer
.
- Enter the name of the method in protoPayload.methodName.
- Enter the time range in Timestamp.
- View the results in Log fields.
You can access any Agent Assist APIs with Cloud Logging enabled by following all of the preceding steps.