Using logging and monitoringStay organized with collectionsSave and categorize content based on your preferences.
This page explains how to use Cloud Logging and Cloud Monitoring as well
as Prometheus and Grafana for logging and monitoring of your Google Distributed Cloud implementation. For a summary of the
configuration options available, seeLogging and monitoring overview.
Using Cloud Logging and Cloud Monitoring
The following sections explain how to use Cloud Logging and
Cloud Monitoring with Google Distributed Cloud clusters.
Monitored resources
Monitored resources are how Google represents resources such as clusters,
nodes, Pods, and containers. To learn more, refer to Cloud Monitoring'sMonitored resource typesdocumentation.
To query for logs and metrics, you'll need to know at least these resource
labels:
project_id:Project IDfor the ID of the cluster'slogging-monitoring project.
You provided this value in thestackdriver.projectIDfield of your cluster configuration file.
location: A Google Cloud region where you want to store
Cloud Logging logs and Cloud Monitoring metrics. It's a good
idea to choose a region that is near your on-premises data center. You provided this
value during installation in thestackdriver.clusterLocationfield of your cluster configuration file.
cluster_name: Cluster name that you chose when you created the cluster.
You can retrieve thecluster_namevalue for either the admin or the user
cluster by inspecting the Stackdriver custom resource:
You can access logs using theLogs Explorerin Google Cloud console. For example, to access a container's logs:
Open theLogs Explorerin Google Cloud console for your project.
Find logs for a container by:
Clicking on the top-left log catalog drop-down box and
selectingKubernetes Container.
Selecting the cluster name, then the namespace, and then a container
from the hierarchy.
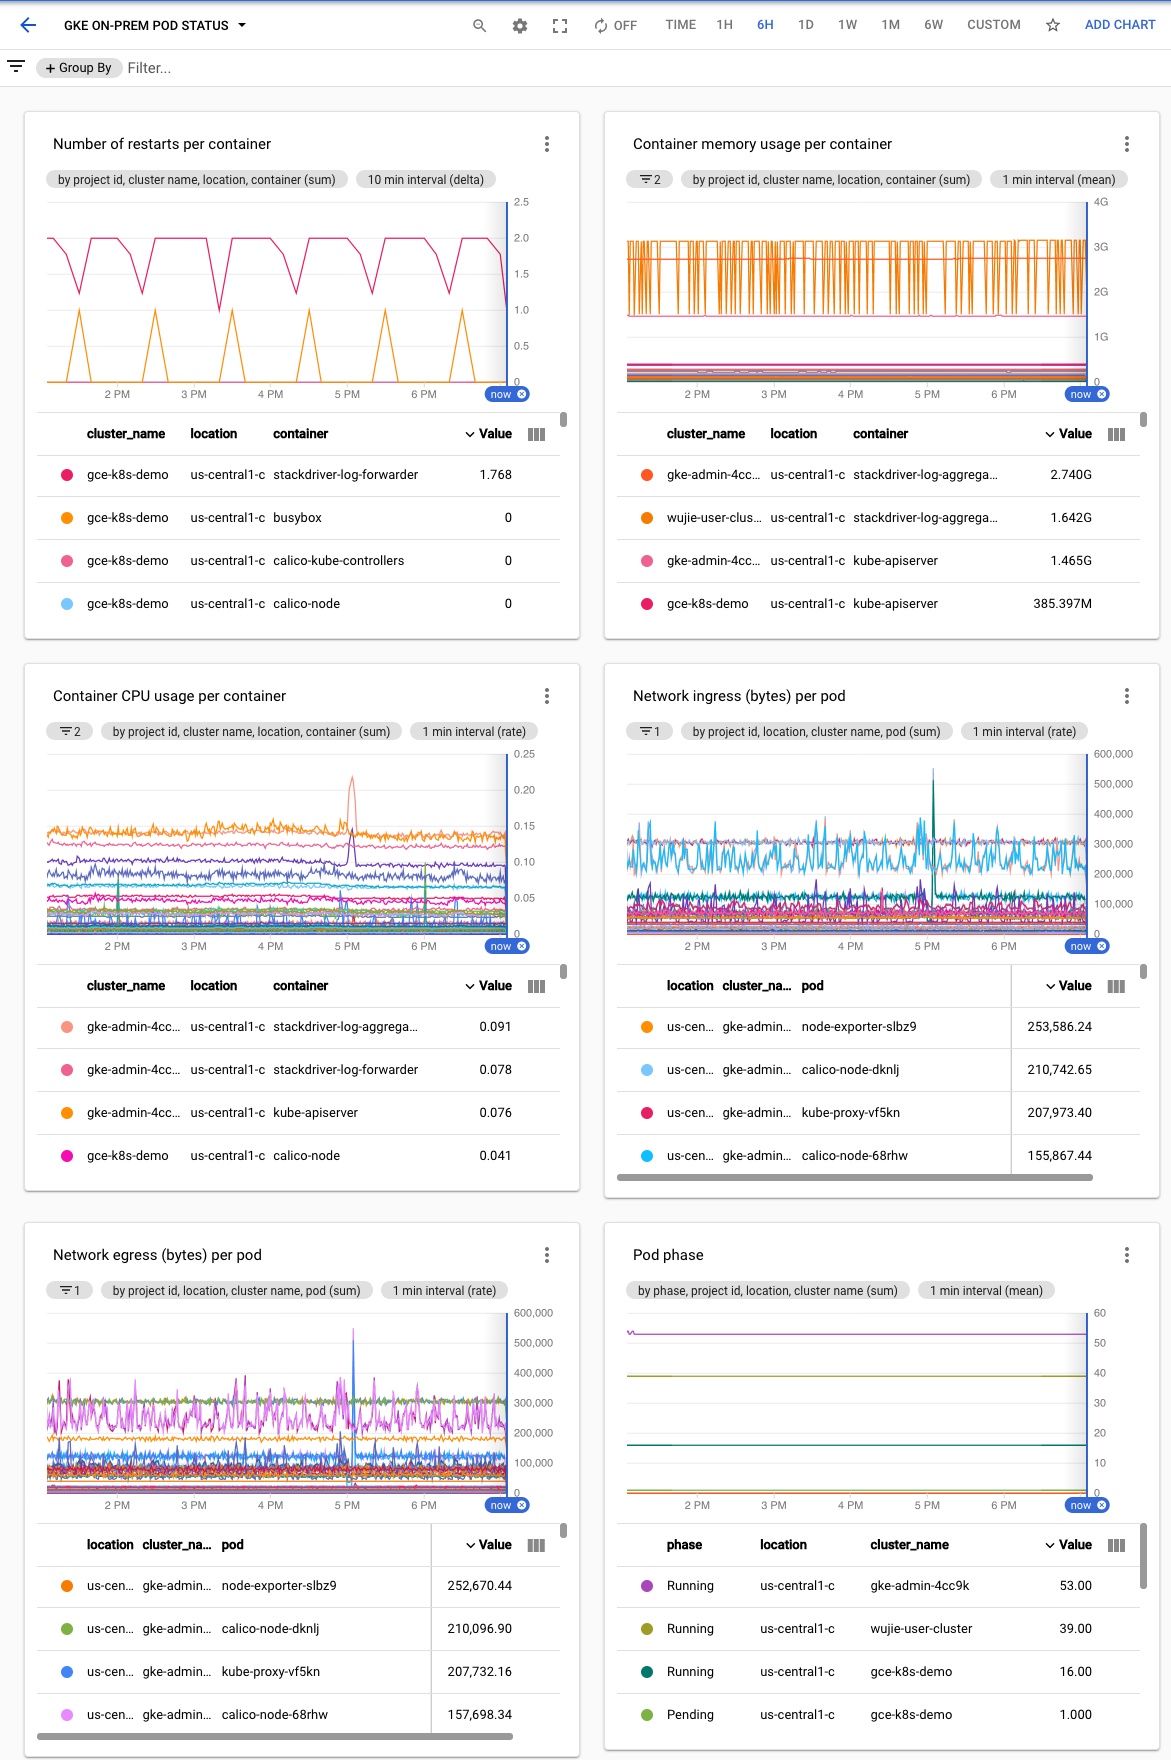
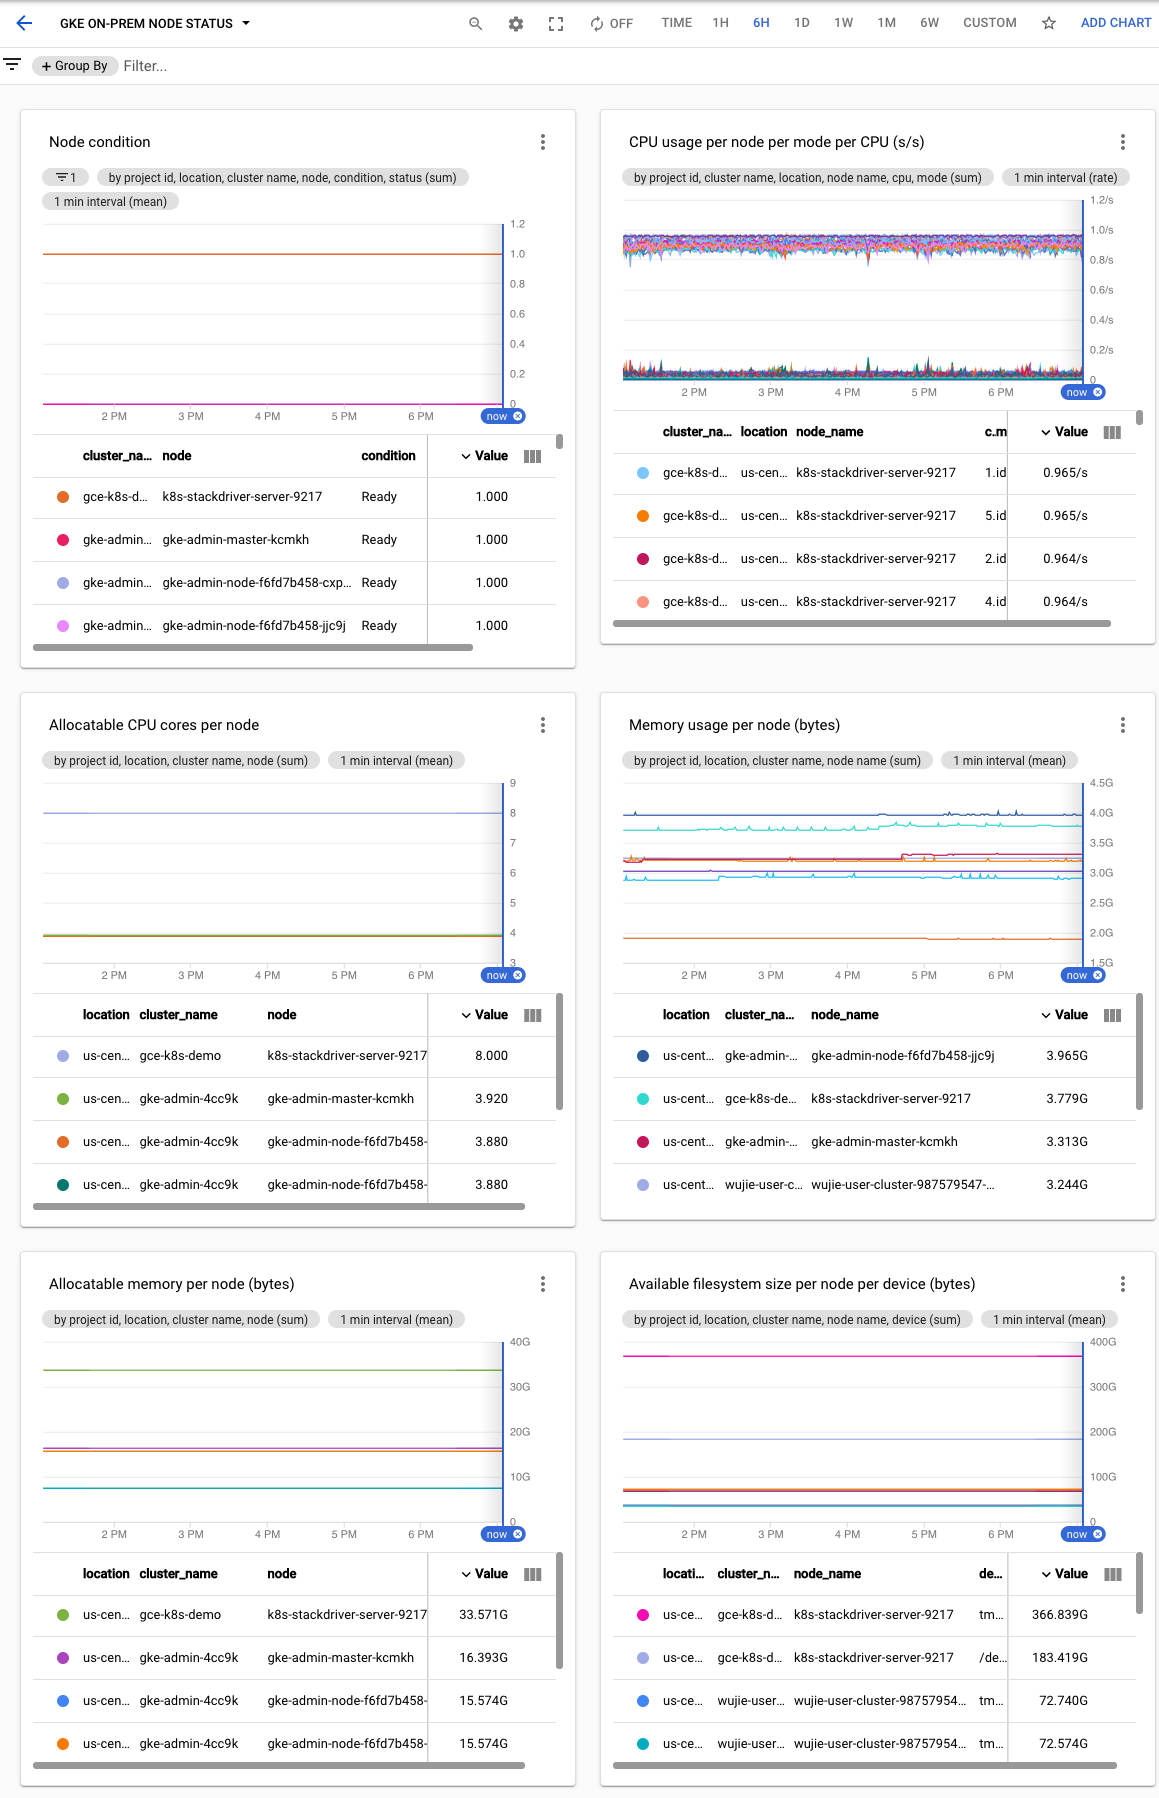
Creating dashboards to monitor cluster health
Google Distributed Cloud clusters are, by default, configured to monitor
system and container metrics. After you create a cluster (admin or user), a
best practice is to create the following dashboards with
Cloud Monitoring to let your Google Distributed Cloud operations
team monitor cluster health:
The dashboards are automatically created during admin cluster installation
if Cloud Monitoring is enabled.
This section describes how to create these dashboards. For more information
about the dashboard creation process described in the following sections, seeManaging dashboards by API.
Prerequisites
Your Google Account must have the followingpermissionsto create dashboards:
monitoring.dashboards.create
monitoring.dashboards.delete
monitoring.dashboards.update
You'll have these permissions if your account has one of the following
roles. You can check your permissions (in the Google Cloud console):
monitoring.dashboardEditor
monitoring.editor
Projecteditor
Projectowner
In addition, to usegcloud(gcloud CLI) to create dashboards, your Google Account must have theserviceusage.services.usepermission.
Your account will have this permission if it has one of the following roles:
roles/serviceusage.serviceUsageConsumer
roles/serviceusage.serviceUsageAdmin
roles/owner
roles/editor
Projecteditor
Projectowner
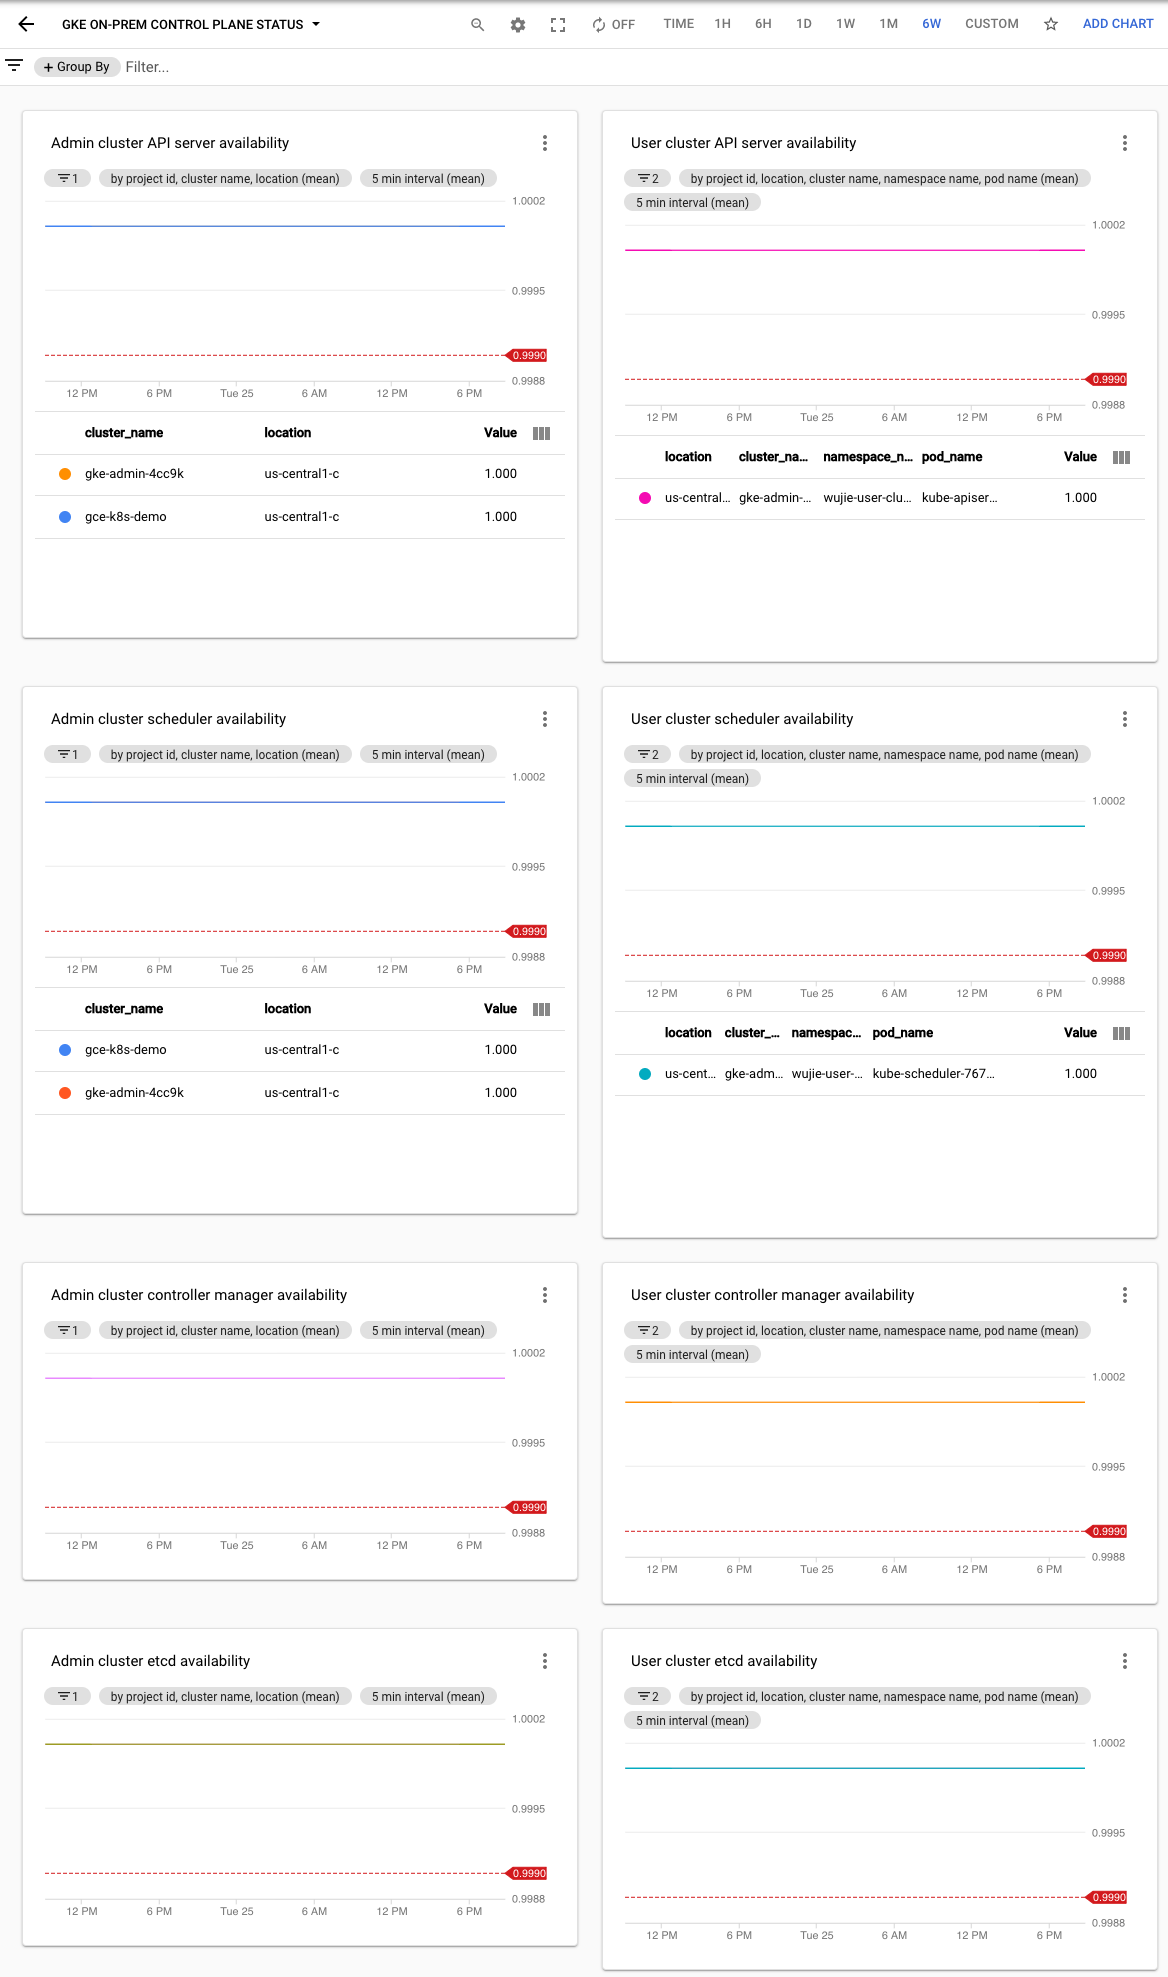
Create a control plane status dashboard
The Google Distributed Cloud control plane consists of the API server,
scheduler, controller manager, and etcd. To monitor the status of the
control plane, create a dashboard that monitors the state of these components.
SelectResources >Dashboardsand
view the dashboard namedGKE on-prem control plane status. The control plane status of each user
cluster is collected from separate namespaces within the admin cluster.
Thenamespace_namefield is the user cluster name.
An service level objective (SLO) threshold of 0.999 is set in each chart.
When you create a cluster, Google Distributed Cloudautomatically createsa Stackdriver custom resource. You can edit the spec in the custom resource to override the default values for CPU and memory
requests and limits for a Stackdriver component, and you can separately override the default storage size and storage class.
Override default values for requests and limits for CPU and memory
To override these defaults, do the following:
Open your Stackdriver custom resource in a command line editor:
Note that theresourceAttrOverridefield overrides all existing default
limits and requests for the component you specify. An example file looks
like the following:
Add thestorageSizeOverridefield under thespecsection. You can use the componentstackdriver-prometheus-k8sorstackdriver-prometheus-app. The section takes this format:
storageSizeOverride:STATEFULSET_NAME:SIZE
This example uses the statefulsetstackdriver-prometheus-k8sand size120Gi.
whereKUBECONFIGis the path to your kubeconfig file for the cluster. This can be either an admin cluster or user cluster.
Add thestorageClassNamefield under thespecsection:
storageClassName:STORAGECLASS_NAME
Note that thestorageClassNamefield overrides the existing default storage class, and applies to all logging and monitoring components with persistent volumes claimed. An example file looks like the following:
Metadata is used indirectly via metrics. When you filter for metrics in
Monitoring Metrics Explorer, you see options to filter metrics bymetadata.systemLabelsandmetadata.userLabels. System labels are labels such
as node name and Service name for Pods. User labels are labels assigned to Pods
in the Kubernetes YAML files in the "metadata" section of the Pod specification.
Default Cloud Monitoring quota limits
Google Distributed Cloud monitoring has a default limit of 6000 API calls per minute for
each project. If you exceed this limit, your metrics may not be displayed.
If you need a higher monitoring limit,request a quota adjustment.
Known issue: Cloud Monitoring error condition
(Issue ID 159761921)
Under certain conditions, the default Cloud Monitoring pod,
deployed by default in each new cluster, can become unresponsive.
When clusters are upgraded, for example, storage data can become
corrupted when pods instatefulset/prometheus-stackdriver-k8sare restarted.
Specifically, monitoring podstackdriver-prometheus-k8s-0can be
caught in a loop when corrupted data preventsprometheus-stackdriver-sidecarwriting to the cluster storagePersistentVolume.
You can manually diagnose and recover the error following the steps below.
Diagnosing the Cloud Monitoring failure
When the monitoring pod has failed, the logs will report the following:
{"log":"level=warn ts=2020-04-08T22:15:44.557Z caller=queue_manager.go:534 component=queue_manager msg=\"Unrecoverable error sending samples to remote storage\" err=\"rpc error: code = InvalidArgument desc = One or more TimeSeries could not be written: One or more points were written more frequently than the maximum sampling period configured for the metric.: timeSeries[0-114]; Unknown metric: kubernetes.io/anthos/scheduler_pending_pods: timeSeries[196-198]\"\n","stream":"stderr","time":"2020-04-08T22:15:44.558246866Z"}
{"log":"level=error ts=2020-04-08T22:15:44.663Z caller=main.go:603 err=\"corruption after 29032448 bytes: unexpected non-zero byte in padded page\"\n","stream":"stderr","time":"2020-04-08T22:15:44.663707748Z"}
{"log":"level=info ts=2020-04-08T22:15:44.663Z caller=main.go:605 msg=\"See you next time!\"\n","stream":"stderr","time":"2020-04-08T22:15:44.664000941Z"}
Recovering from the Cloud Monitoring error
To recover Cloud Monitoring manually:
Stop cluster monitoring. Scale down thestackdriveroperator to prevent monitoring reconciliation:
The following sections explain how to use Prometheus and Grafana with
Google Distributed Cloud clusters.
Enabling Prometheus and Grafana
Starting in Google Distributed Cloud version 1.2, you can choose whether to
enable or disable Prometheus and Grafana. In new user clusters, Prometheus and
Grafana are disabled by default.
Your user cluster has a Monitoring object namedmonitoring-sample. Open the
object for editing:
In user clusters, Prometheus and Grafana get automatically disabled during
upgrade. However, the configuration and metrics data are not lost.
To work around this issue, after the upgrade, openmonitoring-samplefor
editing and setenablePrometheustotrue.
Accessing monitoring metrics from Grafana dashboards
Grafana displays metrics gathered from your clusters. To view these metrics, you
need to access Grafana's dashboards:
Get the name of the Grafana Pod running in a user cluster'skube-systemnamespace:
kubectl --kubeconfig[USER_CLUSTER_KUBECONFIG]-n kube-system get pods
where[USER_CLUSTER_KUBECONFIG]is the user cluster's kubeconfig
file.
The Grafana Pod has an HTTP server listening on TCP localhost port 3000.
Forward a local port to port 3000 in the Pod, so that you can view Grafana's
dashboards from a web browser.
For example, suppose the name of the Pod isgrafana-0. To forward port
50000 to port 3000 in the Pod, enter this command::
From a web browser, navigate tohttp://localhost:50000.
On the login page, enteradminfor username and password.
If login is successful, you will see a prompt to change the password. After you have changed the default password, the user cluster's Grafana Home Dashboard should load.
To access other dashboards, click theHomedrop-down menu in the
top-left corner of the page.
Prometheus Alertmanager collects alerts from the Prometheus server. You can view
these alerts in a Grafana dashboard. To view the alerts, you need to access the
dashboard:
The container in thealertmanager-0Pod listens on TCP port 9093. Forward a
local port to port 9093 in the Pod:
From a web browser, navigate tohttp://localhost:50001.
Changing Prometheus Alertmanager configuration
You can change Prometheus Alertmanager's default configuration by editing your
user cluster'smonitoring.yamlfile. You should do this if you want to direct
alerts to a specific destination, rather than keep them in the dashboard. You
can learn how to configure Alertmanager in Prometheus'Configurationdocumentation.
To change the Alertmanager configuration, perform the following steps:
Make a copy of the user cluster'smonitoring.yamlmanifest file:
The default monitoring configuration supports up to five nodes. For larger
clusters, you can adjust the Prometheus Server resources. The recommendation
is 50m cores of CPU and 500Mi of memory per cluster node. Make sure that your
cluster contains two nodes, each with sufficient resources to fit Prometheus.
For more information, refer toResizing a user cluster.
To change Prometheus Server resources, perform the following steps:
Make a copy of the user cluster'smonitoring.yamlmanifest file:
kubectl --kubeconfig[USER_CLUSTER_KUBECONFIG]-n kube-system get monitoring monitoring-sample -o yaml > monitoring.yaml
To override resources, make changes to the fields underspec.resourceOverride. When you're finished, save the changed manifest.
Example:
You've deployed an application that exposes a metric, verified that the metric
is exposed, and verified that Prometheus scrapes the metric. Now you can add the
application-level metric to a custom Grafana dashboard.
To create a Grafana dashboard, perform the following steps:
To verify that Prometheus is scraping the metric, navigate to
http://localhost:50003/targets, which should take you to theprometheus-0Pod under theprometheus-io-podstarget group.
To view metrics in Prometheus, navigate to http://localhost:50003/graph.
From thesearchfield, enterfoo, then clickExecute. The page should
display the metric.
[[["Easy to understand","easyToUnderstand","thumb-up"],["Solved my problem","solvedMyProblem","thumb-up"],["Other","otherUp","thumb-up"]],[["Hard to understand","hardToUnderstand","thumb-down"],["Incorrect information or sample code","incorrectInformationOrSampleCode","thumb-down"],["Missing the information/samples I need","missingTheInformationSamplesINeed","thumb-down"],["Other","otherDown","thumb-down"]],["Last updated 2026-06-29 UTC."],[],[]]