
This document describes how to list and chart log-based metrics by using the Google Cloud console. For information about creating log-based metrics, see Configure counter metrics and Configure distribution metrics .
Before you begin
Ensure that your Identity and Access Management role includes the permissions required to create and view log-based metrics, and to create alerting policies. For details, see Permissions for log-based metrics .
List log-based metrics
To view a list of log-based metrics for your Google Cloud project, do the following:
-
In the Google Cloud console, go to the Log-based Metrics page:
If you use the search bar to find this page, then select the result whose subheading is Logging .
-
Select an existing Google Cloud project. The log-based metrics interface displays two lists of metric-types: System metricsand User-defined metrics.
The User-defined metricspane of the log-based metrics interface has several features to help you manage the user-defined metrics in your Google Cloud project:
-
The user-defined metrics table includes Name, Description, Type, and Filtercolumns. These fields are specified when you create the metric.
-
The Filter user-defined metricspane lets you filter your metric list by text search or metric Name, Description, and Filter.
-
The user-defined metrics table includes columns for Previous month usageand Month-to-date usage (MTD). This usage data is useful, for example, if you want to determine which metrics ingest the most data or to estimate your bills .
The more_vert More menu for each metric in your user-defined metrics pane contains additional features for managing your metrics:
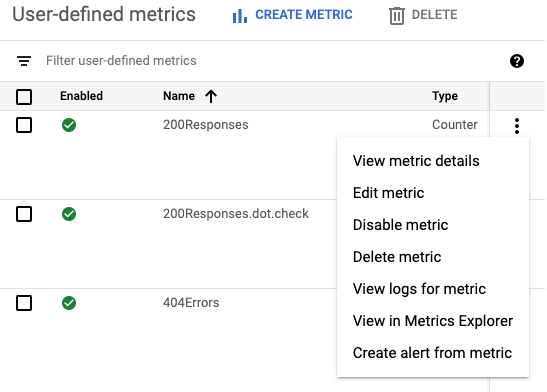
- View metric details: Shows you the metric's Name, Type, Description, Filter, Units, and Labels, if defined.
- Edit metric: Lets you edit certain fields for the metric.
- Disable metric: Lets you stops the metric from being calculated. You can re-enable a disabled metric from the same menu.
- Delete metric: Lets you delete the metric.
- View logs for metric: Takes you to the Logs Explorer and populates the metric's filter in the Query builderand runs the query.
- View in Metrics Explorer: Lets you chart the metric.
- Create alert from metric: Lets you configure notifications when a log-based metric matches criteria that you specify. For more information, see Alert on log-based metrics .
-
Chart log-based metrics
To create a chart of a log-based metric, do the following:
-
In the Google Cloud console, go to the Log-based Metrics page:
If you use the search bar to find this page, then select the result whose subheading is Logging .
-
Find the metric you want to view, and then select View in Metrics Explorerfrom the metric's more_vert More menu.
Metrics Explorer opens and is preconfigured for you. However, you might want to change some chart settings.
For example, the following screenshot shows a chart of the system metric with the name
byte_countfor a particular Google Cloud project: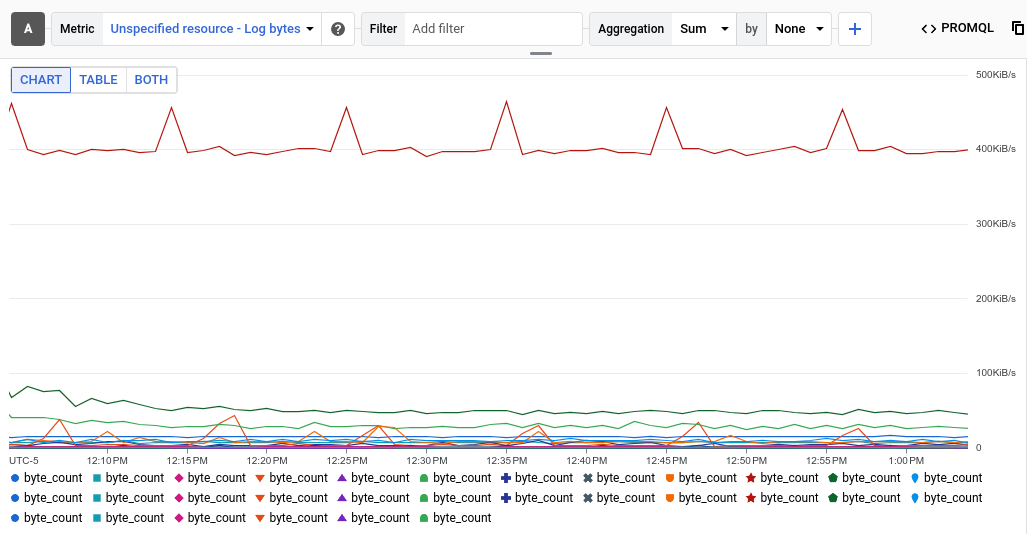
The Aggregationentry shows that each time series on the chart is a sum of the bytes written to a specific log. In the previous example, the project contains multiple logs, so the chart displays multiple time series.
To view the data for a specific log, add a filter. For example, to view the
byte_countmetric for log entries written by BigQuery, click Add filter, select log, and then select the BigQuery entry. The chart now displays a single time series, which shows the total of the log bytes written by BigQuery. If you want to view thebyte_countmetric by the severity of the log entry, then change the second menu in the Aggregationentry from Noneto Severity. The following chart shows thebyte_countmetric displayed by severity level for logs written by BigQuery:
-
For distribution-valued log-based metrics, expand Line chartand select Heatmap chart.
For more information about distribution-valued metrics, see Distribution metrics and Percentiles and distribution-valued metrics .
-
Optional: To save the chart for future reference, click Save chartin the toolbar, and then complete the dialog. You can save the chart to an existing dashboard or create a new dashboard.
What's next
- To create an alerting policy for a log-based metric, see Alert on log-based metrics .
-
For more information about charting metric data, see these Monitoring resources: