
This page guides you through the components of the new Explore experience and describes how to view and interact with Explore queries in the new experience. Read the following sections to learn about these concepts:
- Required roles
- Finding Explores in Looker
- Accessing the New Explore experience
- Navigating the components of the new Explore experience
- Drilling into data for additional detail
- Using links and actions that might be available in the data
- Related resources
You can view and interact with Explores in the new Explore experience as much as you want without impacting other Looker users. Visit the Creating and editing Explores in the new Explore experience to learn more about creating or editing an Explore query in the new Explore experience.
Required roles
To view and interact with Explores you must have the User Looker role
or another role that contains the explore
permission.
Finding Explores in Looker
You can find prebuilt Explore queries in Looker in several ways, including the following:
- Click the Explore from Herelink while editing Looks or dashboard tiles .
- Click the Explore from Herelink on Alerts and scheduled deliveries .
- Follow links that are shared by other users .
- Use Quick Start analyses or Insight Assistant as a starting point in a blank Explore.
- Upload a CSV, an XLS, or an XLSX file .
You can also use the Exploresection in the main navigation panel to open a blank Explore.
Accessing the new Explore experience
To access the new Explore experience, the New Looker Explore Experience preview feature must be enabled for your instance. If you are not a Looker admin, ask an admin to enable the feature.
From an Explore page, click Try the new Exploreto turn on the new Explore experience for all Explores that you interact with. To switch back to the classic experience, click Switch to classic Explore.
Navigating the new Explore experience
The new Explore experience consists of the following elements:

- The Filterpane: Displays the filters that are applied to Explores, as well as filter options. Learn more about applying filters in the new Explore experience .
- The Visualizationpane: Displays the results of the Explore query visualized in a chart.
- The Datapane: Displays the results of the Explore query in a data table, or the underlying SQL query when the SQL Querybutton is clicked.
- The Drag indicator: Lets you resize the height of the Visualizationpane and the Datapane, and the width of the Configurepanel when you click and hold your cursor on the Drag indicator.
- The data column Moremenu: Displays the options for editing the Explore query around a specific column. Learn more about using the data column Moremenu to edit Explore queries in the new Explore experience .
- The Sort Orderindicator: Indicates the field or fields, the direction (ascending or descending), and the order, that an Explore query is sorted by. Learn more about sorting queries in the new Explore experience .
- The Data Tablebutton: Lets you display or hide the Datapanel.
- The Resultsbutton: When clicked, displays the Explore results in a data table.
- The SQL Querybutton: When clicked, displays the SQL query that's generated to fetch the Explore results instead of the results data table.
- The Totalsswitch: When enabled, displays the row or column totals in the Explore results. Learn more about totals in the new Explore experience .
- The Limitfield: Lets you input a number to limit the displayed results. Learn more about limiting data in the new Explore experience .
- The Switch to classic Explorebutton: When clicked, switches the Explore view to the classic Explore experience.
- The Quick Startbutton: Opens the Quick Startpanel that displays quick start analyses, when available. Learn more about using Quick Start analyses in the new Explore experience .
- The Insight Assistantbutton: Opens the Insight Assistantpanel that lets you ask questions to discover insights and answers using data from the Explore. Learn more about using the Insight Assistant in Explores.
- The Change chartbutton: Opens the All chart typesmenu, which let you choose how to visualize the Explore data. You can also click Auto visualizeto let Looker choose the best chart option for displaying the results. Learn more about selecting an effective data visualization and editing visualizations in the new Explore experience .
- The Runbutton: Runs the query with the fields that are selected from the Configurepanel. When a query is running, the button becomes the Stopbutton. You can stop a query when it is running by clicking the Stopbutton.
- The Save or sharebutton: Opens a menu that displays the options to save, download, or share an Explore query. Learn more about saving or sharing Explores in the new Explore experience.
- The More optionsmenu: Displays more options, including Clear cache and refreshwhen permissions allow. Learn more about refreshing data .
- The Configurepanel : Displays the All Fields , Fields in use , and visualization Style tabs, which let you select fields to create and edit the Explore results and the Explore visualization. Learn more about creating and editing Explores in the new Explore experience and about editing visualizations in the new Explore experience .
- The name of the Explore. Click the Explore Summarybutton to view a description of the Explore that was either added by a developer, or generated by Gemini in Looker .
- The Clear alland Clear fields keep filtersoptions: When clicked, Clear allclears all of the Explore fields, and Clear fields keep filtersclears the Explore fields but keeps any filters that are applied.
- The Merge queries (join data)button: Opens the Join datapage. Learn more about joining data in the new Explore experience .
- The Explore summary: Displays the total number of fields in an Explore (including custom fields and table calculations when permissions
allow), and the Go to LookMLlink. The Go to LookMLlink directs users to the
exploredefinition in its LookML project. This link is visible only to users with thesee_lookmlpermission. - The Configurebutton: Lets you display or hide the Configurepanel. Alternatively, click the Closebutton to close the Configurepanel.
- The Filterbutton: Lets you display or hide the Filterpane.
- The Visualizationbutton: Lets you display or hide the Visualizationpane.
- The Data Tablebutton: Lets you display or hide the Datapane.
- The Feedbackbutton: Lets you submit feedback that you have about the new Explore experience.
- The Move Leftor Move Rightbutton: Lets you change the docking orientation of the Configurepanel on the Explore page. The button label is Move Leftwhen the Configurepanel is docked on the right and Move Rightwhen the Configurepanel is docked on the left.
Using the Save or share menu
The Save or sharemenu in the new Explore experience lets users save and share an Explore in several ways, depending on their permissions in Looker. Depending on user permissions and instance integrations, the options can include the following:
- Save to new dashboard: Save an Explore as a query tile to a new dashboard .
- Save to existing dashboard: Save an Explore as a query tile to an existing dashboard.
- Save as a Look: Save an Explore as a Look .
- Download: Select this option to download the contents of an Explore in one of several format options.
- Share URLs: Select this option to open the Share URLsmenu to copy the short or expanded Explore URL to your clipboard.
Drilling into the data
Every query result is the starting point for another query. Selecting any data point in a result will drill down , creating another query that's refined by the data point that you selected. For example, you might have an Explore that displays flight information, in this case Flight Countgrouped by Origin City. In this example, the selected origin city, Chicago, has 4,719,108 flights. Clicking the count value of 4,719,108opens a drill window that displays a data table that contains details about those specific flight records.

Drilling deeper ...
The drill window displays all the flights that had Chicago as a point of origin. From the drill window, you can do the following:
- Click Exploreto open an Explore that uses the fields in the drill window as a starting point.
- Click Downloadto download the data using the same options as shown on the Downloading content documentation page.
- Select a value from the drill window data table to keep drilling in the drill window.
Looker query results are linked so that you can keep drilling, exploring, and arriving at new insights.
Drilling into dashboards
You can also drill into data from dashboards. For example, suppose you have a dashboard called Business Overviewthat has a filter on the field Statefor all dashboard tiles. In this example Explore, which is a query tile on the dashboard, the Business Overviewdashboard appears as an option in the Dashboardssection of the drill menu for the Statefield, since the Statefield is used as a filter on that dashboard:
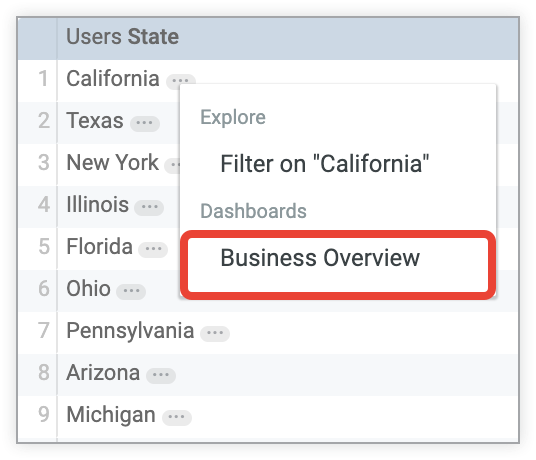
When you click the name of the dashboard in the drill menu's Dashboardssection, Looker takes you to the Business Overviewdashboard, with the filter for the dashboard set to the value for the Statefield that you selected in the Explore.
Using links and data actions
The presence of links or data actions is indicated by an ellipsis (…) following the value in an Explore column. You can access links and action options by clicking the ellipsis (...) to open the drill menu.
Using links
Your Looker developers may have added links to your data. The option to open the link will be available in the Linkssection of the drill menu when you click a value in a data table column.
For example, if a developer adds a link to an external resource to the Percent Flights Delayedfield, Looker provides an option to navigate to that resource. You can select this option in the Linkssection of the drill menu when you select a value for Statefrom the Percent Flights Delayedcolumn in a data table.

Using data actions
Your Looker developers may have added data actions to the dimensions or measures in your data. With data actions, you can perform tasks with other tools directly from Looker, such as sending an email or setting values in other applications. These data actions appear in the drill menu in the Actionssection.

In this example, the Percent Flights Delayedfield has a link to email a delay notification to customers. When the user clicks a column value and chooses the Send Customer Delay Notification Emailaction, the user will be taken to an email service to send a delay notification to impacted customers.
Related resources
Now that you know how powerful the new Explore experience is for learning more about data and discovering insights through iterative searches, you might want to learn how to do the following:
- Learn how to create or edit Explores in the new Explore experience .
- Learn how to edit visualizations in the new Explore experience .
- Learn how to save Explore queries as Looks .
- Learn how to add Explore queries to dashboards .
- Learn how to share data with other users.
