
- Dataset Availability
- 2010-01-01T00:00:00Z–2080-12-31T23:59:59Z
- Dataset Provider
- World Resources Institute
- Tags
Description
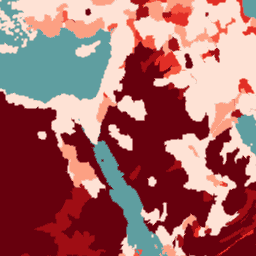
Aqueduct 4.0 is the latest iteration of WRI's water risk framework designed to translate complex hydrological data into intuitive indicators of water related risk. This dataset has curated 13 water risk indicators for quantity, quality and reputational concerns into a comprehensive framework. For 5 of the 13 indicators, a global hydrological model called PCR-GLOBWB 2 has been used to generate novel datasets on sub-basic water supply. The PCR-GLOBWB 2 model is also used to project future sub-basin water conditions using CMIP6 climate forcings. The projections center around three periods (2030, 2050, and 2080) under three future scenarios (business-as-usual SSP 3 RCP 7.0, optimistic SSP 1 RCP 2.6, and pessimistic SSP 5 RCP 8.5).
The water risk indicators have been aggregated by category (quantity, quality, reputational, and overall) into composite risk scores using sector-specific weighting schemes. In addition, select sub-basin scores have been aggregated into country and provincial administrative boundaries using a weighted average approach, where sub-basins with more demand have a higher influence over the final administrative score.
The WRI Aqueduct future annual dataset provides future projections of water supply, demand, stress, depletion, and variability based on CMIP6 climate projections for 3 milestone years: 2030, 2050, and 2080. This dataset can be used to anticipate and adapt to future water challenges which will be useful for water resource management, infrastructure development and climate change adaptation. This technical note explains in detail the framework, methodology, and data used in developing Aqueduct Floods.
Table Schema
Table Schema
| Name | Type | Description |
|---|---|---|
|
pfaf_id
|
INT | Six digit Pfafstetter code for the hydrological basin |
|
fid
|
INT | Feature Id |
|
bau30_ba_x_l
|
STRING | Available blue water label projected by year 2030 under business as usual scenario |
|
bau30_ba_x_r
|
DOUBLE | Available blue water raw value projected by year 2030 under business as usual scenario |
|
bau30_ww_x_l
|
STRING | Gross water demand label projected by year 2030 under business as usual scenario |
|
bau30_ww_x_r
|
DOUBLE | Gross water demand raw value projected by year 2030 under business as usual scenario |
|
bau30_ws_x_c
|
INT | Water stress category projected by year 2030 under business as usual scenario |
|
bau30_ws_x_l
|
STRING | Water stress label projected by year 2030 under business as usual scenario |
|
bau30_ws_x_r
|
DOUBLE | Water stress raw value projected by year 2030 under business as usual scenario |
|
bau30_ws_x_s
|
DOUBLE | Water stress score projected by year 2030 under business as usual scenario |
|
bau30_wd_x_c
|
INT | Baseline water depletion category projected by year 2030 under business as usual scenario |
|
bau30_wd_x_l
|
STRING | Baseline water depletion label projected by year 2030 under business as usual scenario |
|
bau30_wd_x_r
|
DOUBLE | Baseline water depletion raw value projected by year 2030 under business as usual scenario |
|
bau30_wd_x_s
|
DOUBLE | Baseline water depletion score projected by year 2030 under business as usual scenario |
|
bau30_iv_x_c
|
INT | Interannual variability category projected by year 2030 under business as usual scenario |
|
bau30_iv_x_l
|
STRING | Interannual variability label projected by year 2030 under business as usual scenario |
|
bau30_iv_x_r
|
DOUBLE | Interannual variability raw value projected by year 2030 under business as usual scenario |
|
bau30_iv_x_s
|
DOUBLE | Interannual variability score projected by year 2030 under business as usual scenario |
|
bau30_sv_x_c
|
INT | Seasonal variability category projected by year 2030 under business as usual scenario |
|
bau30_sv_x_l
|
STRING | Seasonal variability label projected by year 2030 under business as usual scenario |
|
bau30_sv_x_r
|
DOUBLE | Seasonal variability raw value projected by year 2030 under business as usual scenario |
|
bau30_sv_x_s
|
DOUBLE | Seasonal variability score projected by year 2030 under business as usual scenario |
|
bau50_ba_x_l
|
STRING | Available blue water label projected by year 2050 under business as usual scenario |
|
bau50_ba_x_r
|
DOUBLE | Available blue water raw value projected by year 2050 under business as usual scenario |
|
bau50_ww_x_l
|
STRING | Gross water demand label projected by year 2050 under business as usual scenario |
|
bau50_ww_x_r
|
DOUBLE | Gross water demand raw value projected by year 2050 under business as usual scenario |
|
bau50_ws_x_c
|
INT | Water stress category projected by year 2050 under business as usual scenario |
|
bau50_ws_x_l
|
STRING | Water stress label projected by year 2050 under business as usual scenario |
|
bau50_ws_x_r
|
DOUBLE | Water stress raw value projected by year 2050 under business as usual scenario |
|
bau50_ws_x_s
|
DOUBLE | Water stress score projected by year 2050 under business as usual scenario |
|
bau50_wd_x_c
|
INT | Baseline water depletion category projected by year 2050 under business as usual scenario |
|
bau50_wd_x_l
|
STRING | Baseline water depletion label projected by year 2050 under business as usual scenario |
|
bau50_wd_x_r
|
DOUBLE | Baseline water depletion raw value projected by year 2050 under business as usual scenario |
|
bau50_wd_x_s
|
DOUBLE | Baseline water depletion score projected by year 2050 under business as usual scenario |
|
bau50_iv_x_c
|
INT | Interannual variability category projected by year 2050 under business as usual scenario |
|
bau50_iv_x_l
|
STRING | Interannual variability label projected by year 2050 under business as usual scenario |
|
bau50_iv_x_r
|
DOUBLE | Interannual variability raw value projected by year 2050 under business as usual scenario |
|
bau50_iv_x_s
|
DOUBLE | Interannual variability score projected by year 2050 under business as usual scenario |
|
bau50_sv_x_c
|
INT | Seasonal variability category projected by year 2050 under business as usual scenario |
|
bau50_sv_x_l
|
STRING | Seasonal variability label projected by year 2050 under business as usual scenario |
|
bau50_sv_x_r
|
DOUBLE | Seasonal variability raw value projected by year 2050 under business as usual scenario |
|
bau50_sv_x_s
|
DOUBLE | Seasonal variability score projected by year 2050 under business as usual scenario |
|
bau80_ba_x_l
|
STRING | Available blue water label projected by year 2080 under business as usual scenario |
|
bau80_ba_x_r
|
DOUBLE | Available blue water raw value projected by year 2080 under business as usual scenario |
|
bau80_ww_x_l
|
STRING | Gross water demand label projected by year 2080 under business as usual scenario |
|
bau80_ww_x_r
|
DOUBLE | Gross water demand raw value projected by year 2080 under business as usual scenario |
|
bau80_ws_x_c
|
INT | Water stress category projected by year 2080 under business as usual scenario |
|
bau80_ws_x_l
|
STRING | Water stress label projected by year 2080 under business as usual scenario |
|
bau80_ws_x_r
|
DOUBLE | Water stress raw value projected by year 2080 under business as usual scenario |
|
bau80_ws_x_s
|
DOUBLE | Water stress score projected by year 2080 under business as usual scenario |
|
bau80_wd_x_c
|
INT | Baseline water depletion category projected by year 2080 under business as usual scenario |
|
bau80_wd_x_l
|
STRING | Baseline water depletion label projected by year 2080 under business as usual scenario |
|
bau80_wd_x_r
|
DOUBLE | Baseline water depletion raw value projected by year 2080 under business as usual scenario |
|
bau80_wd_x_s
|
DOUBLE | Baseline water depletion score projected by year 2080 under business as usual scenario |
|
bau80_iv_x_c
|
INT | Interannual variability category projected by year 2080 under business as usual scenario |
|
bau80_iv_x_l
|
STRING | Interannual variability label projected by year 2080 under business as usual scenario |
|
bau80_iv_x_r
|
DOUBLE | Interannual variability raw value projected by year 2080 under business as usual scenario |
|
bau80_iv_x_s
|
DOUBLE | Interannual variability score projected by year 2080 under business as usual scenario |
|
bau80_sv_x_c
|
INT | Seasonal variability category projected by year 2080 under business as usual scenario |
|
bau80_sv_x_l
|
STRING | Seasonal variability label projected by year 2080 under business as usual scenario |
|
bau80_sv_x_r
|
DOUBLE | Seasonal variability raw value projected by year 2080 under business as usual scenario |
|
bau80_sv_x_s
|
DOUBLE | Seasonal variability score projected by year 2080 under business as usual scenario |
|
opt30_ba_x_l
|
STRING | Available blue water label projected by year 2030 under optimistic scenario |
|
opt30_ba_x_r
|
DOUBLE | Available blue water raw value projected by year 2030 under optimistic scenario |
|
opt30_ww_x_l
|
STRING | Gross water demand label projected by year 2030 under optimistic scenario |
|
opt30_ww_x_r
|
DOUBLE | Gross water demand raw value projected by year 2030 under optimistic scenario |
|
opt30_ws_x_c
|
INT | Water stress category projected by year 2030 under optimistic scenario |
|
opt30_ws_x_l
|
STRING | Water stress label projected by year 2030 under optimistic scenario |
|
opt30_ws_x_r
|
DOUBLE | Water stress raw value projected by year 2030 under optimistic scenario |
|
opt30_ws_x_s
|
DOUBLE | Water stress score projected by year 2030 under optimistic scenario |
|
opt30_wd_x_c
|
INT | Baseline water depletion category projected by year 2030 under optimistic scenario |
|
opt30_wd_x_l
|
STRING | Baseline water depletion label projected by year 2030 under optimistic scenario |
|
opt30_wd_x_r
|
DOUBLE | Baseline water depletion raw value projected by year 2030 under optimistic scenario |
|
opt30_wd_x_s
|
DOUBLE | Baseline water depletion score projected by year 2030 under optimistic scenario |
|
opt30_iv_x_c
|
INT | Interannual variability category projected by year 2030 under optimistic scenario |
|
opt30_iv_x_l
|
STRING | Interannual variability label projected by year 2030 under optimistic scenario |
|
opt30_iv_x_r
|
DOUBLE | Interannual variability raw value projected by year 2030 under optimistic scenario |
|
opt30_iv_x_s
|
DOUBLE | Interannual variability score projected by year 2030 under optimistic scenario |
|
opt30_sv_x_c
|
INT | Seasonal variability category projected by year 2030 under optimistic scenario |
|
opt30_sv_x_l
|
STRING | Seasonal variability label projected by year 2030 under optimistic scenario |
|
opt30_sv_x_r
|
DOUBLE | Seasonal variability raw value projected by year 2030 under optimistic scenario |
|
opt30_sv_x_s
|
DOUBLE | Seasonal variability score projected by year 2030 under optimistic scenario |
|
opt50_ba_x_l
|
STRING | Available blue water label projected by year 2050 under optimistic scenario |
|
opt50_ba_x_r
|
DOUBLE | Available blue water raw value projected by year 2050 under optimistic scenario |
|
opt50_ww_x_l
|
STRING | Gross water demand label projected by year 2050 under optimistic scenario |
|
opt50_ww_x_r
|
DOUBLE | Gross water demand raw value projected by year 2050 under optimistic scenario |
|
opt50_ws_x_c
|
INT | Water stress category projected by year 2050 under optimistic scenario |
|
opt50_ws_x_l
|
STRING | Water stress label projected by year 2050 under optimistic scenario |
|
opt50_ws_x_r
|
DOUBLE | Water stress raw value projected by year 2050 under optimistic scenario |
|
opt50_ws_x_s
|
DOUBLE | Water stress score projected by year 2050 under optimistic scenario |
|
opt50_wd_x_c
|
INT | Baseline water depletion category projected by year 2050 under optimistic scenario |
|
opt50_wd_x_l
|
STRING | Baseline water depletion label projected by year 2050 under optimistic scenario |
|
opt50_wd_x_r
|
DOUBLE | Baseline water depletion raw value projected by year 2050 under optimistic scenario |
|
opt50_wd_x_s
|
DOUBLE | Baseline water depletion score projected by year 2050 under optimistic scenario |
|
opt50_iv_x_c
|
INT | Interannual variability category projected by year 2050 under optimistic scenario |
|
opt50_iv_x_l
|
STRING | Interannual variability label projected by year 2050 under optimistic scenario |
|
opt50_iv_x_r
|
DOUBLE | Interannual variability raw value projected by year 2050 under optimistic scenario |
|
opt50_iv_x_s
|
DOUBLE | Interannual variability score projected by year 2050 under optimistic scenario |
|
opt50_sv_x_c
|
INT | Seasonal variability category projected by year 2050 under optimistic scenario |
|
opt50_sv_x_l
|
STRING | Seasonal variability label projected by year 2050 under optimistic scenario |
|
opt50_sv_x_r
|
DOUBLE | Seasonal variability raw value projected by year 2050 under optimistic scenario |
|
opt50_sv_x_s
|
DOUBLE | Seasonal variability score projected by year 2050 under optimistic scenario |
|
opt80_ba_x_l
|
STRING | Available blue water label projected by year 2080 under optimistic scenario |
|
opt80_ba_x_r
|
DOUBLE | Available blue water raw value projected by year 2080 under optimistic scenario |
|
opt80_ww_x_l
|
STRING | Gross water demand label projected by year 2080 under optimistic scenario |
|
opt80_ww_x_r
|
DOUBLE | Gross water demand raw value projected by year 2080 under optimistic scenario |
|
opt80_ws_x_c
|
INT | Water stress category projected by year 2080 under optimistic scenario |
|
opt80_ws_x_l
|
STRING | Water stress label projected by year 2080 under optimistic scenario |
|
opt80_ws_x_r
|
DOUBLE | Water stress raw value projected by year 2080 under optimistic scenario |
|
opt80_ws_x_s
|
DOUBLE | Water stress score projected by year 2080 under optimistic scenario |
|
opt80_wd_x_c
|
INT | Baseline water depletion category projected by year 2080 under optimistic scenario |
|
opt80_wd_x_l
|
STRING | Baseline water depletion label projected by year 2080 under optimistic scenario |
|
opt80_wd_x_r
|
DOUBLE | Baseline water depletion raw value projected by year 2080 under optimistic scenario |
|
opt80_wd_x_s
|
DOUBLE | Baseline water depletion score projected by year 2080 under optimistic scenario |
|
opt80_iv_x_c
|
INT | Interannual variability category projected by year 2080 under optimistic scenario |
|
opt80_iv_x_l
|
STRING | Interannual variability label projected by year 2080 under optimistic scenario |
|
opt80_iv_x_r
|
DOUBLE | Interannual variability raw value projected by year 2080 under optimistic scenario |
|
opt80_iv_x_s
|
DOUBLE | Interannual variability score projected by year 2080 under optimistic scenario |
|
opt80_sv_x_c
|
INT | Seasonal variability category projected by year 2080 under optimistic scenario |
|
opt80_sv_x_l
|
STRING | Seasonal variability label projected by year 2080 under optimistic scenario |
|
opt80_sv_x_r
|
DOUBLE | Seasonal variability raw value projected by year 2080 under optimistic scenario |
|
opt80_sv_x_s
|
DOUBLE | Seasonal variability score projected by year 2080 under optimistic scenario |
|
pes30_ba_x_l
|
STRING | Available blue water label projected by year 2030 under pessimistic scenario |
|
pes30_ba_x_r
|
DOUBLE | Available blue water raw value projected by year 2030 under pessimistic scenario |
|
pes30_ww_x_l
|
STRING | Gross water demand label projected by year 2030 under pessimistic scenario |
|
pes30_ww_x_r
|
DOUBLE | Gross water demand raw value projected by year 2030 under pessimistic scenario |
|
pes30_ws_x_c
|
INT | Water stress category projected by year 2030 under pessimistic scenario |
|
pes30_ws_x_l
|
STRING | Water stress label projected by year 2030 under pessimistic scenario |
|
pes30_ws_x_r
|
DOUBLE | Water stress raw value projected by year 2030 under pessimistic scenario |
|
pes30_ws_x_s
|
DOUBLE | Water stress score projected by year 2030 under pessimistic scenario |
|
pes30_wd_x_c
|
INT | Baseline water depletion category projected by year 2030 under pessimistic scenario |
|
pes30_wd_x_l
|
STRING | Baseline water depletion label projected by year 2030 under pessimistic scenario |
|
pes30_wd_x_r
|
DOUBLE | Baseline water depletion raw value projected by year 2030 under pessimistic scenario |
|
pes30_wd_x_s
|
DOUBLE | Baseline water depletion score projected by year 2030 under pessimistic scenario |
|
pes30_iv_x_c
|
INT | Interannual variability category projected by year 2030 under pessimistic scenario |
|
pes30_iv_x_l
|
STRING | Interannual variability label projected by year 2030 under pessimistic scenario |
|
pes30_iv_x_r
|
DOUBLE | Interannual variability raw value projected by year 2030 under pessimistic scenario |
|
pes30_iv_x_s
|
DOUBLE | Interannual variability score projected by year 2030 under pessimistic scenario |
|
pes30_sv_x_c
|
INT | Seasonal variability category projected by year 2030 under pessimistic scenario |
|
pes30_sv_x_l
|
STRING | Seasonal variability label projected by year 2030 under pessimistic scenario |
|
pes30_sv_x_r
|
DOUBLE | Seasonal variability raw value projected by year 2030 under pessimistic scenario |
|
pes30_sv_x_s
|
DOUBLE | Seasonal variability score projected by year 2030 under pessimistic scenario |
|
pes50_ba_x_l
|
STRING | Available blue water label projected by year 2050 under pessimistic scenario |
|
pes50_ba_x_r
|
DOUBLE | Available blue water raw value projected by year 2050 under pessimistic scenario |
|
pes50_ww_x_l
|
STRING | Gross water demand label projected by year 2050 under pessimistic scenario |
|
pes50_ww_x_r
|
DOUBLE | Gross water demand raw value projected by year 2050 under pessimistic scenario |
|
pes50_ws_x_c
|
INT | Water stress category projected by year 2050 under pessimistic scenario |
|
pes50_ws_x_l
|
STRING | Water stress label projected by year 2050 under pessimistic scenario |
|
pes50_ws_x_r
|
DOUBLE | Water stress raw value projected by year 2050 under pessimistic scenario |
|
pes50_ws_x_s
|
DOUBLE | Water stress score projected by year 2050 under pessimistic scenario |
|
pes50_wd_x_c
|
INT | Baseline water depletion category projected by year 2050 under pessimistic scenario |
|
pes50_wd_x_l
|
STRING | Baseline water depletion label projected by year 2050 under pessimistic scenario |
|
pes50_wd_x_r
|
DOUBLE | Baseline water depletion raw value projected by year 2050 under pessimistic scenario |
|
pes50_wd_x_s
|
DOUBLE | Baseline water depletion score projected by year 2050 under pessimistic scenario |
|
pes50_iv_x_c
|
INT | Interannual variability category projected by year 2050 under pessimistic scenario |
|
pes50_iv_x_l
|
STRING | Interannual variability label projected by year 2050 under pessimistic scenario |
|
pes50_iv_x_r
|
DOUBLE | Interannual variability raw value projected by year 2050 under pessimistic scenario |
|
pes50_iv_x_s
|
DOUBLE | Interannual variability score projected by year 2050 under pessimistic scenario |
|
pes50_sv_x_c
|
INT | Seasonal variability category projected by year 2050 under pessimistic scenario |
|
pes50_sv_x_l
|
STRING | Seasonal variability label projected by year 2050 under pessimistic scenario |
|
pes50_sv_x_r
|
DOUBLE | Seasonal variability raw value projected by year 2050 under pessimistic scenario |
|
pes50_sv_x_s
|
DOUBLE | Seasonal variability score projected by year 2050 under pessimistic scenario |
|
pes80_ba_x_l
|
STRING | Available blue water label projected by year 2080 under pessimistic scenario |
|
pes80_ba_x_r
|
DOUBLE | Available blue water raw value projected by year 2080 under pessimistic scenario |
|
pes80_ww_x_l
|
STRING | Gross water demand label projected by year 2080 under pessimistic scenario |
|
pes80_ww_x_r
|
DOUBLE | Gross water demand raw value projected by year 2080 under pessimistic scenario |
|
pes80_ws_x_c
|
INT | Water stress category projected by year 2080 under pessimistic scenario |
|
pes80_ws_x_l
|
STRING | Water stress label projected by year 2080 under pessimistic scenario |
|
pes80_ws_x_r
|
DOUBLE | Water stress raw value projected by year 2080 under pessimistic scenario |
|
pes80_ws_x_s
|
DOUBLE | Water stress score projected by year 2080 under pessimistic scenario |
|
pes80_wd_x_c
|
INT | Baseline water depletion category projected by year 2080 under pessimistic scenario |
|
pes80_wd_x_l
|
STRING | Baseline water depletion label projected by year 2080 under pessimistic scenario |
|
pes80_wd_x_r
|
DOUBLE | Baseline water depletion raw value projected by year 2080 under pessimistic scenario |
|
pes80_wd_x_s
|
DOUBLE | Baseline water depletion score projected by year 2080 under pessimistic scenario |
|
pes80_iv_x_c
|
INT | Interannual variability category projected by year 2080 under pessimistic scenario |
|
pes80_iv_x_l
|
STRING | Interannual variability label projected by year 2080 under pessimistic scenario |
|
pes80_iv_x_r
|
DOUBLE | Interannual variability raw value projected by year 2080 under pessimistic scenario |
|
pes80_iv_x_s
|
DOUBLE | Interannual variability score projected by year 2080 under pessimistic scenario |
|
pes80_sv_x_c
|
INT | Seasonal variability category projected by year 2080 under pessimistic scenario |
|
pes80_sv_x_l
|
STRING | Seasonal variability label projected by year 2080 under pessimistic scenario |
|
pes80_sv_x_r
|
DOUBLE | Seasonal variability raw value projected by year 2080 under pessimistic scenario |
|
pes80_sv_x_s
|
DOUBLE | Seasonal variability score projected by year 2080 under pessimistic scenario |
Terms of Use
Terms of Use
The WRI datasets are available without restriction on use or distribution. WRI does request that the user give proper attribution and identify WRI, where applicable, as the source of the data. For more information check WRI's open data commitment ,
Explore with Earth Engine
Code Editor (JavaScript)
 var

 dataset

 =

 ee
 .
 FeatureCollection
 (
 'WRI/Aqueduct_Water_Risk/V4/future_annual'
 );
 var

 reds

 =

 ee
 .
 List
 ([

 '67000D'
 ,

 '9E0D14'
 ,

 'E32F27'
 ,

 'F6553D'
 ,

 'FCA082'
 ,

 'FEE2D5'
 ]);
 function

 normalize
 (
 value
 ,

 min
 ,

 max
 )

 {

 return

 value
 .
 subtract
 (
 min
 ).
 divide
 (
 ee
 .
 Number
 (
 max
 ).
 subtract
 (
 min
 ));
 }
 function

 setColor
 (
 feature
 ,

 property
 ,

 min
 ,

 max
 ,

 palette
 )

 {

 var

 value

 =

 normalize
 (
 feature
 .
 getNumber
 (
 property
 ),

 min
 ,

 max
 )

 .
 multiply
 (
 palette
 .
 size
 ())

 .
 min
 (
 palette
 .
 size
 ().
 subtract
 (
 1
 ))

 .
 max
 (
 0
 );

 return

 feature
 .
 set
 ({
 style
 :

 {
 color
 :

 palette
 .
 get
 (
 value
 .
 int
 ())}});
 }
 var

 bws_cat_style

 =

 function
 (
 f
 )

 {

 return

 setColor
 (
 f
 ,

 'opt80_ws_x_c'
 ,

 -
 1
 ,

 4
 ,

 reds
 );
 };
 var

 waterLand

 =

 ee
 .
 Image
 (
 'NOAA/NGDC/ETOPO1'
 ).
 select
 (
 'bedrock'
 ).
 gt
 (
 0.0
 );
 var

 waterLandBackground

 =

 waterLand
 .
 visualize
 ({
 palette
 :

 [
 'cadetblue'
 ,

 'lightgray'
 ]});
 Map
 .
 addLayer
 (
 waterLandBackground
 );
 // Projected Baseline water stress by 2080 in optimistic scenario
 var

 polygons

 =

 dataset
 .
 filter
 (
 'opt80_ws_x_c > -2'
 ).
 map
 (
 bws_cat_style
 );
 Map
 .
 setCenter
 (
 10
 ,

 20
 ,

 4
 );
 Map
 .
 addLayer
 (
 polygons
 .
 style
 ({
 styleProperty
 :

 'style'
 ,

 pointSize
 :

 3
 }));
Visualize as a FeatureView
A FeatureView
is a view-only, accelerated representation of a FeatureCollection
. For more details, visit the FeatureView
documentation.
Code Editor (JavaScript)
 var

 fvLayer

 =

 ui
 .
 Map
 .
 FeatureViewLayer
 (

 'WRI/Aqueduct_Water_Risk/V4/future_annual_FeatureView'
 );
 var

 visParams

 =

 {

 isVisible
 :

 false
 ,

 pointSize
 :

 20
 ,

 rules
 :

 [{

 // Projected baseline water stress with low category by 2080

 filter
 :

 ee
 .
 Filter
 .
 eq
 (
 'opt80_ws_x_c'
 ,

 -
 1
 ),

 isVisible
 :

 true
 ,

 pointFillColor
 :

 {

 property
 :

 'opt80_ws_x_c'
 ,

 mode
 :

 'linear'
 ,

 palette
 :

 [
 'f1eef6'
 ,

 'd7b5d8'
 ,

 'df65b0'
 ,

 'ce1256'
 ],

 min
 :

 -
 1
 ,

 max
 :

 100

 }

 }]
 };
 fvLayer
 .
 setVisParams
 (
 visParams
 );
 fvLayer
 .
 setName
 (
 'Projected Low Water Stress by 2080'
 );
 Map
 .
 setCenter
 (
 -
 10
 ,

 25
 ,

 5
 );
 Map
 .
 add
 (
 fvLayer
 );