
Page Summary
-
Google Charts and Google Spreadsheets are integrated, allowing you to embed charts in spreadsheets or use spreadsheets as data sources for charts.
-
Charts created using data from Google Spreadsheets will automatically update when the spreadsheet data changes.
-
You can embed a chart directly within a Google Spreadsheet using the "Insert" > "Chart" menu option.
-
To create a chart from a separate spreadsheet, you use the Google Charts query language to retrieve the data.
-
Accessing data from private spreadsheets requires authorization, which can be simplified by using the Google Sheets API scope with OAuth 2.0.
This page describes how to use Google Charts with Google Spreadsheets.
Introduction
Google Charts and Google Spreadsheets are tightly integrated. You can place a Google Chart inside a Google Spreadsheet, and Google Charts can extract data out of Google Spreadsheets. This documentation shows you how to do both.
Whichever method you choose, your chart will change whenever the underlying spreadsheet changes.
Embedding a Chart in a Spreadsheet
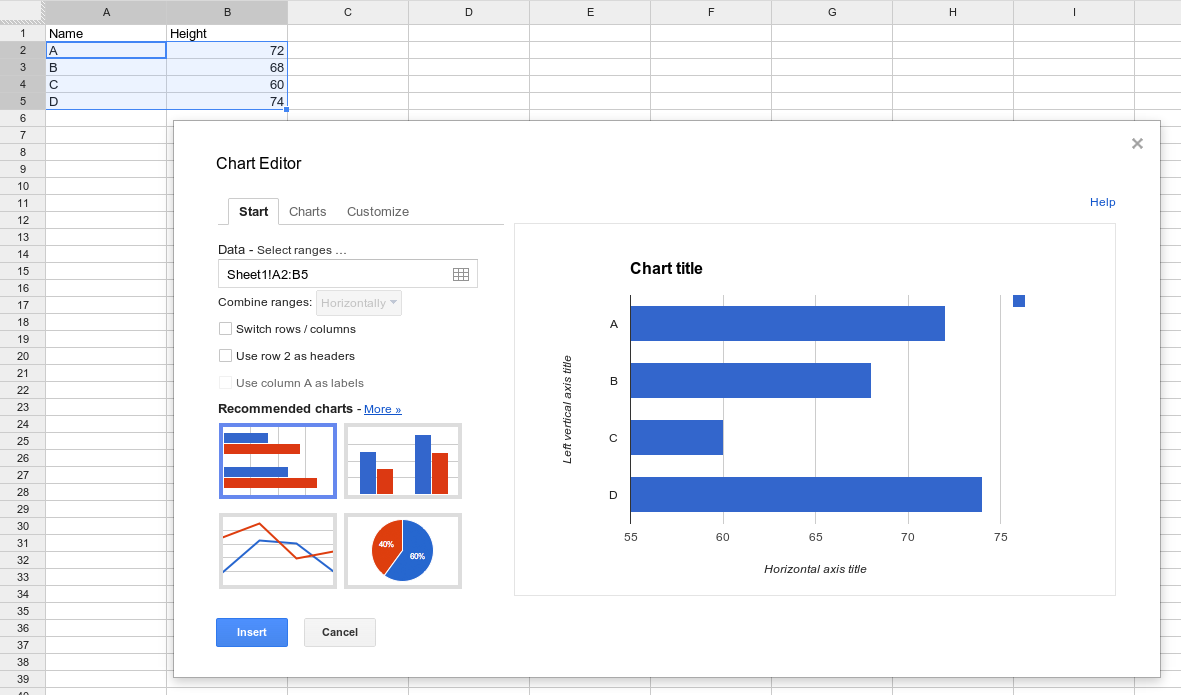
Including a chart in a spreadsheet is easy. From the Spreadsheets toolbar, select "Insert" and then "Chart", and you'll be able to choose the type of chart and select various options:
Creating a Chart from a Separate Spreadsheet
Typically, people create Google Charts by populating a data table and drawing the chart using that data. If you want to retrieve the data from a Google Spreadsheet instead, you'll query the spreadsheet to retrieve the data to be charted:
 function

 drawChart
 ()

 {

  var

 query

 =

 new

 google
 .
 visualization
 .
 Query
 (
 URL
 );


  query
 .
 send
 (
 handleQueryResponse
 );

 }
 function

 handleQueryResponse
 (
 response
 )

 {

  var

 data

 =

 response
 .
 getDataTable
 ();


 var

 chart

 =

 new

 google
 .
 visualization
 .
 ColumnChart
 (
 document
 .
 getElementById
 (
 'columnchart'
 ));

 chart
 .
 draw
 (
 data
 ,

 null
 );
 }
This works because Google Spreadsheets support the Google Charts query language for sorting and filtering data; any system supporting the query language can be used as a data source.
Note that charts cannot use the privileges of the person viewing them without explicit authorization. The spreadsheet must either be visible to everyone or the page must explicitly acquire an end-user credential as documented under the Authorization section of this page.
To use a Google Spreadsheet as a data source, you'll need its URL:
- Open an existing spreadsheet.This spreadsheet should have the format expected by your visualization, and it should have viewing privileges set properly. (View privileges of "Public on the web" or "Anyone with the link" will be easiest, and the instructions in this section assume a spreadsheet that has been set up this way. You can restrict by keeping the spreadsheet "Private" and granting individual Google accounts access, but you will need to follow authorization instructions below).
- Copy the URL from your browser.See Query Source Ranges for details about selecting specific ranges.
- Provide the URL
to
google.visualization.Query().The query supports the following optional parameters:-
headers= N: Specifies how many rows are header rows, where N is an integer zero or greater. These will be excluded from the data and assigned as column labels in the data table. If you don't specify this parameter, the spreadsheet will guess how many rows are header rows. Note that if all your columns are string data, the spreadsheet might have difficulty determining which rows are header rows without this parameter. -
gid= N: Specifies which sheet in a multi-sheet document to link to, if you are not linking to the first sheet. N is the sheet's ID number. You can learn the ID number by navigating to the published version of that sheet and looking for thegid= Nparameter in the URL. You can also use thesheetparameter instead of this parameter. Gotcha: Google Spreadsheets might rearrange the gid parameter in the URL when viewed in a browser; if copying from a browser, be sure that all parameters are beforethe URL's#mark. Example:gid=1545912003. -
sheet= sheet_name: Specifies which sheet in a multi-sheet document you are linking to, if you are not linking to the first sheet. sheet_name is the display name of the sheet. Example:sheet=Sheet5.
-
Here's a complete example:
Below are two ways to draw this chart, one using the gid
parameter and the other
using the sheet
parameter. Entering either URL in the browser will produce the
same result/data for the chart.
 function

 drawGID
 ()

 {

 var

 queryString

 =

 encodeURIComponent
 (
 'SELECT A, H, O, Q, R, U LIMIT 5 OFFSET 8'
 );

 var

 query

 =

 new

 google
 .
 visualization
 .
 Query
 (

 'https://docs.google.com/spreadsheets/d/1XWJLkAwch5GXAt_7zOFDcg8Wm8Xv29_8PWuuW15qmAE/gviz/tq?gid=0&headers=1&tq='

 +

 queryString
 );

 query
 .
 send
 (
 handleQueryResponse
 );

 }

 function

 handleQueryResponse
 (
 response
 )

 {

 if

 (
 response
 .
 isError
 ())

 {

 alert
 (
 'Error in query: '

 +

 response
 .
 getMessage
 ()

 +

 ' '

 +

 response
 .
 getDetailedMessage
 ());

 return
 ;

 }

 var

 data

 =

 response
 .
 getDataTable
 ();

 var

 chart

 =

 new

 google
 .
 visualization
 .
 ColumnChart
 (
 document
 .
 getElementById
 (
 'chart_div'
 ));

 chart
 .
 draw
 (
 data
 ,

 {

 height
 :

 400

 });

 }
 function

 drawSheetName
 ()

 {

 var

 queryString

 =

 encodeURIComponent
 (
 'SELECT A, H, O, Q, R, U LIMIT 5 OFFSET 8'
 );

 var

 query

 =

 new

 google
 .
 visualization
 .
 Query
 (

 'https://docs.google.com/spreadsheets/d/1XWJLkAwch5GXAt_7zOFDcg8Wm8Xv29_8PWuuW15qmAE/gviz/tq?sheet=Sheet1&headers=1&tq='

 +

 queryString
 );

 query
 .
 send
 (
 handleSampleDataQueryResponse
 );

 }

 function

 handleSampleDataQueryResponse
 (
 response
 )

 {

 if

 (
 response
 .
 isError
 ())

 {

 alert
 (
 'Error in query: '

 +

 response
 .
 getMessage
 ()

 +

 ' '

 +

 response
 .
 getDetailedMessage
 ());

 return
 ;

 }

 var

 data

 =

 response
 .
 getDataTable
 ();

 var

 chart

 =

 new

 google
 .
 visualization
 .
 ColumnChart
 (
 document
 .
 getElementById
 (
 'chart_div'
 ));

 chart
 .
 draw
 (
 data
 ,

 {

 height
 :

 400

 });

 }
Query Source Ranges
The query source URL specifies what part of a spreadsheet to use in the query: a specific cell, range of cells, rows, or columns, or a whole spreadsheet. Specify the range using the "range=< range_expr >" syntax, for example:
https://docs.google.com/spreadsheets/d/1XWJLkAwch5GXAt_7zOFDcg8Wm8Xv29_8PWuuW15qmAE/gviz/tq? range=A1:C4
Here are a few examples that demonstrate the syntax:
-
A1:B10- A range from cell A1 through B10 -
5:7- Rows 5-7 -
D:F- Columns D-F -
A:A70- The first 70 cells in column A -
A70:A- Column A from row 70 to the end -
B5:5- B5 to the end of row 5 -
D3:D- D3 to the end of column D -
C:C10- From the beginning of column C to C10
Authorization
Google Sheets requires end-user credentials to access private spreadsheets via the Google Visualization API ("/tq requests").Note:Spreadsheets shared to "anyone who has the link can view" do not require credentials. Changing your spreadsheet's sharing settings is much easier than implementing authorization.
For cases where link sharing is not a viable solution, developers will need to change their code to pass in an OAuth 2.0 credential authorized for the Google Sheets API scope (https://www.googleapis.com/auth/spreadsheets).
More background on OAuth 2.0 is available in Using OAuth 2.0 to Access Google APIs
Example: Using OAuth to access /gviz/tq
Prerequisite: Obtain a Client ID from the Google Developer Console
More detailed instructions for integrating with Google's Identity Platform can be found at Google Sign-In and Creating a Google API Console project and client ID .
In order to acquire OAuth tokens for an end-user, you must first register your project with the Google Developer Console and acquire a Client ID.
- From the developer console, create a new OAuth client ID .
- Choose Web application as your application type.
- Pick any name; it is for your information only.
- Add the name of your domain (and any test domains) as Authorized JavaScript Origins .
- Leave Authorized redirect URIs blank.
After clicking Create, copy the client ID for future reference. The client secret is not needed for this exercise.
Update your site to acquire OAuth credentials.
Google provides the gapi.auth
library which greatly simplifies the process of
acquiring an OAuth credential. The code sample below uses this library to acquire a credential
(requesting authorization if necessary) and passes the resulting credential to
the /gviz/tq endpoint.
< html
 >
< body
 >

< button

 id
 =
 "authorize-button"

 style
 =
 "visibility: hidden"
 >
 Authorize
< /
 button
 >

< script

 src
 =
 "./demo.js"

 type
 =
 "text/javascript"
 ></
 script
 >

< script

 src
 =
 "https://apis.google.com/js/auth.js?onload=init"
 ></
 script
 >
< /
 body
 >
< /
 html
 >
 //

 NOTE
 :

 You

 must

 replace

 the

 client

 id

 on

 the

 following

 line
 .
 var

 clientId

 =

  '549821307845-9ef2xotqflhcqbv10.apps.googleusercontent.com'

 ;
 var

 scopes

 =

 'https://www.googleapis.com/auth/spreadsheets'
 ;
 function

 init
 ()

 {

 gapi
 .
 auth
 .
 authorize
 (

 {
 client_id
 :

 clientId
 ,

 scope
 :

 scopes
 ,

 immediate
 :

 true
 },

 handleAuthResult
 );
 }
 function

 handleAuthResult
 (
 authResult
 )

 {

 var

 authorizeButton

 =

 document
 .
 getElementById
 (
 'authorize-button'
 );

 if

 (
 authResult

 &&

 !
 authResult
 .
 error
 )

 {

 authorizeButton
 .
 style
 .
 visibility

 =

 'hidden'
 ;

 makeApiCall
 ();

 }

 else

 {

 authorizeButton
 .
 style
 .
 visibility

 =

 ''
 ;

 authorizeButton
 .
 onclick

 =

 handleAuthClick
 ;

 }
 }
 function

 handleAuthClick
 (
 event
 )

 {

 gapi
 .
 auth
 .
 authorize
 (

 {
 client_id
 :

 clientId
 ,

 scope
 :

 scopes
 ,

 immediate
 :

 false
 },

 handleAuthResult
 );

 return

 false
 ;
 }
 function

 makeApiCall
 ()

 {

 //

 Note
 :

 The

 below

 spreadsheet

 is

 "Public on the web"

 and

 will

 work

 //

 with

 or

 without

 an

 OAuth

 token
 .

 For

 a

 better

 test
 ,

 replace

 this

 //

 URL

 with

 a

 private

 spreadsheet
 .

 var

 tqUrl

 =

 'https://docs.google.com/spreadsheets'

 +

 '/d/1XWJLkAwch5GXAt_7zOFDcg8Wm8Xv29_8PWuuW15qmAE/gviz/tq'

 +

 '?tqx=responseHandler:handleTqResponse'

 +

 '&access_token='

 +

 encodeURIComponent
 (
 gapi
 .
 auth
 .
 getToken
 ()
 .
 access_token
 );

 document
 .
 write
 (
 '<script src="'

 +

 tqUrl

 +
 '" type="text/javascript"></script>'
 );
 }
 function

 handleTqResponse
 (
 resp
 )

 {

 document
 .
 write
 (
 JSON
 .
 stringify
 (
 resp
 ));
 }
Once authorization is successful, gapi.auth.getToken()
will return all of the
credential details, including the access_token
that can be appended
to /gviz/tq requests.
For more information on using the gapi library for authentication, see:
- Authentication using the Google APIs Client Library for JavaScript
- How to use CORS to access Google APIs
Using the drive.file scope
The previous example uses the Google Sheets API scope, which grants read and write access to all of a user's spreadsheet content. Depending upon the application, this may be more permissive than necessary. For read-only access, use the spreadsheets.readonly scope which grants read-only access to the user's sheets and their properties.
The drive.file scope (https://www.googleapis.com/auth/drive.file) grants access to only those files that the user explicitly opens with the Google Drive file picker, launched via the Picker API .
Using the Picker changes the flow of your application. Instead of pasting in a URL or having a
hard-coded spreadsheet as in the example above, the user must use the Picker dialog to choose
which spreadsheet they would like your page to access. Follow
the Picker "Hello World" example
, using google.picker.ViewId.SPREADSHEETS
in place of google.picker.ViewId.PHOTOS
.