
Page Summary
-
The dataset is a 10m global industrial and smallholder oil palm map for 2019, covering areas where oil palm plantations were detected.
-
The classified images were created using a convolutional neural network based on Sentinel-1 and Sentinel-2 half-year composites.
-
The dataset includes a classification band with descriptions for Industrial closed-canopy oil palm, Smallholder closed-canopy oil palm, and other land covers.
-
The dataset is available from 2019-01-01 to 2019-12-31 and is provided by the Biopama programme.
- Dataset Availability
- 2019-01-01T00:00:00Z–2019-12-31T00:00:00Z
- Dataset Producer
- Biopama programme
- Tags
Description
The dataset is a 10m global industrial and smallholder oil palm map for 2019. It covers areas where oil palm plantations were detected. The classified images are the output of a convolutional neural network based on Sentinel-1 and Sentinel-2 half-year composites.
See article for additional information.
Bands
Bands
Pixel size: 10 meters (all bands)
| Name | Pixel Size | Description |
|---|---|---|
classification
|
10 meters | Oil Palm class description |
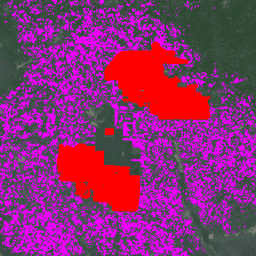
classification Class Table
| Value | Color | Description |
|---|---|---|
|
1
|
#ff0000 | Industrial closed-canopy oil palm plantations |
|
2
|
#ef00ff | Smallholder closed-canopy oil palm plantations |
|
3
|
#696969 | Other land covers and/or uses that are not closed-canopy oil palm. |
Terms of Use
Terms of Use
Citations
-
Adrià, D., Serge, W., Erik, M., David, G., Stephen, P., & Zoltan, S. (2021). High resolution global industrial and smallholder oil palm map for 2019 (Version v1) [Data set]. Zenodo. doi:10.5281/zenodo.4473715
DOIs
Explore with Earth Engine
Code Editor (JavaScript)
 // Import the dataset; a collection of composite granules from 2019.
 var

 dataset

 =

 ee
 .
 ImageCollection
 (
 'BIOPAMA/GlobalOilPalm/v1'
 );
 // Select the classification band.
 var

 opClass

 =

 dataset
 .
 select
 (
 'classification'
 );
 // Mosaic all of the granules into a single image.
 var

 mosaic

 =

 opClass
 .
 mosaic
 ();
 // Define visualization parameters.
 var

 classificationVis

 =

 {

 min
 :

 1
 ,

 max
 :

 3
 ,

 palette
 :

 [
 'ff0000'
 ,
 'ef00ff'
 ,

 '696969'
 ]
 };
 // Create a mask to add transparency to non-oil palm plantation class pixels.
 var

 mask

 =

 mosaic
 .
 neq
 (
 3
 );
 mask

 =

 mask
 .
 where
 (
 mask
 .
 eq
 (
 0
 ),

 0.6
 );
 // Display the data on the map.
 Map
 .
 addLayer
 (
 mosaic
 .
 updateMask
 (
 mask
 ),

 classificationVis
 ,

 'Oil palm plantation type'
 ,

 true
 );
 Map
 .
 setCenter
 (
 -
 3.0175
 ,

 5.2745
 ,
 12
 );
 import

 ee
 import

 geemap.core

 as

 geemap
Colab (Python)
 # Import the dataset a collection of composite granules from 2019.
 dataset
 =
 ee
 .
 ImageCollection
 (
 'BIOPAMA/GlobalOilPalm/v1'
 )
 # Select the classification band.
 op_class
 =
 dataset
 .
 select
 (
 'classification'
 )
 # Mosaic all of the granules into a single image.
 mosaic
 =
 op_class
 .
 mosaic
 ()
 # Define visualization parameters.
 classification_vis
 =
 {
 'min'
 :
 1
 ,
 'max'
 :
 3
 ,
 'palette'
 :
 [
 'ff0000'
 ,
 'ef00ff'
 ,
 '696969'
 ],
 }
 # Create a mask to add transparency to non-oil palm plantation class pixels.
 mask
 =
 mosaic
 .
 neq
 (
 3
 )
 mask
 =
 mask
 .
 where
 (
 mask
 .
 eq
 (
 0
 ),
 0.6
 )
 # Display the data on the map.
 m
 =
 geemap
 .
 Map
 ()
 m
 .
 add_layer
 (
 mosaic
 .
 updateMask
 (
 mask
 ),
 classification_vis
 ,
 'Oil palm plantation type'
 ,
 True
 ,
 )
 m
 .
 set_center
 (
 -
 3.0175
 ,
 5.2745
 ,
 12
 )
 m