
AI-generated Key Takeaways
-
The dataset provides Penman-Monteith-Leuning Evapotranspiration V2 (PML_V2) products, including evapotranspiration (ET), its three components, and gross primary production (GPP).
-
The data is available at 500m and 8-day resolution from 2000 to 2023, covering a spatial range from -60°S to 90°N.
-
PML_V2 products offer coupled estimates of transpiration and GPP and partition ET into vegetation transpiration, soil evaporation, and interception from vegetation.
-
The dataset performs well against observations and is comparable to or better than other widely used ET and GPP products.
-
Version 0.1.8 includes updated temporal coverage, uses MODIS Terra LAI, and has recalibrated parameters.
- Dataset Availability
- 2000-02-26T00:00:00Z–2023-12-27T00:00:00Z
- Dataset Provider
- PML_V2
- Cadence
- 8 Days
- Tags
Description
Penman-Monteith-Leuning Evapotranspiration V2 (PML_V2) products include evapotranspiration (ET), its three components, and gross primary production (GPP) at 500m and 8-day resolution during 2000-2023 and with spatial range from -60°S to 90°N. The major advantages of the PML_V2 products are:
- Coupled estimates of transpiration and GPP via canopy conductance (Gan et al., 2018; Zhang et al., 2019)
- Partitioning ET into three components: transpiration from vegetation, direct evaporation from the soil, and vaporization of intercepted rainfall from vegetation (Zhang et al., 2016).
The PML_V2 products perform well against observations at 95 flux sites across the globe, and are similar to or noticeably better than major state-of-the-art ET and GPP products widely used by water and ecology research communities (Zhang et al., 2019).
Key changes in v0.1.8 compared with the original v0.1.4:
- Temporal coverage is lengthened to the latest (may update annually) with the MODIS C6.1 data.
- MODIS Terra LAI (MOD15A2H) is used rather than the composite LAI (MCD15A3H).
- Parameters are recalibrated with the change in LAI, while other forcings remain the same.
Bands
Pixel Size 500 meters
Bands
| Name | Units | Min | Max | Pixel Size | Description |
|---|---|---|---|---|---|
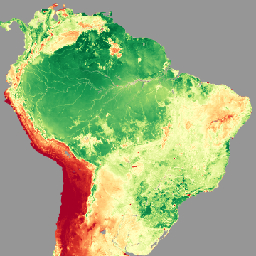
GPP
|
gC m-2 d-1 | 0* | 39.01* | meters | Gross primary production |
Ec
|
mm/d | 0* | 15.33* | meters | Vegetation transpiration |
Es
|
mm/d | 0* | 8.2* | meters | Soil evaporation |
Ei
|
mm/d | 0* | 12.56* | meters | Interception from vegetation canopy |
ET_water
|
mm/d | 0* | 20.11* | meters | Evaporation from water bodies, snow, and ice. Calculated using the Penman equation, which is considered a good estimate of actual evaporation for these surfaces. |
Terms of Use
Terms of Use
Acknowledgements
Whenever PML datasets are used in a scientific publication, the given references should be cited.
License
The dataset is licensed under the CC-BY 4.0 license .
Citations
-
Zhang, Y., Kong, D., Gan, R., Chiew, F.H.S., McVicar, T.R., Zhang, Q., and Yang, Y., 2019. Coupled estimation of 500m and 8-day resolution global evapotranspiration and gross primary production in 2002-2017. Remote Sens. Environ. 222, 165-182, doi:10.1016/j.rse.2018.12.031
-
Gan, R., Zhang, Y.Q., Shi, H., Yang, Y.T., Eamus, D., Cheng, L., Chiew, F.H.S., Yu, Q., 2018. Use of satellite leaf area index estimating evapotranspiration and gross assimilation for Australian ecosystems. Ecohydrology, doi:10.1002/eco.1974
-
Zhang, Y., Peña-Arancibia, J.L., McVicar, T.R., Chiew, F.H.S., Vaze, J., Liu, C., Lu, X., Zheng, H., Wang, Y., Liu, Y.Y., Miralles, D.G., Pan, M., 2016. Multi-decadal trends in global terrestrial evapotranspiration and its components. Sci. Rep. 6, 19124. doi:10.1038/srep19124
DOIs
Explore with Earth Engine
Code Editor (JavaScript)
 var

 dataset

 =

 ee
 .
 ImageCollection
 (
 'CAS/IGSNRR/PML/V2_v018'
 );
 var

 visualization

 =

 {

 bands
 :

 [
 'GPP'
 ],

 min
 :

 0.0
 ,

 max
 :

 9.0
 ,

 palette
 :

 [

 'a50026'
 ,

 'd73027'
 ,

 'f46d43'
 ,

 'fdae61'
 ,

 'fee08b'
 ,

 'ffffbf'
 ,

 'd9ef8b'
 ,

 'a6d96a'
 ,

 '66bd63'
 ,

 '1a9850'
 ,

 '006837'
 ,

 ]
 };
 Map
 .
 setCenter
 (
 0.0
 ,

 15.0
 ,

 2
 );
 Map
 .
 addLayer
 (

 dataset
 .
 first
 (),

 visualization
 ,

 'PML_V2 0.1.8 Gross Primary Product (GPP)'
 );