
AI-generated Key Takeaways
-
The MYD11A1 V6.1 product provides daily land surface temperature and emissivity values in a 1200 x 1200 kilometer grid.
-
This dataset is available from July 4, 2002, to October 13, 2025, with a daily cadence.
-
The dataset includes bands for both daytime and nighttime land surface temperature and their quality indicators, as well as emissivity bands and clear-sky coverage information.
-
MODIS data acquired through the LP DAAC have no restrictions on subsequent use, sale, or redistribution.
- Dataset Availability
- 2002-07-04T00:00:00Z–2025-11-14T00:00:00Z
- Dataset Provider
- NASA LP DAAC at the USGS EROS Center
- Cadence
- 1 Day
- Tags
Description
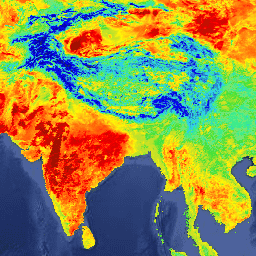
The MYD11A1 V6.1 product provides daily land surface temperature (LST) and emissivity values in a 1200 x 1200 kilometer grid. The temperature value is derived from the MYD11_L2 swath product. Above 30 degrees latitude, some pixels may have multiple observations where the criteria for clear-sky are met. When this occurs, the pixel value is the average of all qualifying observations. Provided along with both the day-time and night-time surface temperature bands and their quality indicator layers are MODIS bands 31 and 32 and six observation layers.
Documentation:
Bands
Pixel Size 1000 meters
Bands
LST_Day_1km
Daytime Land Surface Temperature
QC_Day
Daytime LST Quality Indicators
Day_view_time
Local time of day observation
Day_view_angle
View zenith angle of day observation
LST_Night_1km
Nighttime Land Surface Temperature
QC_Night
Nighttime LST Quality indicators
Night_view_time
Local time of night observation
Night_view_angle
View zenith angle of night observation
Emis_31
Band 31 emissivity
Emis_32
Band 32 emissivity
Clear_day_cov
Day clear-sky coverage
Clear_night_cov
Night clear-sky coverage
Terms of Use
Terms of Use
MODIS data and products acquired through the LP DAAC have no restrictions on subsequent use, sale, or redistribution.
Citations
-
Please visit LP DAAC 'Citing Our Data' page for information on citing LP DAAC datasets.
DOIs
Explore with Earth Engine
Code Editor (JavaScript)
 var

 dataset

 =

 ee
 .
 ImageCollection
 (
 'MODIS/061/MYD11A1'
 )

 .
 filter
 (
 ee
 .
 Filter
 .
 date
 (
 '2018-01-01'
 ,

 '2018-05-01'
 ));
 var

 landSurfaceTemperature

 =

 dataset
 .
 select
 (
 'LST_Day_1km'
 );
 var

 landSurfaceTemperatureVis

 =

 {

 min
 :

 13000.0
 ,

 max
 :

 16500.0
 ,

 palette
 :

 [

 '040274'
 ,

 '040281'
 ,

 '0502a3'
 ,

 '0502b8'
 ,

 '0502ce'
 ,

 '0502e6'
 ,

 '0602ff'
 ,

 '235cb1'
 ,

 '307ef3'
 ,

 '269db1'
 ,

 '30c8e2'
 ,

 '32d3ef'
 ,

 '3be285'
 ,

 '3ff38f'
 ,

 '86e26f'
 ,

 '3ae237'
 ,

 'b5e22e'
 ,

 'd6e21f'
 ,

 'fff705'
 ,

 'ffd611'
 ,

 'ffb613'
 ,

 'ff8b13'
 ,

 'ff6e08'
 ,

 'ff500d'
 ,

 'ff0000'
 ,

 'de0101'
 ,

 'c21301'
 ,

 'a71001'
 ,

 '911003'

 ],
 };
 Map
 .
 setCenter
 (
 6.746
 ,

 46.529
 ,

 2
 );
 Map
 .
 addLayer
 (

 landSurfaceTemperature
 ,

 landSurfaceTemperatureVis
 ,

 'Land Surface Temperature'
 );