
Page Summary
-
The Harmonized Landsat Sentinel-2 (HLS) project provides consistent surface reflectance and top of atmosphere brightness data from Landsat 8/9 and Sentinel-2 A/B satellites.
-
This dataset offers global observations of the land every 2 to 3 days at 30m spatial resolution.
-
The HLSL30 product specifically provides 30m Nadir Bidirectional Reflectance Distribution Function (BRDF), Adjusted Reflectance (NBAR) from Landsat 8/9.
-
Data is available from April 11, 2013, to October 15, 2025, and is provided by NASA LP DAAC.
- Dataset Availability
- 2013-04-11T00:00:00Z–2026-06-10T23:57:11Z
- Dataset Producer
- NASA LP DAAC
- Tags
Description
The Harmonized Landsat Sentinel-2 (HLS) project provides consistent surface reflectance (SR) and top of atmosphere (TOA) brightness data from a virtual constellation of satellite sensors. The Operational Land Imager (OLI) is housed aboard the joint NASA/USGS Landsat 8 and Landsat 9 satellites, while the Multi-Spectral Instrument (MSI) is mounted aboard Europe's Copernicus Sentinel-2A and Sentinel-2B satellites. The combined measurement enables global observations of the land every 2 to 3 days at 30m spatial resolution. The HLS project uses a set of algorithms to obtain seamless products from OLI and MSI that include atmospheric correction, cloud and cloud-shadow masking, spatial co-registration and common gridding, illumination and view angle normalization, and spectral bandpass adjustment.
The HLS project distributes data as two separate products: HLSL30 (Landsat 8/9) and HLSS30 (Sentinel-2 A/B). They both provide 30m Nadir Bidirectional Reflectance Distribution Function (BRDF), Adjusted Reflectance (NBAR).
Documentation:
Bands
Bands
Pixel size: 30 meters (all bands)
B1
Coastal Aerosol
B2
Blue
B3
Green
B4
Red
B5
NIR
B6
SWIR1
B7
SWIR2
B9
Cirrus
B10
TIRS1
B11
TIRS2
Fmask
Quality Bits
SZA
Sun Zenith Angle
SAA
Sun Azimuth Angle
VZA
View Zenith Angle
VAA
View Azimuth Angle
Image Properties
Image Properties
| Name | Type | Description |
|---|---|---|
|
ACCODE
|
STRING | LaSRC version, e.g. LaSRCS2AV3.5.5 or LaSRCL8V3.5.5 |
|
LANDSAT_PRODUCT_ID
|
STRING | The Landsat-8 input L1 scene product ID for processing backtracing. |
|
TIRS_SSM_MODEL
|
STRING | TIRS SSM encoder position model (Preliminary, Final or Actual). |
|
TIRS_SSM_POSITION_STATUS
|
STRING | L30 |
|
USGS_SOFTWARE
|
STRING | LPGS_2.6.2 |
|
CLOUD_COVERAGE
|
DOUBLE | The percentage of cloud and cloud shadow in observation based on Fmask |
|
HLS_PROCESSING_TIME
|
STRING | The date and time of HLS processing for this observation |
|
MEAN_SUN_AZIMUTH_ANGLE
|
DOUBLE | Mean Sun Azimuth Angle in degree of the input data for HLS L30 |
|
MEAN_SUN_ZENITH_ANGLE
|
DOUBLE | Mean Sun Zenith Angle in degree of the input data for HLS L30 |
|
MEAN_VIEW_AZIMUTH_ANGLE
|
DOUBLE | Mean View Azimuth Angle in degree of the input data |
|
MEAN_VIEW_ZENITH_ANGLE
|
DOUBLE | Mean View Zenith Angle in degree of the input data |
|
NBAR_SOLAR_ZENITH
|
DOUBLE | The solar zenith angle used in NBAR derivation |
|
SPATIAL_COVERAGE
|
DOUBLE | The percentage of the tile with data |
Terms of Use
Terms of Use
NASA promotes the full and open sharing of all data with research and applications communities, private industry, academia, and the general public.
Citations
-
Masek, J., Ju, J., Roger, J., Skakun, S., Vermote, E., Claverie, M., Dungan, J., Yin, Z., Freitag, B., Justice, C. (2021). HLS Operational Land Imager Surface Reflectance and TOA Brightness Daily Global 30m v2.0 [Data set]. NASA EOSDIS Land Processes Distributed Active Archive Center. Accessed 2023-09-12 from https://doi.org/10.5067/HLS/HLSL30.002
DOIs
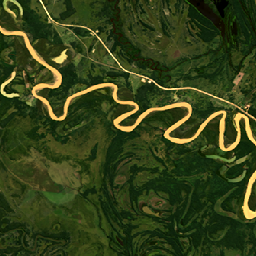
Explore with Earth Engine
Code Editor (JavaScript)
 var

 collection

 =

 ee
 .
 ImageCollection
 (
 "NASA/HLS/HLSL30/v002"
 )

 .
 filter
 (
 ee
 .
 Filter
 .
 date
 (
 '2013-04-25'
 ,

 '2013-04-28'
 ))

 .
 filter
 (
 ee
 .
 Filter
 .
 lt
 (
 'CLOUD_COVERAGE'
 ,

 30
 ));
 var

 visParams

 =

 {

 bands
 :

 [
 'B4'
 ,

 'B3'
 ,

 'B2'
 ],

 min
 :
 0.01
 ,

 max
 :
 0.18
 ,
 };
 var

 visualizeImage

 =

 function
 (
 image
 )

 {

 var

 imageRGB

 =

 image
 .
 visualize
 (
 visParams
 );

 return

 imageRGB
 ;
 };
 var

 rgbCollection

 =

 collection
 .
 map
 (
 visualizeImage
 );
 Map
 .
 setCenter
 (
 -
 60.1765
 ,

 -
 22.5318
 ,

 11
 )
 Map
 .
 addLayer
 (
 rgbCollection
 ,

 {},

 'HLS RGB bands'
 );