
AI-generated Key Takeaways
-
The Suomi NPP VIIRS Land Cover Dynamics product provides global land surface phenology metrics yearly at 500m spatial resolution.
-
The product is derived from time series of the two-band Enhanced Vegetation Index (EVI2) calculated from VIIRS Nadir Bidirectional Reflectance Distribution Function (BRDF)-Adjusted Reflectance (NBAR).
-
The dataset includes six phenological transition dates, growing season length, greenness-related metrics, and confidence of phenology detection.
-
The data is available from 2013-01-01T00:00:00Z to 2022-01-01T00:00:00Z with an 8-day cadence.
- Dataset Availability
- 2013-01-01T00:00:00Z–2022-01-01T00:00:00Z
- Dataset Provider
- NASA LP DAAC at the USGS EROS Center
- Cadence
- 8 Days
- Tags
Description
The Suomi National Polar-Orbiting Partnership (Suomi NPP) NASA Visible Infrared Imaging Radiometer Suite (VIIRS) Land Cover Dynamics data product provides global land surface phenology (GLSP) metrics at yearly intervals. The VNP22Q2 data product is derived from time series of the two-band Enhanced Vegetation Index (EVI2) calculated from VIIRS Nadir Bidirectional Reflectance Distribution Function (BRDF)-Adjusted Reflectance (NBAR). Vegetation phenology metrics at 500 meter spatial resolution are identified for up to two detected growing cycles per year.
The product contains six phenological transition dates: onset of greenness increase, onset of greenness maximum, onset of greenness decrease, onset of greenness minimum, dates of mid-greenup, and senescence phases. The product also includes the growing season length. The greenness-related metrics consist of EVI2 onset of greenness increase, EVI2 onset of greenness maximum, EVI2 growing season, rate of greenness increase, and rate of greenness decrease. The confidence of phenology detection is provided as greenness agreement growing season, proportion of good quality (PGQ) growing season, PGQ onset greenness increase, PGQ onset greenness maximum, PGQ onset greenness decrease, and PGQ onset greenness minimum. The final layer is quality control specifying the overall quality of the product.
Documentation:
Bands
Pixel Size 500 meters
Bands
Date_Mid_Greenup_Phase_1
Date at a mid-greenup phase
Date_Mid_Senescence_Phase_1
Date at a mid-senescence phase
EVI2_Growing_Season_Area_1
Integrated EVI2 during a growing season
EVI2_Onset_Greenness_Increase_1
EVI2 value at greenup onset
EVI2_Onset_Greenness_Maximum_1
EVI2 value at maturity onset
GLSP_QC_1
Global Land Surface Phenology Quality Control
Greenness_Agreement_Growing_Season_1
EVI2 agreement between modeled values and raw observations
Growing_Season_Length_1
Growing Season Length
Onset_Greenness_Decrease_1
Date at which canopy greenness begins to decrease
Onset_Greenness_Increase_1
Date of onset of greenness increase
Onset_Greenness_Maximum_1
Date at which canopy greenness approaches its seasonal maximum
Onset_Greenness_Minimum_1
Date at which canopy greenness reaches a minimum
PGQ_Growing_Season_1
Proportion of good quality of VIIRS observations during a vegetation growing season
PGQ_Onset_Greenness_Decrease_1
Proportion of good quality around senescence onset
PGQ_Onset_Greenness_Increase_1
Proportion of good quality around greenup onset
PGQ_Onset_Greenness_Maximum_1
Proportion of good quality around maturity onset
PGQ_Onset_Greenness_Minimum_1
Proportion of good quality around dormancy onset
Rate_Greenness_Decrease_1
Rates of change in EVI2 values during a senescence phase
Rate_Greenness_Increase_1
Rates of change in EVI2 values during a greenup phase
Date_Mid_Greenup_Phase_2
Date at a mid-greenup phase
Date_Mid_Senescence_Phase_2
Date at a mid-senescence phase
EVI2_Growing_Season_Area_2
Integrated EVI2 during a growing season
EVI2_Onset_Greenness_Increase_2
EVI2 value at greenup onset
EVI2_Onset_Greenness_Maximum_2
EVI2 value at maturity onset
GLSP_QC_2
Global Land Surface Phenology Quality Control
Greenness_Agreement_Growing_Season_2
EVI2 agreement between modeled values and raw observations
Growing_Season_Length_2
Growing Season Length
Onset_Greenness_Decrease_2
Date at which canopy greenness begins to decrease
Onset_Greenness_Increase_2
Date of onset of greenness increase
Onset_Greenness_Maximum_2
Date at which canopy greenness approaches its seasonal maximum
Onset_Greenness_Minimum_2
Date at which canopy greenness reaches a minimum
PGQ_Growing_Season_2
Proportion of good quality of VIIRS observations during a vegetation growing season
PGQ_Onset_Greenness_Decrease_2
Proportion of good quality around senescence onset
PGQ_Onset_Greenness_Increase_2
Proportion of good quality around greenup onset
PGQ_Onset_Greenness_Maximum_2
Proportion of good quality around maturity onset
PGQ_Onset_Greenness_Minimum_2
Proportion of good quality around dormancy onset
Rate_Greenness_Decrease_2
Rates of change in EVI2 values during a senescence phase
Rate_Greenness_Increase_2
Rates of change in EVI2 values during a greenup phase
Terms of Use
Terms of Use
LP DAAC NASA data are freely accessible; however, when an author publishes these data or works based on the data, it is requested that the author cite the datasets within the text of the publication and include a reference to them in the reference list.
Citations
-
Please visit LP DAAC 'Citing Our Data' page for information on citing LP DAAC datasets.
DOIs
Explore with Earth Engine
Code Editor (JavaScript)
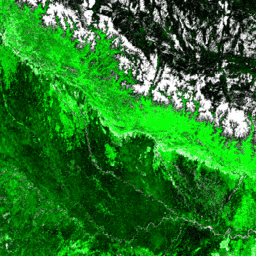
 var

 dataset

 =

 ee
 .
 ImageCollection
 (
 'NOAA/VIIRS/001/VNP22Q2'
 )

 .
 filter
 (
 ee
 .
 Filter
 .
 date
 (
 '2017-01-01'
 ,

 '2017-12-31'
 ));
 var

 rgb

 =

 dataset
 .
 select
 ([

 'EVI2_Growing_Season_Area_1'
 ,

 'PGQ_Growing_Season_1'
 ,

 'Greenness_Agreement_Growing_Season_1'
 ]);
 var

 rgbVis

 =

 {

 min
 :

 [
 0
 ,

 0
 ,

 0
 ],

 max
 :

 [
 75
 ,

 150
 ,

 200
 ],
 };
 Map
 .
 setCenter
 (
 17.93
 ,

 7.71
 ,

 4
 );
 Map
 .
 addLayer
 (
 rgb
 ,

 rgbVis
 ,

 'False color'
 );