
Page Summary
-
The TIGER dataset from the U.S. Census Bureau contains the 2010 census block groups as polygon features covering the United States and associated territories.
-
This dataset includes detailed information such as land and water area, various geographic codes (Block Group, County FIPS, State FIPS, Census Tract), functional status, unique identifiers, and coordinate information.
-
Usage of this data for any resulting products requires citation of the US Census Bureau and is subject to the Census Bureau's API terms of service.
-
The dataset is available for use in Google Earth Engine for research, education, and nonprofit purposes.
- Dataset Availability
- 2010-01-01T00:00:00Z–2010-01-02T00:00:00Z
- Dataset Producer
- United States Census Bureau
- Tags
Description
The United States Census Bureau regularly releases a geodatabase named TIGER. This dataset contains the 2010 census block groups , which is a cluster of blocks within the same census tract that have the same first digit of their four-digit census block number. There are just over 300,000 polygon features covering the United States, the District of Columbia, Puerto Rico, and the Island areas.
For full technical details on all TIGER 2010 products, see the TIGER technical documentation .
Table Schema
Table Schema
| Name | Type | Description |
|---|---|---|
|
ALAND10
|
DOUBLE | Land Area (square meters) |
|
AWATER10
|
DOUBLE | Water Area (square meters) |
|
BLKGRPCE10
|
STRING | Block Group Code |
|
COUNTYFP10
|
STRING | County FIPS Code |
|
FUNCSTAT10
|
STRING | Functional Status (S = Statistical) |
|
GEOID10
|
STRING | Unique Identifier of Summary Level, Characteristic Iteration, US, State, County, Tract, Block Group Code |
|
INTPTLAT10
|
DOUBLE | Internal Point Latitude |
|
INTPTLON10
|
DOUBLE | Internal Point Longitude |
|
MTFCC10
|
STRING | MAF/TIGER Feature Classification Code |
|
NAMELSAD10
|
STRING | Full Name |
|
STATEFP10
|
STRING | State FIPS Code |
|
TRACTCE10
|
STRING | Census Tract Code |
Terms of Use
Terms of Use
The U.S. Census Bureau offers some of its public data in machine-readable format via an Application Programming Interface (API). All of the content, documentation, code and related materials made available to you through the API are subject to these terms and conditions .
Citations
-
For the creation of any reports, publications, new data sets, derived products, or services resulting from the data set, users should cite the US Census Bureau .
Explore with Earth Engine
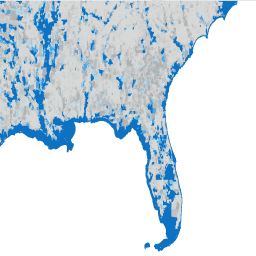
Code Editor (JavaScript)
 var

 dataset

 =

 ee
 .
 FeatureCollection
 (
 'TIGER/2010/BG'
 );
 var

 visParams

 =

 {

 min
 :

 0
 ,

 max
 :

 1e7
 ,

 palette
 :

 [
 'd8d9d9'
 ,

 'aaaaaa'
 ,

 'b6dfe9'
 ,

 '2ea3f2'
 ,

 '0c71c3'
 ]
 };
 // plotting the water area per polygon
 dataset

 =

 dataset
 .
 map
 (
 function

 (
 f
 )

 {

 return

 f
 .
 set
 (
 'AWATER10'
 ,

 ee
 .
 Number
 .
 parse
 (
 f
 .
 get
 (
 'AWATER10'
 )));
 });
 var

 image

 =

 ee
 .
 Image
 ().
 float
 ().
 paint
 (
 dataset
 ,

 'AWATER10'
 );
 Map
 .
 setCenter
 (
 -
 81.99172
 ,

 29.74101
 ,

 9
 );
 Map
 .
 addLayer
 (
 ee
 .
 Image
 (
 1
 ),

 {
 min
 :

 0
 ,

 max
 :

 1
 },

 'background'
 );
 Map
 .
 addLayer
 (
 image
 ,

 visParams
 ,

 'TIGER/2010/BG'
 );
 Map
 .
 addLayer
 (
 dataset
 ,

 null
 ,

 'for Inspector'
 ,

 false
 );