
Page Summary
-
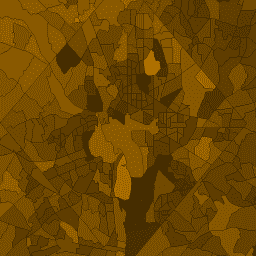
The TIGER geodatabase from the United States Census Bureau contains 2010 census Demographic Profile 1 values aggregated by census tract.
-
There are approximately 74,000 polygon features representing census tracts covering the United States, the District of Columbia, Puerto Rico, and the Island areas.
-
Each tract includes attributes with sums of the DP1 population measurements that intersect the boundary.
-
The dataset is available for use with Earth Engine, a platform for geospatial analysis.
- Dataset Availability
- 2010-01-01T00:00:00Z–2010-01-02T00:00:00Z
- Dataset Producer
- United States Census Bureau
- Tags
Description
The United States Census Bureau regularly releases a geodatabase named TIGER. This table contains the 2010 census Demographic Profile 1 values aggregated by census tract. Tract areas vary tremendously, but in urban areas are roughly equivalent to a neighborhood. There are about 74,000 polygon features covering the United States, the District of Columbia, Puerto Rico, and the Island areas .
For full technical details on all TIGER 2010 products, see the TIGER technical documentation .
Each tract also includes attributes with sums of the DP1 population measurements that intersect the boundary. The columns have the same name as the shortname column in the DP1 lookup table .
Table Schema
Table Schema
| Name | Type | Description |
|---|---|---|
|
aland10
|
DOUBLE | Land area |
|
awater10
|
DOUBLE | Water area |
|
geoid10
|
STRING | Census tract identifier: a concatenation of state FIPS code, county FIPS code, and census tract code |
|
intptlat10
|
STRING | Latitude of the internal point |
|
intptlon10
|
STRING | Longitude of the internal point |
|
namelsad10
|
STRING | Legal/statistical area description and the census tract name |
|
shape_area
|
DOUBLE | Area in square degrees |
|
shape_leng
|
DOUBLE | Perimeter in degrees |
Terms of Use
Terms of Use
The U.S. Census Bureau offers some of its public data in machine-readable format via an Application Programming Interface (API). All of the content, documentation, code and related materials made available to you through the API are subject to these terms and conditions .
Citations
-
For the creation of any reports, publications, new data sets, derived products, or services resulting from the data set, users should cite the US Census Bureau .
Explore with Earth Engine
Code Editor (JavaScript)
 var

 dataset

 =

 ee
 .
 FeatureCollection
 (
 'TIGER/2010/Tracts_DP1'
 );
 var

 visParams

 =

 {

 min
 :

 0
 ,

 max
 :

 4000
 ,

 opacity
 :

 0.8
 ,
 };
 // Turn the strings into numbers
 dataset

 =

 dataset
 .
 map
 (
 function

 (
 f
 )

 {

 return

 f
 .
 set
 (
 'shape_area'
 ,

 ee
 .
 Number
 .
 parse
 (
 f
 .
 get
 (
 'dp0010001'
 )));
 });
 Map
 .
 setCenter
 (
 -
 103.882
 ,

 43.036
 ,

 8
 );
 var

 image

 =

 ee
 .
 Image
 ().
 float
 ().
 paint
 (
 dataset
 ,

 'dp0010001'
 );
 Map
 .
 addLayer
 (
 image
 ,

 visParams
 ,

 'TIGER/2010/Tracts_DP1'
 );
 Map
 .
 addLayer
 (
 dataset
 ,

 null
 ,

 'for Inspector'
 ,

 false
 );
Visualize as a FeatureView
A FeatureView
is a view-only, accelerated representation of a FeatureCollection
. For more details, visit the FeatureView
documentation.
Code Editor (JavaScript)
 var

 fvLayer

 =

 ui
 .
 Map
 .
 FeatureViewLayer
 (
 'TIGER/2010/Tracts_DP1_FeatureView'
 );
 var

 visParams

 =

 {

 opacity
 :

 0.8
 ,

 color
 :

 {

 property
 :

 'dp0010001'
 ,

 mode
 :

 'linear'
 ,

 palette
 :

 [
 'black'
 ,

 'white'
 ],

 min
 :

 0
 ,

 max
 :

 4000

 }
 };
 fvLayer
 .
 setVisParams
 (
 visParams
 );
 fvLayer
 .
 setName
 (
 'US census tracts demographics'
 );
 Map
 .
 setCenter
 (
 -
 103.882
 ,

 43.036
 ,

 8
 );
 Map
 .
 add
 (
 fvLayer
 );