
AI-generated Key Takeaways
-
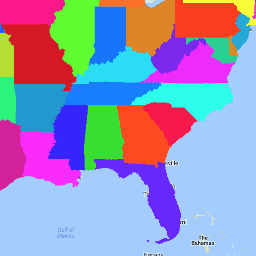
The TIGER 2018 dataset from the U.S. Census Bureau provides boundary data for US states and state equivalents like Puerto Rico and the District of Columbia.
-
Each feature in the dataset represents a single state or state equivalent with attributes like land area, water area, and various identification codes.
-
The dataset is available for the period between January 1, 2018, and January 1, 2019.
-
The terms of use are subject to the U.S. Census Bureau's API terms and conditions, and users should cite the Census Bureau for any resulting work.
- Dataset Availability
- 2018-01-01T00:00:00Z–2019-01-01T00:00:00Z
- Dataset Provider
- United States Census Bureau
- Tags
Description
The United States Census Bureau TIGER dataset contains the 2018 boundaries for the primary governmental divisions of the United States. In addition to the fifty states, the Census Bureau treats the District of Columbia, Puerto Rico, and each of the island areas (American Samoa, the Commonwealth of the Northern Mariana Islands, Guam, and the U.S. Virgin Islands) as the statistical equivalents of States for the purpose of data presentation. Each feature represents a state or state equivalent.
For full technical details on all TIGER 2018 products, see the TIGER technical documentation .
Table Schema
Table Schema
| Name | Type | Description |
|---|---|---|
|
ALAND
|
DOUBLE | Land area |
|
AWATER
|
DOUBLE | Water area |
|
DIVISION
|
STRING | Division code |
|
FUNCSTAT
|
STRING | Functional Status |
|
GEOID
|
STRING | State identifier; state FIPS code |
|
INTPTLAT
|
STRING | Internal point latitude |
|
INTPTLON
|
STRING | Internal point longitude |
|
LSAD
|
STRING | Legal/statistical area description for state |
|
MTFCC
|
STRING | MAF/TIGER feature class code (=G4000) |
|
NAME
|
STRING | State name |
|
REGION
|
STRING | Region code |
|
STATEFP
|
STRING | State FIPS code |
|
STATENS
|
STRING | State GNIS code |
|
STUSPS
|
STRING | US Postal Service state abbreviation |
Terms of Use
Terms of Use
The U.S. Census Bureau offers some of its public data in machine-readable format via an Application Programming Interface (API). All of the content, documentation, code and related materials made available through the API are subject to these terms and conditions .
Citations
-
For the creation of any reports, publications, new data sets, derived products, or services resulting from the data set, users should cite the US Census Bureau .
Explore with Earth Engine
Code Editor (JavaScript)
 var

 dataset

 =

 ee
 .
 FeatureCollection
 (
 'TIGER/2018/States'
 );
 var

 visParams

 =

 {

 palette
 :

 [
 'purple'
 ,

 'blue'
 ,

 'green'
 ,

 'yellow'
 ,

 'orange'
 ,

 'red'
 ],

 min
 :

 500000000.0
 ,

 max
 :

 5e+11
 ,

 opacity
 :

 0.8
 ,
 };
 var

 image

 =

 ee
 .
 Image
 ().
 float
 ().
 paint
 (
 dataset
 ,

 'ALAND'
 );
 Map
 .
 setCenter
 (
 -
 99.844
 ,

 37.649
 ,

 5
 );
 Map
 .
 addLayer
 (
 image
 ,

 visParams
 ,

 'TIGER/2018/States'
 );
 Map
 .
 addLayer
 (
 dataset
 ,

 null
 ,

 'for Inspector'
 ,

 false
 );
Visualize as a FeatureView
A FeatureView
is a view-only, accelerated representation of a FeatureCollection
. For more details, visit the FeatureView
documentation.
Code Editor (JavaScript)
 var

 fvLayer

 =

 ui
 .
 Map
 .
 FeatureViewLayer
 (
 'TIGER/2018/States_FeatureView'
 );
 var

 visParams

 =

 {

 opacity
 :

 0.8
 ,

 color
 :

 {

 property
 :

 'ALAND'
 ,

 mode
 :

 'linear'
 ,

 palette
 :

 [
 'purple'
 ,

 'blue'
 ,

 'green'
 ,

 'yellow'
 ,

 'orange'
 ,

 'red'
 ],

 min
 :

 5e8
 ,

 max
 :

 5e11

 }
 };
 fvLayer
 .
 setVisParams
 (
 visParams
 );
 fvLayer
 .
 setName
 (
 'US census states'
 );
 Map
 .
 setCenter
 (
 -
 99.844
 ,

 37.649
 ,

 5
 );
 Map
 .
 add
 (
 fvLayer
 );