
AI-generated Key Takeaways
-
The TIGER 2020 TRACT dataset from the United States Census Bureau contains polygon features representing the 2020 census tracts for the United States, District of Columbia, Puerto Rico, and Island areas.
-
This dataset, available from 2020-01-01 to 2020-01-02, includes over 85,000 features with attributes such as land and water area, county and state FIPS codes, census tract code, and geographic identifiers.
-
The data is provided under the terms and conditions outlined by the U.S. Census Bureau for their API and requires citation of the Census Bureau for any resulting products.
-
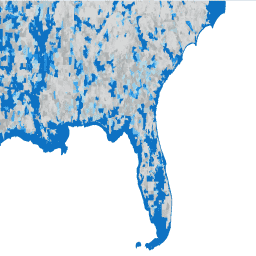
The dataset can be explored and visualized using Google Earth Engine, with code examples provided for plotting water area by census tract.
- Dataset Availability
- 2020-01-01T00:00:00Z–2020-01-02T00:00:00Z
- Dataset Provider
- United States Census Bureau
- Tags
Description
The United States Census Bureau regularly releases a geodatabase named TIGER. This dataset contains the 2020 census tracts. Tract areas vary tremendously, but in urban areas are roughly equivalent to a neighborhood. There are just over 85000 polygon features covering the United States, the District of Columbia, Puerto Rico, and the Island areas .
For full technical details on all TIGER 2020 products, see the TIGER technical documentation .
Table Schema
Table Schema
| Name | Type | Description |
|---|---|---|
|
ALAND
|
DOUBLE | Land Area (square meters) |
|
AWATER
|
DOUBLE | Water Area (square meters) |
|
COUNTYFP
|
STRING | County FIPS Code |
|
FUNCSTAT
|
STRING | Functional Status (S = Statistical) |
|
GEOID
|
STRING | Unique Identifier of Summary Level, Characteristic Iteration, US, State, County, Tract, Block Group Code |
|
INTPTLAT
|
DOUBLE | Internal Point Latitude |
|
INTPTLON
|
DOUBLE | Internal Point Longitude |
|
MTFCC
|
STRING | MAF/TIGER Feature Classification Code |
|
NAME
|
STRING | 2020 Census tract name: this is the census tract code converted to an integer or integer plus 2-character decimal if the last two characters of the code are not both zeros. |
|
NAMELSAD
|
STRING | Full Name |
|
STATEFP
|
STRING | State FIPS Code |
|
TRACTCE
|
STRING | Census Tract Code |
Terms of Use
Terms of Use
The U.S. Census Bureau offers some of its public data in machine-readable format via an Application Programming Interface (API). All of the content, documentation, code and related materials made available to you through the API are subject to these terms and conditions .
Citations
-
For the creation of any reports, publications, new data sets, derived products, or services resulting from the data set, users should cite the US Census Bureau .
Explore with Earth Engine
Code Editor (JavaScript)
 var

 dataset

 =

 ee
 .
 FeatureCollection
 (
 'TIGER/2020/TRACT'
 );
 var

 visParams

 =

 {

 min
 :

 0.0
 ,

 max
 :

 1e7
 ,

 palette
 :

 [
 'd8d9d9'
 ,

 'aaaaaa'
 ,

 'b6dfe9'
 ,

 '2ea3f2'
 ,

 '0c71c3'
 ]
 };
 // plotting the water area per polygon
 dataset

 =

 dataset
 .
 map
 (
 function

 (
 f
 )

 {

 return

 f
 .
 set
 (
 'AWATER'
 ,

 ee
 .
 Number
 .
 parse
 (
 f
 .
 get
 (
 'AWATER'
 )));
 });
 var

 image

 =

 ee
 .
 Image
 ().
 float
 ().
 paint
 (
 dataset
 ,

 'AWATER'
 );
 Map
 .
 setCenter
 (
 -
 81.99172
 ,

 29.74101
 ,

 6
 );
 Map
 .
 addLayer
 (
 ee
 .
 Image
 (
 1
 ),

 {
 min
 :
 0
 ,

 max
 :
 1
 },

 'background'
 );
 Map
 .
 addLayer
 (
 image
 ,

 visParams
 ,

 'TIGER/2020/TRACT'
 );
 Map
 .
 addLayer
 (
 dataset
 ,

 null
 ,

 'for Inspector'
 ,

 false
 );
Visualize as a FeatureView
A FeatureView
is a view-only, accelerated representation of a FeatureCollection
. For more details, visit the FeatureView
documentation.
Code Editor (JavaScript)
 var

 fvLayer

 =

 ui
 .
 Map
 .
 FeatureViewLayer
 (
 'TIGER/2020/TRACT_FeatureView'
 );
 var

 visParams

 =

 {

 opacity
 :

 1
 ,

 color
 :

 {

 property
 :

 'AWATER'
 ,

 mode
 :

 'linear'
 ,

 palette
 :

 [
 'd8d9d9'
 ,

 'aaaaaa'
 ,

 'b6dfe9'
 ,

 '2ea3f2'
 ,

 '0c71c3'
 ],

 min
 :

 0
 ,

 max
 :

 1e7

 }
 };
 fvLayer
 .
 setVisParams
 (
 visParams
 );
 fvLayer
 .
 setName
 (
 'Water area by US census tract'
 );
 Map
 .
 setCenter
 (
 -
 73.15
 ,

 40.9
 ,

 9
 );
 Map
 .
 add
 (
 fvLayer
 );