
Page Summary
-
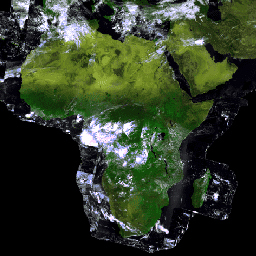
The PROBA-V satellite mission maps land cover and vegetation growth globally on a daily basis.
-
This dataset provides daily synthesis images at 100m resolution, containing VNIR and SWIR spectral bands, along with NDVI and various angle bands.
-
The data is available from October 17, 2013 to October 31, 2021 and requires conversion of Digital Count Numbers according to the user manual.
-
Data older than 1 month is freely available for use.
- Dataset Availability
- 2013-10-17T00:00:00Z–2021-10-31T00:00:00Z
- Dataset Producer
- Vito / ESA
- Cadence
- 1 Day
- Tags
Description
Proba-V is a satellite mission tasked to map land cover and vegetation growth. It was designed to provide continuity for the VGT optical instrument from the SPOT-4 and SPOT-5 missions.
The sensor collects data in three VNIR (visible and near-infrared) bands and one SWIR (short-wave infrared) spectral band with a 2250km field of view. Global images are produced every 2 days at 300m resolution, and a 100m image from nadir observations every 5 days. These images are later composited to produce this daily synthesis dataset. The description of the compositing and atmospheric correction procedures can be found in the user manual .
The reflectances provided in this dataset are presented as Digital Count Numbers (DN) and must be converted according to the guidelines in Section 4.6.1 of the user manual .
Bands
Bands
Pixel size: 100 meters (all bands)
RED
Top of canopy reflectance RED channel
NIR
Top of canopy reflectance NIR channel
BLUE
Top of canopy reflectance BLUE channel
SWIR
Top of canopy reflectance SWIR channel
NDVI
Normalized Difference Vegetation Index
SZA
Solar zenith angle
SAA
Solar azimuth angle
SWIRVAA
Viewing azimuth angles SWIR detector
SWIRVZA
Viewing zenith angle SWIR detector
VNIRVAA
Viewing azimuth angle VNIR detector
VNIRVZA
Viewing zenith angle VNIR detector
SM
Quality / Information band.
TIME
Time elapsed since the start of image collection of this mosaic
Image Properties
Image Properties
| Name | Type | Description |
|---|---|---|
|
ARCHIVING_DATE
|
STRING | Archiving date |
|
CLOUD_COVER_PERCENTAGE
|
DOUBLE | Cloud cover percentage |
|
LAND_PERCENTAGE
|
DOUBLE | Land percentage |
|
MISSING_DATA_PERCENTAGE
|
DOUBLE | Missing data percentage |
|
PROBAV_ATMCORR_SMAC_VERSION
|
STRING | Initial version of the atmospheric correction algorithm |
|
PROBAV_CLOUDICESNOWDETECTION_VERSION
|
STRING | Initial version of the cloud and snow/ice detection algorithm |
|
PROBAV_COMPOSITING_MVC_VERSION
|
STRING | Initial version of the MVC compositing algorithm |
|
PROBAV_GEOMODELLING_VERSION
|
STRING | Initial version of the geometric modelling algorithm |
|
PROBAV_MAPPING_VERSION
|
STRING | Initial version of the projection algorithm |
|
PROBAV_MOSAIC_VERSION
|
STRING | Initial version of the mosaicking algorithm |
|
PROBAV_RADIOMODELLING_VERSION
|
STRING | Initial version of the radiometric modelling algorithm |
|
PROBAV_SHADOWDETECTION_VERSION
|
STRING | Initial version of the shadow detection algorithm |
|
PRODUCT_VERSION
|
STRING | Product version |
|
SNOW_COVER_PERCENTAGE
|
DOUBLE | Snow cover percentage |
Terms of Use
Terms of Use
PROBA-V 300m and 100m data are freely available for data older than 1 month.
Citations
-
Copyright ESA-BELSPO, produced by Vito
Explore with Earth Engine
Code Editor (JavaScript)
 var

 dataset

 =

 ee
 .
 ImageCollection
 (
 'VITO/PROBAV/C1/S1_TOC_100M'
 )

 .
 filter
 (
 ee
 .
 Filter
 .
 date
 (
 '2018-03-01'
 ,

 '2018-04-01'
 ));
 var

 falseColor

 =

 dataset
 .
 select
 ([
 'RED'
 ,

 'NIR'
 ,

 'BLUE'
 ]);
 var

 falseColorVis

 =

 {

 min
 :

 20.0
 ,

 max
 :

 2000.0
 ,
 };
 Map
 .
 setCenter
 (
 17.93
 ,

 7.71
 ,

 2
 );
 Map
 .
 addLayer
 (
 falseColor
 ,

 falseColorVis
 ,

 'False Color'
 );