
Page Summary
-
WorldClim V1 Bioclim provides bioclimatic variables derived from monthly temperature and rainfall data.
-
The dataset includes variables representing annual trends, seasonality, and extreme environmental factors.
-
The data is available for the period of 1960-01-01 to 1991-01-01.
-
The dataset is provided by the University of California, Berkeley and is available under a CC-BY-SA-4.0 license.
-
There are 19 distinct bioclimatic bands with varying units, scales, and descriptions.
- Dataset Availability
- 1960-01-01T00:00:00Z–1991-01-01T00:00:00Z
- Dataset Producer
- University of California, Berkeley
- Tags
Description
WorldClim V1 Bioclim provides bioclimatic variables that are derived from the monthly temperature and rainfall in order to generate more biologically meaningful values.
The bioclimatic variables represent annual trends (e.g., mean annual temperature, annual precipitation), seasonality (e.g., annual range in temperature and precipitation), and extreme or limiting environmental factors (e.g., temperature of the coldest and warmest month, and precipitation of the wet and dry quarters).
The bands scheme follows that of ANUCLIM, except that for temperature seasonality the standard deviation was used because a coefficient of variation does not make sense with temperatures between -1 and 1.
WorldClim version 1 was developed by Robert J. Hijmans, Susan Cameron, and Juan Parra, at the Museum of Vertebrate Zoology, University of California, Berkeley, in collaboration with Peter Jones and Andrew Jarvis (CIAT), and with Karen Richardson (Rainforest CRC).
Bands
Bands
Pixel size: 927.67 meters (all bands)
| Name | Units | Min | Max | Scale | Pixel Size | Description |
|---|---|---|---|---|---|---|
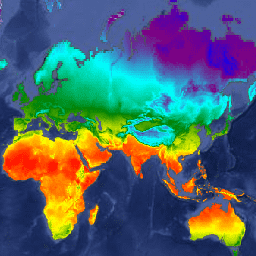
bio01
|
°C | -29* | 32* | 0.1 | 927.67 meters | Annual mean temperature |
bio02
|
°C | 0.9* | 21.4* | 0.1 | 927.67 meters | Mean diurnal range (mean of monthly (max temp - min temp)) |
bio03
|
% | 7* | 96* | 927.67 meters | Isothermality (bio02/bio07 * 100) |
|
bio04
|
°C | 0.62* | 227.21* | 0.01 | 927.67 meters | Temperature seasonality (Standard deviation * 100) |
bio05
|
°C | -9.6* | 49* | 0.1 | 927.67 meters | Max temperature of warmest month |
bio06
|
°C | -57.3* | 25.8* | 0.1 | 927.67 meters | Min temperature of coldest month |
bio07
|
°C | 5.3* | 72.5* | 0.1 | 927.67 meters | Temperature annual range (bio05-bio06) |
bio08
|
°C | -28.5* | 37.8* | 0.1 | 927.67 meters | Mean temperature of wettest quarter |
bio09
|
°C | -52.1* | 36.6* | 0.1 | 927.67 meters | Mean temperature of driest quarter |
bio10
|
°C | -14.3* | 38.3* | 0.1 | 927.67 meters | Mean temperature of warmest quarter |
bio11
|
°C | -52.1* | 28.9* | 0.1 | 927.67 meters | Mean temperature of coldest quarter |
bio12
|
mm | 0* | 11401* | 927.67 meters | Annual precipitation |
|
bio13
|
mm | 0* | 2949* | 927.67 meters | Precipitation of wettest month |
|
bio14
|
mm | 0* | 752* | 927.67 meters | Precipitation of driest month |
|
bio15
|
Coefficient of Variation | 0* | 265* | 927.67 meters | Precipitation seasonality |
|
bio16
|
mm | 0* | 8019* | 927.67 meters | Precipitation of wettest quarter |
|
bio17
|
mm | 0* | 2495* | 927.67 meters | Precipitation of driest quarter |
|
bio18
|
mm | 0* | 6090* | 927.67 meters | Precipitation of warmest quarter |
|
bio19
|
mm | 0* | 5162* | 927.67 meters | Precipitation of coldest quarter |
Terms of Use
Terms of Use
Citations
-
Hijmans, R.J., S.E. Cameron, J.L. Parra, P.G. Jones and A. Jarvis, 2005. Very High Resolution Interpolated Climate Surfaces for Global Land Areas. International Journal of Climatology 25: 1965-1978. doi:10.1002/joc.1276 .
Explore with Earth Engine
Code Editor (JavaScript)
 var

 dataset

 =

 ee
 .
 Image
 (
 'WORLDCLIM/V1/BIO'
 );
 var

 annualMeanTemperature

 =

 dataset
 .
 select
 (
 'bio01'
 ).
 multiply
 (
 0.1
 );
 var

 visParams

 =

 {

 min
 :

 -
 23
 ,

 max
 :

 30
 ,

 palette
 :

 [
 'blue'
 ,

 'purple'
 ,

 'cyan'
 ,

 'green'
 ,

 'yellow'
 ,

 'red'
 ],
 };
 Map
 .
 setCenter
 (
 71.7
 ,

 52.4
 ,

 3
 );
 Map
 .
 addLayer
 (
 annualMeanTemperature
 ,

 visParams
 ,

 'Annual Mean Temperature'
 );