
Page Summary
-
Cloud Monitoring allows you to track metrics for various Google Cloud resources and APIs, visualize them with customizable charts, and create dashboards for comprehensive monitoring.
-
Users can define alerting policies based on metric thresholds to receive notifications about specific conditions and potential issues through email, SMS, or other channels.
-
Google Maps Platform monitoring provides insights into API usage with dedicated metrics for request count, latency, and response codes, allowing for detailed analysis and alerting.
-
You can create custom alerts in Cloud Monitoring to be notified when Google Maps Platform API usage exceeds predefined thresholds or encounters specific error conditions.
-
Comprehensive dashboards and alerting capabilities within Cloud Monitoring enable proactive identification and resolution of performance issues, ensuring optimal application functionality.
Cloud Monitoring collects metrics for your APIs and service and of the Google Cloud resources that you use. This document describes how to configure Cloud Monitoring and how to use it to monitor API usage, create dashboards, and create alerts.
Cloud Monitoring has a large set of features and options. This document introduces Cloud Monitoring and provides basic examples. For information on all the features, including many more examples, see the Cloud Monitoring documentation.
Configure Cloud Monitoring
Monitoring lets you view and manage the metrics:
- For a single project
- For multiple projects within a single organization
- For multiple projects across multiple organizations
To ensure that the metrics for your projects are available, do the following:
- In the Google Cloud console, select Monitoring:
- Ensure that you have selected the correct project.
- In the Monitoring navigation pane, click >to the right
of Metrics Scope.
The following screenshot shows the
page that is displayed when the AllEnvironments project is selected:
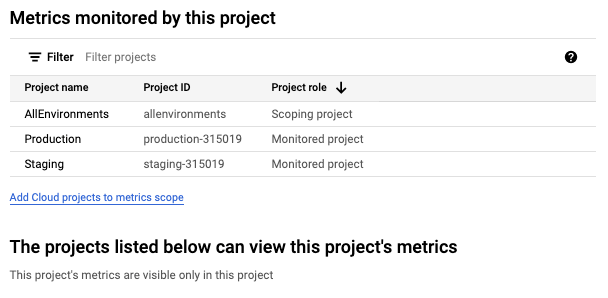
The table labeled Metrics monitored by this projectlists the projects whose metrics are accessible to the current metrics scope. Each row in the table lists a project and that project's role:
- Scoping project: This project stores the uptime checks, alerting policies, groups, and dashboards that you configure. There is a 1:1 relationship between a metrics scope and a scoping project. For this example, the AllEnvironments project is the scoping project.
- Monitored project: The metrics for the project are visible to the current metrics scope. For this example, the Staging and Production projects are monitored projects.
The table labeled The projects listed below can view this project's metricslists the projects whose metrics scope includes the current project. The previous screenshot shows that no other projects can access the metrics stored by the AllEnvironments project.
For more information, including how to add and remove projects, see Configure Cloud Monitoring .
Explore metrics
To explore metric data, build a chart by using the Metrics Explorer which is included with Cloud Monitoring. For example, if you want to view the quota usage of an API, you can use the Metrics Explorer to construct a chart that displays the most recent data.
The following image shows a chart detailing quota usage for Maps APIs:
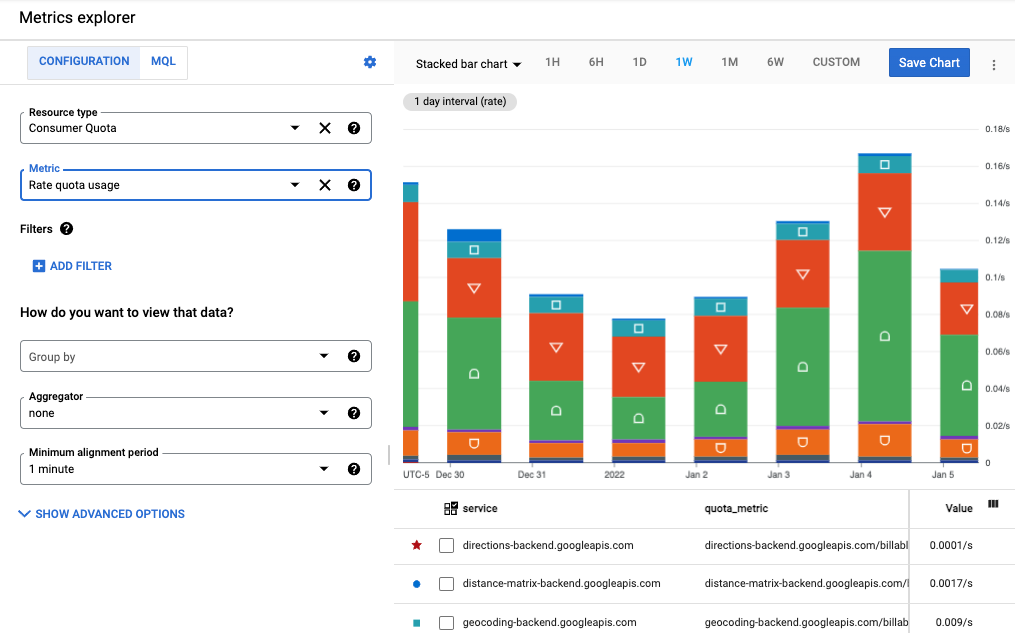
This example shows a stacked bar chart where each API is represented by a section of the bar. You can create different chart types, such as line charts, bar charts, and heat maps. You can also create a single chart that displays up to 10 different metrics.
In this image:
- The Resource Typeand Metricfields to the left of the chart define the metric data displayed in the chart.
- The chart type drop-down above the chart lets you select the chart type. In this example, it is set to Stacked bar chart.
- The time interval above the chart is set to 1W(one week).
- Below the chart is the list of service, quota_metrics, API method, and metric valuethat define the chart's data. Select Add Filterto use this information to refine the displayed data.
When you navigate away from the Metrics Explorer page, the chart is discarded so you don't have any unwanted artifacts to delete. Alternatively, you can save the chart to a custom dashboard, or share it. See Create dashboards below for more information on adding a chart to a dashboard.
Chart a single metric
To configure a chart by using Metrics Explorer, do the following:
- In the Cloud console, select Monitoring:
- In the navigation pane, select Metrics explorer.
- In the toolbar, select Stacked bar chartfrom the chart type drop-down to view the metrics data as a bar chart.
- Select a time interval, such as 1W(one week).
- Specify the data to appear on the chart. To use a menu-driven interface or to enter a filter, select the Configurationtab. To use the Monitoring Query Language (MQL), select the MQLtab.
- To chart quota usage, select Consumer Quotaas the Resource type. Alternatively, if you wanted to create a chart for API usage, select Consumed APIor Google Maps API(see Usage metrics section for more details on usage metrics available for Google Maps Platform APIs). Hover over each resource type to see its description.
- For the metric, select Rate quota usage. The chart automatically updates to display metric data. Notice that there are other quota options for the metric. Hover over each metric to see a description. For more information about Metrics Explorer fields, see Selecting metrics and Choosing how to display charted data .
- (Optional)Use the following options to refine the display:
- To specify a subset of data to display, add filters . To add a filter, select Add filterand complete the dialog. For more information, see Filter charted data . For example, to view data for a single API:
- In the Labelfield select method.
- In the Comparisonfield select = (equals).
- In the Valuefield select the name of a specific method. You will be prompted to select the name of a method with data to display.
- Select Doneto update the chart.
- To group time series by a label, use the Group byfield. Selecting a value for this field automatically selects a value for the Aggregatorfield.
- To specify how to combine time series, set the Aggregatorfield. For example, if the Group byfield is empty and the Aggregatorfield is set to mean, then the chart displays the average of the time series.
- To configure how the individual time series are processed, select Advanced Options. See Selecting metrics when using Metrics Explorer for more information.
-
Optionally add to a dashboard.
When you navigate away from the Metrics Explorerpage, the chart is discarded. You can optionally select Save Chartto save the chart to a new or existing dashboard. See Creating dashboards below for more information on adding a chart to a dashboard.
Chart multiple metrics
In some situations, you might want to display multiple metrics on the same chart. For example, you might want to show the quota limit on the same charts as you show the quota usage. A chart can display a maximum of 10 metrics.
To add a metric to an existing chart, do the following:
- In the existing chart, select Add another metricat the bottom of the screen.
- Select the metric, and then specify how to display the time series for that metric in the same way as you configured the original metric above.
Related resources
For more information on exploring metrics, see:
- Create charts with Metrics Explorer
- Selecting metrics when using Metrics Explorer
- Metrics available to all Google Cloud APIs
- Metrics specific to Google Maps Platform APIs
- Chart distribution metrics
- View options
Create dashboards
Dashboards let you view and monitor your time-series data as a collection of charts. Cloud Monitoring supports predefined dashboards and custom dashboards:
- Predefined dashboardsare automatically installed for the Google Cloud services that you use. These dashboards aren't configurable.
- Custom dashboardsare those dashboards that you create. Custom dashboards let you define the data you want to view and how to view that data. For example, you can display metric data, alerting policies, and logs stored in your project. You can display time-series data on a chart, with a gauge or scorecard, or in tabular form.
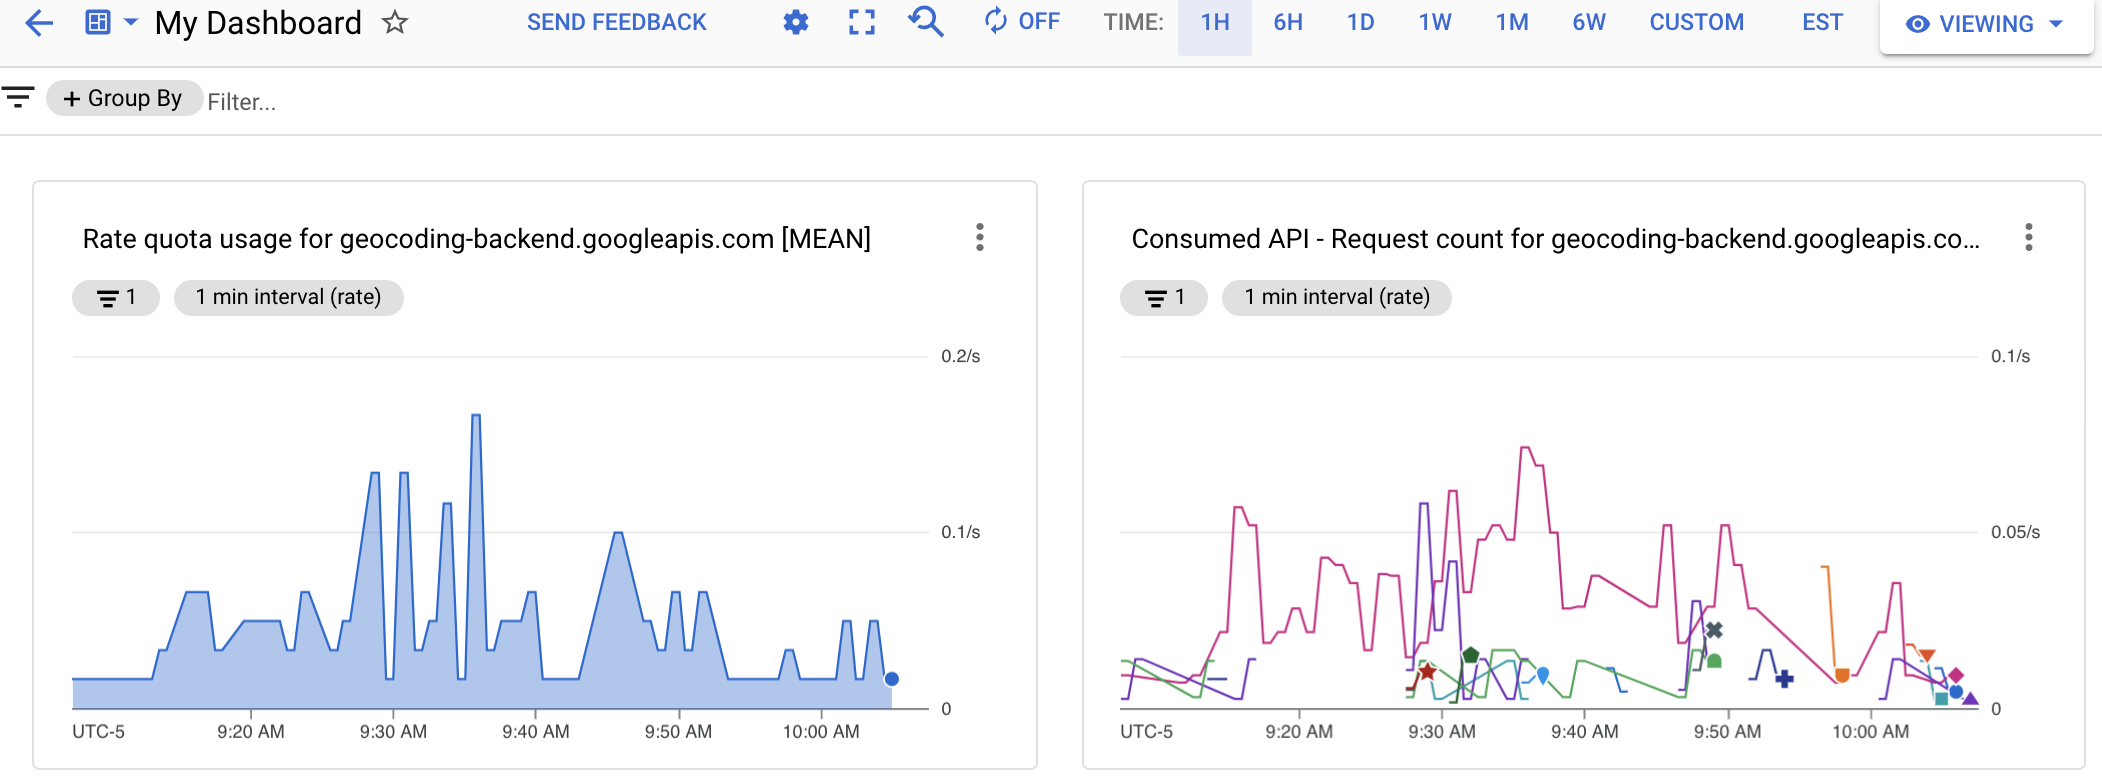
To create custom dashboards, you can use the Cloud console or the Cloud Monitoring API. The following image shows a custom dashboard with two charts:
- A quota chart on the left
- An API count chart on the right
Create a custom dashboard by creating metrics charts and then adding the charts to the dashboard. You can create the chart in the Metrics explorer, then add it to a new or existing dashboard. Or, you can create the dashboard, and then edit the dashboard to add a chart.
If you choose to manage custom dashboards by using the Cloud Monitoring API , the Metrics explorer provides you two useful utilities:
- To generate the JSON representation for a chart that you plan to add to a dashboard, configure the chart with Metrics Explorer. You can then access the JSON representation from the More optionsmenu item in the Metrics Explorer toolbar.
- To identify the syntax for a Monitoring filter, which is used with the Cloud Monitoring API, use the menu-driven interface of Metrics Explorer to configure the chart. After you select the metric and filters, switch to direct filter mode to view the equivalent Monitoring filter.
Create a custom dashboard
To create a custom dashboard, do the following:
- In the Cloud console, select Monitoring:
- In the navigation pane, select Dashboards.
- In the Dashboards Overview page, click Create dashboard.
- For each chart that you want to add to the dashboard, do the following:
-
Select a chart type from Add chart, or drag one from the library to the graph area.
A preconfigured chart of the selected type is displayed. The following example shows a Line chart and its configuration pane:
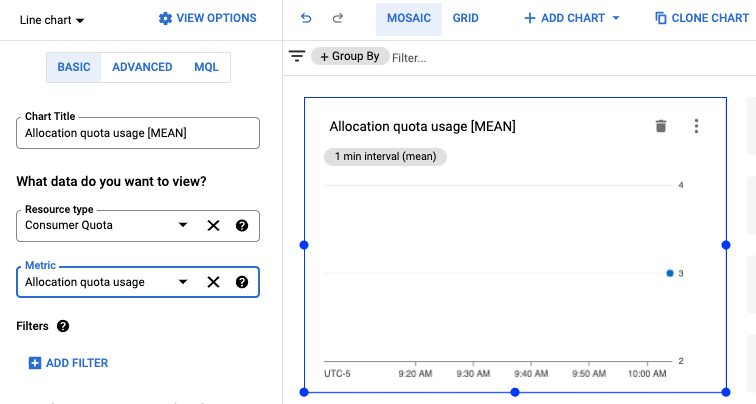
- Select the Resource typeand Metric, and
apply any filters just as you did above when creating a chart.
For more information about your choices, see Add dashboard widgets .
-
- (Optional)In the dashboard toolbar, click Add chartto add another chart and then repeat the previous steps to customize the chart.
- When you are done editing, select the left arrow to leave the dashboard, or select any other Monitoringmenu item. Your dashboard is saved automatically.
View a dashboard
To view a dashboard, do the following:
- In the Cloud console, select Monitoring:
- In the navigation pane, select Dashboards.
- Select your custom dashboard or a predefined dashboard from the list.
Related resources
For more information on creating dashboards, see:
Usage metrics
Two groups of metrics are available for monitoring usage of Google Maps Platform APIs: Serviceruntime metrics (resource type consumed_api ) available to the most Google Cloud APIs and Google Maps Platform metrics , Google Maps Platform APIs specific metrics, (resource type maps.googleapis.com/Api ).
Both metrics supports same set of resource labels for splitting APIs usage traffic: project_id
, service
, method
, version
, location
and credential_id
. See descriptions of the resource labels
in the documentation for corresponding Metrics resource:
Each group of metrics has two metric types for usage monitoring: Request Countand Request Latencies.
In the Request Countmetric you can split usage traffic by protocol
, grpc_status_code
, response_code
,
and response_code_class
metric labels. Additionally, you can split by platform_type
in Google Maps Platform metrics.
In the Request Latenciesmetric you can split usage traffic by protocol
, platform_type
, response_code
and response_code_class
metric labels in Google Maps Platform metrics only.
See more details on Metric types and labels in the documentation for corresponding Metrics group:
Response status and Response code labels mapping
The table below shows the mapping between the Response status code and HTTP response code returned in response to Google Maps Platform API requests and response code labels available in Cloud Monitoring: HTTP response code, HTTP response code class, GRPC status code . The GRPC status code is a numeric gRPC response code for gRPC requests, or gRPC equivalent code for HTTP requests.
| Maps API status | HTTP response code | HTTP response code | HTTP response code class | GRPC status code |
|---|---|---|---|---|
|
OK
|
200, 204, 302 |
200, 204, 302 |
2xx, 3xx |
0 (OK) |
|
DATA_NOT_AVAILABLE,
NOT_FOUND, ZERO_RESULTS |
200 | 200, 404 ( 1 ) | 2xx, 4xx ( 1 ) |
5 (NOT_FOUND) ( 1 ) |
|
INVALID_REQUEST (invalid parameter value),
MAX_ROUTE_LENGTH_EXCEEDED, MAX_WAYPOINTS_EXCEEDED, etc. |
200, 400 |
400 | 4xx | 3 (INVALID_ARGUMENT) |
|
INVALID_REQUEST (invalid/missing parameter, request parsing error)
|
200, 400 |
400 | 4xx | 3 (INVALID_ARGUMENT) |
|
REQUEST_DENIED
|
200, 403, 200, 400 |
403, 401 ( 1 ) |
4xx ( 1 ) | 7 (PERMISSION_DENIED), 16 (UNAUTHENTICATED) |
|
OVER_DAILY_LIMIT,
OVER_QUERY_LIMIT, RESOURCE_EXHAUSTED, dailyLimitExceeded, rateLimitExceeded, userRateLimitExceeded |
200, 403, 429 |
429 ( 1 ) | 4xx ( 1 ) | 8 (RESOURCE_EXHAUSTED) |
|
UNKNOWN_ERROR
|
200, 500, 503 |
500 ( 1
)
, 503 |
5xx ( 1 ) | 2 (UNKNOWN)/13 (INTERNAL) ( 1
)
, 14 (UNAVAILABLE) |
1
To improve the consistency of error code reporting, Google Maps Platform
APIs are migrating: 1) from HTTP response code/class 200
/ 2xx
to 404
/ 4xx
(and GRPC Status code from 0
( OK
) to 5
( NOT_FOUND
)) for Maps
API statuses: DATA_NOT_AVAILABLE
, NOT_FOUND
, ZERO_RESULTS
- status
,
2) from HTTP response code/class 200
/ 2xx
, 400
/ 4xx
to 403
/ 4xx
(and GRPC status code 7
( PERMISSION_DENIED
)) for Maps API status: REQUEST_DENIED
,
3) from HTTP response code/class 200
/ 2xx
, 403
/ 4xx
to
to 401
/ 4xx
(GRPC Status code 16
( UNAUTHENTICATED
)) for Maps API status: REQUEST_DENIED
,
4) from HTTP response code/class 200
/ 2xx
, 403
/ 4xx
to 429
/ 4xx
for Maps API statuses: OVER_QUERY_LIMIT
, dailyLimitExceeded
, rateLimitExceeded
, userRateLimitExceeded
,
5) from HTTP response code/class 200
/ 2xx
to 500
/ 5xx
(and GRPC Status code 2
( UNKNOWN
), 13
( INTERNAL
)) for
Maps API status: UNKNOWN_ERROR
.
You can see both response codes during the transition period. Response
codes returned in Maps API responses are not
changing. You can
explore the breakdown of response codes reported over time in the Metrics Explorer
. |
||||
Create alerts
Alerting gives timely awareness to problems in your applications so you can resolve the problems quickly. In Cloud Monitoring, an alerting policy describes the circumstances under which you want to be alerted and how you want to be notified.
Alerting policies can be simple or complex. Alerting policies let you configure whether a single time series can cause a condition to be met, or whether multiple time series must satisfy the condition before it is met. For example:
- Notify me when the request count for a specific API exceeds 1000 requests per 5-minute window.
- Notify the on-call team when the 90th percentile of HTTP 200 responses exceeds a latency of 100 ms for 3 or more APIs.
The following image shows an alert definition to generate a notification when the request count for an API exceeds 20 requests in a 5 minute window:
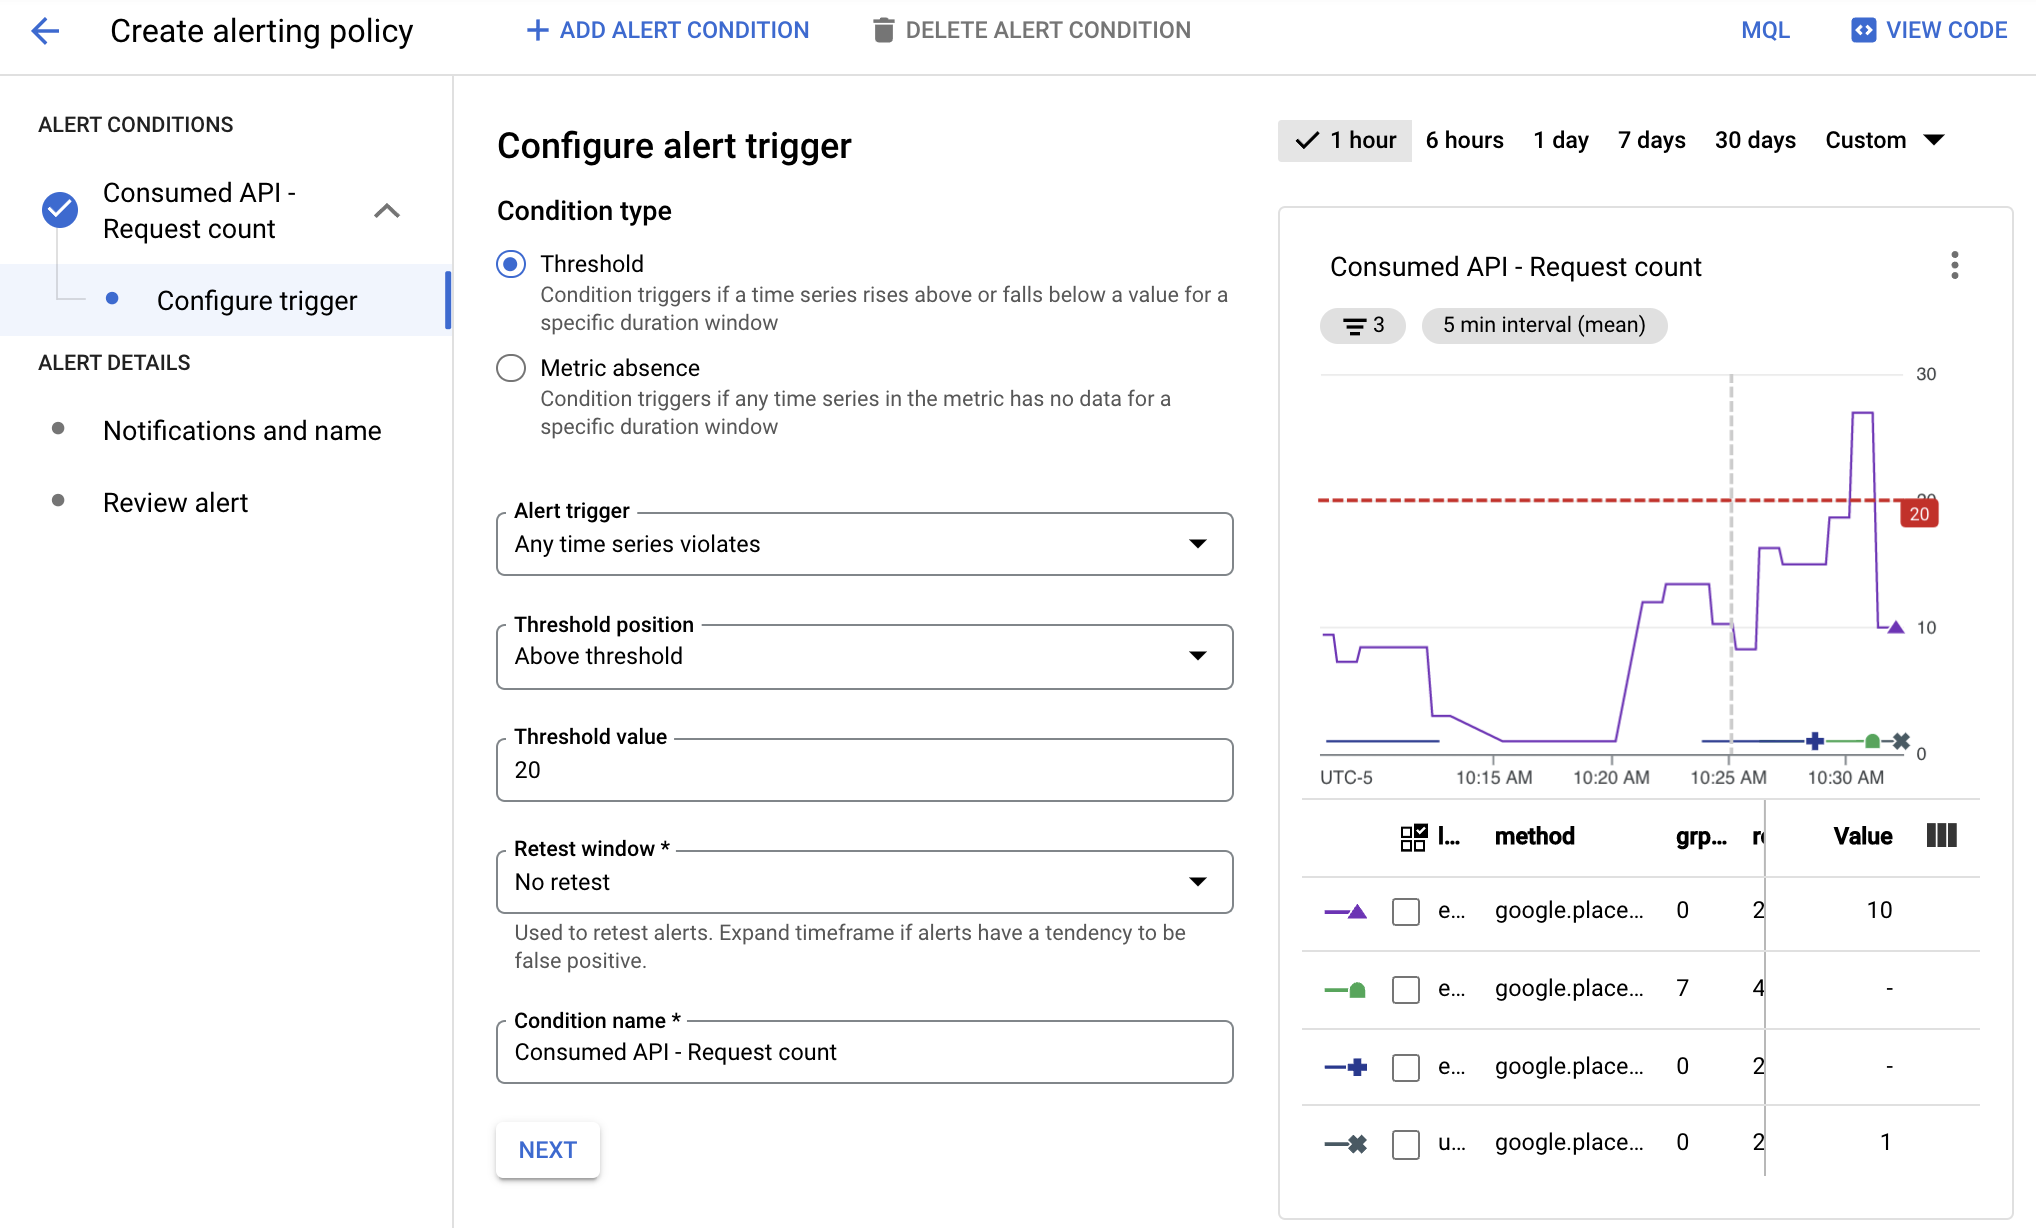
In this image:
- The chart show the number of API calls over time for different APIs.
- The red line shows the alert threshold. API calls that exceed this threshold for a 5-minute window trigger the alert. In this example, you can see that one API exceeded the limit.
When the conditions of an alerting policy are met, Cloud Monitoring opens an incident and issues notifications:
- An incident is a persistent record that stores information about the monitored resources when the condition was met. When the condition stops being met, the incident is automatically closed. You can view all incidents, open and closed, by using the alerting dashboard.
- You specify who is to be notified when you configure an alerting policy. Monitoring supports common notifications channels, including email, Cloud Mobile App, and services such as PagerDuty or Slack. For a full list of notification channels, see Notification options .
Alert types
Cloud Monitoring supports many types of alerts. For example, you can define:
- Metric threshold alerts : Trigger an alert if a metric rises above or falls below a value for a specific duration window or a metric increases or decreases by a predefined percentage.
- Budget alerts : Set threshold rules to trigger notifications when your costs (actual costs or forecasted costs) exceed a percentage of your budget (based on the rules you set). The alert does not cap API usage, it only alerts you when your spend amount gets near the specified amount.
- Quota alerts : Google Cloud establishes various quotas that you can use to track and limit the resources consumed by a project or organization. Use alerts to send notifications when your usage approaches a quota limit.
See Types of alerting policies for more information.
Manage alerting policies
You can add an alerting policy to your project by using the Cloud console or the Cloud Monitoring API. For information about how to view a list of your project's metric-based alerting policies, and how to modify those policies, see the following:
- Managing alerting policies by using the Cloud console
- Managing alerting policies by using the Cloud Monitoring API
Create an alert
When you create an alert, you:
- Define the conditions triggering your alerts, based on metrics data.
- Define notification channels to which alert notifications will be sent.
The example below shows how to set up an alert triggering when your Google Maps Platform service usage rate for any API exceeds 2 requests for a 5-minute window.
To create the alert, do the following:
- In the Cloud console, select Monitoring:
- Select Alerting.
- Select Edit Notifications Channelto define how the alert issues its notification. In this example, you will use your email address.
- For the Email channel, select Add New.
- Enter an Email Addressand Display Name.
- Select Save.
- Select Alerting.
- Select Create Policy.
- Select a time interval, such as 7 days.
- Under Alert Conditions, select New condition:
- Click Select a Metric, and select Consumed APIas the resource and Request Countas the metric and then select Apply.
- (Optional)Below the chart is the list of service, quota_metrics, API method, and metric value. Select Add filterto filter the data based on this information. For example, you can use the filter to specify that the methodhas to equal google.places.Autocomplete.httpto trigger the alert.
- Under Transform dataselect 5 minfor the Rolling windowand meanfor the Rolling window function.
- Select Next.
- Under Configure alert trigger, set the Threshold valueto 2 to specify to trigger the alert when there are more than 2 requests in the 5 minute window. Notice that the chart now shows the red line indicating the alert limit for the selected time interval. From the chart, you can see where an alert would have been triggered. You can use this chart to help you adjust the limit as necessary.
- Click Next.
- On the Configure notifications and finalize alertpage:
- Select the email address you created for the Notification Channel.
- Under Name the alert, enter My Test Alert.
- Select Create Policy.
- Make some API requests. Ensure that you make more than two API requests within five minutes to generate the alert email notification.
- After you get the email for the alert, go to the Alertingpage.
- In the table listing alerts, click the alert to view more information.
- Click the alert name to see information about the alert, including a chart showing the event that triggered it.
Related resources
For more information on alerts, see: