

This page describes how to take existing charts from Google Sheets and add them to Google Slides presentations.
Adding charts to a presentation can help create more impact and make data meaningful to your audience. Charts are uniquely powerful tools for showing patterns or trends in a data set, and can help you communicate clearly about quantitative data.
The above video discusses how to generate slides from spreadsheet data. It includes a complete example (Python) that adds a chart to a slide, and also imports spreadsheet cell data into a table.
About adding charts
Whenever you're presenting quantitative information, data charts can enhance your presentation. The Slides API lets you include any chart that you can create in Google Sheets: bar charts, line charts, pie charts, and many more.
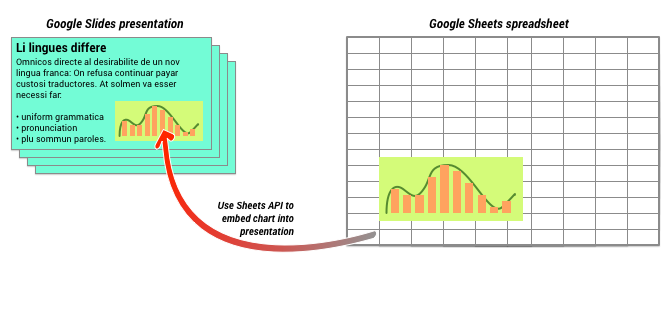
As shown in the diagram above, you must first create the chart in Google Sheets. Once the chart exists, you can embed it into your presentation.
The general process for managing charts in your presentation is:
- Create a chart in Google Sheets.
- Use the Sheets API to read the chart ID of the resulting EmbeddedChart .
- Use CreateSheetsChartRequest once to add it to a slide.
- Use RefreshSheetsChartRequest as needed to sync it to the source data.
Static vs linked charts
When you use the API to add a chart to your presentation, one parameter that you specify is the LinkingMode . This determines whether the chart is added as a static image or as an object that can be refreshed in the future.
Use LINKED
mode if:
- You want to refresh the chart in the future, reflecting changes in the underlying data.
- You want collaborators to have a link to the spreadsheet containing the source chart.
Use NOT_LINKED_IMAGE
(static) mode if:
- You want the chart to never change in the future.
- You do not want collaborators to see a link to the source spreadsheet.
Scopes for accessing Google Sheets
When you add a chart to your slide, the Slides API needs to access it in Google Sheets. This means your request must use one of the following scopes:
-
https://www.googleapis.com/auth/spreadsheets.readonly(preferred) -
https://www.googleapis.com/auth/spreadsheets -
https://www.googleapis.com/auth/drive.readonly -
https://www.googleapis.com/auth/drive
The spreadsheets.readonly
scope is generally the best to use, because it is
the most restrictive. However, if your app already uses one of the other scopes
listed above, then just use that scope.
Adding a chart
To add a chart, you'll need to know the spreadsheet ID and chart ID of the
chart in Google Sheets. Then you call the batchUpdate
method, using the CreateSheetsChartRequest
once to add the chart.
The following example takes a chart and adds it to a slide as LINKED
so
that it can be refreshed later.
Apps Script
 /**
 * Embed a Sheets chart (indicated by the spreadsheetId and sheetChartId) onto
 *   a page in the presentation. Setting the linking mode as 'LINKED' allows the
 *   chart to be refreshed if the Sheets version is updated.
 * @param {string} presentationId
 * @param {string} pageId
 * @param {string} shapeId
 * @param {string} sheetChartId
 * @returns {*}
 */
 function

 createSheetsChart
 (
 presentationId
 ,

 pageId
 ,

 shapeId
 ,

 sheetChartId
 )

 {

 const

 emu4M

 =

 {

 magnitude
 :

 4000000
 ,

 unit
 :

 "EMU"
 ,

 };

 const

 presentationChartId

 =

 "MyEmbeddedChart"
 ;

 const

 requests

 =

 [

 {

 createSheetsChart
 :

 {

 objectId
 :

 presentationChartId
 ,

 spreadsheetId
 :

 shapeId
 ,

 chartId
 :

 sheetChartId
 ,

 linkingMode
 :

 "LINKED"
 ,

 elementProperties
 :

 {

 pageObjectId
 :

 pageId
 ,

 size
 :

 {

 height
 :

 emu4M
 ,

 width
 :

 emu4M
 ,

 },

 transform
 :

 {

 scaleX
 :

 1
 ,

 scaleY
 :

 1
 ,

 translateX
 :

 100000
 ,

 translateY
 :

 100000
 ,

 unit
 :

 "EMU"
 ,

 },

 },

 },

 },

 ];

 // Execute the request.

 try

 {

 const

 batchUpdateResponse

 =

 Slides
 .
 Presentations
 .
 batchUpdate
 (

 {

 requests
 :

 requests
 ,

 },

 presentationId
 ,

 );

 console
 .
 log
 (
 "Added a linked Sheets chart with ID: %s"
 ,

 presentationChartId
 );

 return

 batchUpdateResponse
 ;

 }

 catch

 (
 err
 )

 {

 // TODO (Developer) - Handle exception

 console
 .
 log
 (
 "Failed with error: %s"
 ,

 err
 .
 error
 );

 }
 }
Go
 // Embed a Sheets chart (indicated by the spreadsheetId and sheetChartId) onto
 // a page in the presentation. Setting the linking mode as "LINKED" allows the
 // chart to be refreshed if the Sheets version is updated.
 emu4M

 :=

 slides
 .
 Dimension
 {
 Magnitude
 :

 4000000
 ,

 Unit
 :

 "EMU"
 }
 presentationChartId

 :=

 "MyEmbeddedChart"
 requests

 :=

 []
 *
 slides
 .
 Request
{{
	CreateSheetsChart: &slides.CreateSheetsChartRequest{
		ObjectId:      presentationChartId,
		SpreadsheetId: spreadsheetId,
		ChartId:       sheetChartId,
		LinkingMode:   "LINKED",
		ElementProperties: &slides.PageElementProperties{
			PageObjectId: pageId,
			Size: &slides.Size{
				Height: &emu4M,
				Width:  &emu4M,
			},
			Transform: &slides.AffineTransform{
				ScaleX:     1.0,
				ScaleY:     1.0,
				TranslateX: 100000.0,
				TranslateY: 100000.0,
				Unit:       "EMU",
			},
		},
	},
} }
 // Execute the requests.
 body

 :=

& slides
 .
 BatchUpdatePresentationRequest
 {
 Requests
 :

 requests
 }
 response
 ,

 _

 :=

 slidesService
 .
 Presentations
 .
 BatchUpdate
 (
 presentationId
 ,

 body
 ).
 Do
 ()
 fmt
 .
 Printf
 (
 "Added a linked Sheets chart with ID %s"
 ,

 presentationChartId
 )
Java
 import

 com.google.api.client.googleapis.json.GoogleJsonError
 ;
 import

 com.google.api.client.googleapis.json.GoogleJsonResponseException
 ;
 import

 com.google.api.client.http.HttpRequestInitializer
 ;
 import

 com.google.api.client.http.javanet.NetHttpTransport
 ;
 import

 com.google.api.client.json.gson.GsonFactory
 ;
 import

 com.google.api.services.slides.v1.Slides
 ;
 import

 com.google.api.services.slides.v1.SlidesScopes
 ;
 import

 com.google.api.services.slides.v1.model.AffineTransform
 ;
 import

 com.google.api.services.slides.v1.model.BatchUpdatePresentationRequest
 ;
 import

 com.google.api.services.slides.v1.model.BatchUpdatePresentationResponse
 ;
 import

 com.google.api.services.slides.v1.model.CreateSheetsChartRequest
 ;
 import

 com.google.api.services.slides.v1.model.Dimension
 ;
 import

 com.google.api.services.slides.v1.model.PageElementProperties
 ;
 import

 com.google.api.services.slides.v1.model.Request
 ;
 import

 com.google.api.services.slides.v1.model.Size
 ;
 import

 com.google.auth.http.HttpCredentialsAdapter
 ;
 import

 com.google.auth.oauth2.GoogleCredentials
 ;
 import

 java.io.IOException
 ;
 import

 java.util.ArrayList
 ;
 import

 java.util.Collections
 ;
 import

 java.util.List
 ;
 /* Class to demonstrate the use of Slides Create Chart API */
 public

 class
 CreateSheetsChart

 {

 /**
 * Adds chart from spreadsheet to slides as linked.
 *
 * @param presentationId - id of the presentation.
 * @param pageId         - id of the page.
 * @param spreadsheetId  - id of the spreadsheet.
 * @param sheetChartId   - id of the chart in sheets.
 * @return presentation chart id
 * @throws IOException - if credentials file not found.
 */

 public

 static

 BatchUpdatePresentationResponse

 createSheetsChart
 (

 String

 presentationId
 ,

 String

 pageId
 ,

 String

 spreadsheetId
 ,

 Integer

 sheetChartId
 )

 throws

 IOException

 {

 /* Load pre-authorized user credentials from the environment.
 TODO(developer) - See https://developers.google.com/identity for
 guides on implementing OAuth2 for your application. */

 GoogleCredentials

 credentials

 =

 GoogleCredentials
 .
 getApplicationDefault
 ()

 .
 createScoped
 (
 Collections
 .
 singleton
 (
 SlidesScopes
 .
 PRESENTATIONS
 ));

 HttpRequestInitializer

 requestInitializer

 =

 new

 HttpCredentialsAdapter
 (

 credentials
 );

 // Create the slides API client

 Slides

 service

 =

 new

 Slides
 .
 Builder
 (
 new

 NetHttpTransport
 (),

 GsonFactory
 .
 getDefaultInstance
 (),

 requestInitializer
 )

 .
 setApplicationName
 (
 "Slides samples"
 )

 .
 build
 ();

 // Embed a Sheets chart (indicated by the spreadsheetId and sheetChartId) onto

 // a page in the presentation. Setting the linking mode as "LINKED" allows the

 // chart to be refreshed if the Sheets version is updated.

 List<Request>

 requests

 =

 new

 ArrayList
<> ();

 Dimension

 emu4M

 =

 new

 Dimension
 ().
 setMagnitude
 (
 4000000.0
 ).
 setUnit
 (
 "EMU"
 );

 String

 presentationChartId

 =

 "MyEmbeddedChart"
 ;

 requests
 .
 add
 (
 new

 Request
 ()

 .
 setCreateSheetsChart
 (
 new

 CreateSheetsChartRequest
 ()

 .
 setObjectId
 (
 presentationChartId
 )

 .
 setSpreadsheetId
 (
 spreadsheetId
 )

 .
 setChartId
 (
 sheetChartId
 )

 .
 setLinkingMode
 (
 "LINKED"
 )

 .
 setElementProperties
 (
 new

 PageElementProperties
 ()

 .
 setPageObjectId
 (
 pageId
 )

 .
 setSize
 (
 new

 Size
 ()

 .
 setHeight
 (
 emu4M
 )

 .
 setWidth
 (
 emu4M
 ))

 .
 setTransform
 (
 new

 AffineTransform
 ()

 .
 setScaleX
 (
 1.0
 )

 .
 setScaleY
 (
 1.0
 )

 .
 setTranslateX
 (
 100000.0
 )

 .
 setTranslateY
 (
 100000.0
 )

 .
 setUnit
 (
 "EMU"
 )))));

 BatchUpdatePresentationResponse

 response

 =

 null
 ;

 try

 {

 // Execute the request.

 BatchUpdatePresentationRequest

 body

 =

 new

 BatchUpdatePresentationRequest
 ().
 setRequests
 (
 requests
 );

 response

 =

 service
 .
 presentations
 ().
 batchUpdate
 (
 presentationId
 ,

 body
 ).
 execute
 ();

 System
 .
 out
 .
 println
 (
 "Added a linked Sheets chart with ID "

 +

 presentationChartId
 );

 }

 catch

 (
 GoogleJsonResponseException

 e
 )

 {

 // TODO(developer) - handle error appropriately

 GoogleJsonError

 error

 =

 e
 .
 getDetails
 ();

 if

 (
 error
 .
 getCode
 ()

 ==

 404
 )

 {

 System
 .
 out
 .
 printf
 (
 "Presentation not found with id '%s'.\n"
 ,

 presentationId
 );

 }

 else

 {

 throw

 e
 ;

 }

 }

 return

 response
 ;

 }
 }
JavaScript
 function

 createSheetsChart
 (
 presentationId
 ,

 pageId
 ,

 shapeId
 ,

 sheetChartId
 ,

 callback
 )

 {

 // Embed a Sheets chart (indicated by the spreadsheetId and sheetChartId) onto

 // a page in the presentation. Setting the linking mode as "LINKED" allows the

 // chart to be refreshed if the Sheets version is updated.

 const

 emu4M

 =

 {

 magnitude
 :

 4000000
 ,

 unit
 :

 'EMU'
 ,

 };

 const

 presentationChartId

 =

 'MyEmbeddedChart'
 ;

 const

 requests

 =

 [{

 createSheetsChart
 :

 {

 objectId
 :

 presentationChartId
 ,

 spreadsheetId
 :

 shapeId
 ,

 chartId
 :

 sheetChartId
 ,

 linkingMode
 :

 'LINKED'
 ,

 elementProperties
 :

 {

 pageObjectId
 :

 pageId
 ,

 size
 :

 {

 height
 :

 emu4M
 ,

 width
 :

 emu4M
 ,

 },

 transform
 :

 {

 scaleX
 :

 1
 ,

 scaleY
 :

 1
 ,

 translateX
 :

 100000
 ,

 translateY
 :

 100000
 ,

 unit
 :

 'EMU'
 ,

 },

 },

 },

 }];

 // Execute the request.

 try

 {

 gapi
 .
 client
 .
 slides
 .
 presentations
 .
 batchUpdate
 ({

 presentationId
 :

 presentationId
 ,

 requests
 :

 requests
 ,

 }).
 then
 ((
 batchUpdateResponse
 )

 =
>
 {

 console
 .
 log
 (
 `Added a linked Sheets chart with ID:
 ${
 presentationChartId
 }
 `
 );

 if

 (
 callback
 )

 callback
 (
 batchUpdateResponse
 .
 result
 );

 });

 }

 catch

 (
 err
 )

 {

 document
 .
 getElementById
 (
 'content'
 ).
 innerText

 =

 err
 .
 message
 ;

 return
 ;

 }
 }
Node.js
 import

 {
 GoogleAuth
 }

 from

 'google-auth-library'
 ;
 import

 {
 google
 }

 from

 'googleapis'
 ;
 /**
 * Embeds a Sheets chart into a presentation.
 * @param {string} presentationId The ID of the presentation.
 * @param {string} pageId The ID of the page to embed the chart on.
 * @param {string} spreadsheetId The ID of the spreadsheet containing the chart.
 * @param {string} sheetChartId The ID of the chart in the spreadsheet.
 * @return {Promise<object>} The response from the batch update.
 */
 async

 function

 createSheetsChart
 (

 presentationId
 ,

 pageId
 ,

 spreadsheetId
 ,

 sheetChartId
 ,
 )

 {

 // Authenticate with Google and get an authorized client.

 const

 auth

 =

 new

 GoogleAuth
 ({

 scopes
 :

 'https://www.googleapis.com/auth/presentations'
 ,

 });

 // Create a new Slides API client.

 const

 service

 =

 google
 .
 slides
 ({
 version
 :

 'v1'
 ,

 auth
 });

 // The size of the embedded chart, in English Metric Units (EMUs).

 const

 emu4M

 =

 {

 magnitude
 :

 4000000
 ,

 unit
 :

 'EMU'
 ,

 };

 // The ID to use for the embedded chart.

 const

 presentationChartId

 =

 'MyEmbeddedChart'
 ;

 // The request to create a new chart.

 const

 requests

 =

 [

 {

 createSheetsChart
 :

 {

 objectId
 :

 presentationChartId
 ,

 spreadsheetId
 ,

 chartId
 :

 sheetChartId
 ,

 // Linking mode allows the chart to be updated if the source sheet changes.

 linkingMode
 :

 'LINKED'
 ,

 elementProperties
 :

 {

 pageObjectId
 :

 pageId
 ,

 size
 :

 {

 height
 :

 emu4M
 ,

 width
 :

 emu4M
 ,

 },

 transform
 :

 {

 scaleX
 :

 1
 ,

 scaleY
 :

 1
 ,

 translateX
 :

 100000
 ,

 translateY
 :

 100000
 ,

 unit
 :

 'EMU'
 ,

 },

 },

 },

 },

 ];

 // Execute the batch update request to create the chart.

 const

 batchUpdateResponse

 =

 await

 service
 .
 presentations
 .
 batchUpdate
 ({

 presentationId
 ,

 requestBody
 :

 {

 requests
 ,

 },

 });

 console
 .
 log
 (
 `Added a linked Sheets chart with ID:
 ${
 presentationChartId
 }
 `
 );

 return

 batchUpdateResponse
 .
 data
 ;
 }
PHP
< ?php
 use Google\Client;
 use Google\Service\Drive;
 use Google\Service\Slides;
 use Google\Service\Slides\Request;
 function createSheetsChart($presentationId, $pageId, $spreadsheetId, $sheetChartId)
 {
 /* Load pre-authorized user credentials from the environment.
 TODO(developer) - See https://developers.google.com/identity for
 guides on implementing OAuth2 for your application. */
 $client = new Google\Client();
 $client->useApplicationDefaultCredentials();
 $client->addScope(Google\Service\Drive::DRIVE);
 $slidesService = new Google_Service_Slides($client);
 // Embed a Sheets chart (indicated by the spreadsheet_id and sheet_chart_id) onto
 // a page in the presentation. Setting the linking mode as "LINKED" allows the
 // chart to be refreshed if the Sheets version is updated.
 try {
 //creating new presentaion chart
 $presentationChartId = 'MyEmbeddedChart';
 $emu4M = array('magnitude' => 4000000, 'unit' => 'EMU');
 $requests = array();
 $requests[] = new Google_Service_Slides_Request(
 array(
 'createSheetsChart' => array(
 'spreadsheetId' => $spreadsheetId,
 'chartId' => $sheetChartId,
 'linkingMode' => 'LINKED',
 'elementProperties' => array(
 'pageObjectId' => $pageId,
 'size' => array(
 'height' => $emu4M,
 'width' => $emu4M
 ),
 'transform' => array(
 'scaleX' => 1,
 'scaleY' => 1,
 'translateX' => 100000,
 'translateY' => 100000,
 'unit' => 'EMU'
 )
 )
 )
 ));
 // Execute the request.
 $batchUpdateRequest = new Google_Service_Slides_BatchUpdatePresentationRequest(array(
 'requests' => $requests
 ));
 $response = $slidesService->presentations->batchUpdate($presentationId, $batchUpdateRequest);
 printf("Added a linked Sheets chart with ID: %s\n", $response->getPresentationId());
 return $response;
 } catch (Exception $e) {
 echo 'Message: ' . $e->getMessage();
 }
 }
Python
 import

 google.auth
 from

 googleapiclient.discovery

 import
 build
 from

 googleapiclient.errors

 import
 HttpError
 def

 create_sheets_chart
 (
 presentation_id
 ,
 page_id
 ,
 spreadsheet_id
 ,
 sheet_chart_id
 ):

 """
 create_sheets_chart the user has access to.
 Load pre-authorized user credentials from the environment.
 TODO(developer) - See https://developers.google.com/identity
 for guides on implementing OAuth2 for the application.
 """
 creds
 ,
 _
 =
 google
 .
 auth
 .
 default
 ()
 # pylint: disable=maybe-no-member
 try
 :
 slides_service
 =
 build
 (
 "slides"
 ,
 "v1"
 ,
 credentials
 =
 creds
 )
 # Embed a Sheets chart (indicated by the spreadsheet_id and
 # sheet_chart_id) onto a page in the presentation.
 # Setting the linking mode as "LINKED" allows the
 # chart to be refreshed if the Sheets version is updated.
 emu4m
 =
 {
 "magnitude"
 :
 4000000
 ,
 "unit"
 :
 "EMU"
 }
 presentation_chart_id
 =
 "MyEmbeddedChart"
 requests
 =
 [
 {
 "createSheetsChart"
 :
 {
 "objectId"
 :
 presentation_chart_id
 ,
 "spreadsheetId"
 :
 spreadsheet_id
 ,
 "chartId"
 :
 sheet_chart_id
 ,
 "linkingMode"
 :
 "LINKED"
 ,
 "elementProperties"
 :
 {
 "pageObjectId"
 :
 page_id
 ,
 "size"
 :
 {
 "height"
 :
 emu4m
 ,
 "width"
 :
 emu4m
 },
 "transform"
 :
 {
 "scaleX"
 :
 1
 ,
 "scaleY"
 :
 1
 ,
 "translateX"
 :
 100000
 ,
 "translateY"
 :
 100000
 ,
 "unit"
 :
 "EMU"
 ,
 },
 },
 }
 }
 ]
 # Execute the request.
 body
 =
 {
 "requests"
 :
 requests
 }
 response
 =
 (
 slides_service
 .
 presentations
 ()
 .
 batchUpdate
 (
 presentationId
 =
 presentation_id
 ,
 body
 =
 body
 )
 .
 execute
 ()
 )
 print
 (
 f
 "Added a linked Sheets chart with ID:
 {
 presentation_chart_id
 }
 "
 )
 return
 response
 except
 HttpError
 as
 error
 :
 print
 (
 f
 "An error occurred:
 {
 error
 }
 "
 )
 return
 error
 if
 __name__
 ==
 "__main__"
 :
 # Put the presentation_id, Page_id of slides
 # spreadsheet_id and sheet_chart_id to be submitted.
 create_sheets_chart
 (
 "10QnVUx1X2qHsL17WUidGpPh_SQhXYx40CgIxaKk8jU4"
 ,
 "FIRSTSLIDE"
 ,
 "17eqFZl_WK4WVixX8PjvjfLD77DraoFwMDXeiHB3dvuM"
 ,
 "1107320627"
 ,
 )
Ruby
 # Embed a Sheets chart (indicated by the spreadsheet_id and sheet_chart_id) onto
 # a page in the presentation. Setting the linking mode as "LINKED" allows the
 # chart to be refreshed if the Sheets version is updated.
 emu4M

 =

 {

 magnitude
 :

 4000000
 ,

 unit
 :

 'EMU'
 }
 presentation_chart_id

 =

 'my_embedded_chart'
 requests

 =

 [
 {

 create_sheets_chart
 :

 {

 object_id_prop
 :

 presentation_chart_id
 ,

 spreadsheet_id
 :

 spreadsheet_id
 ,

 chart_id
 :

 sheet_chart_id
 ,

 linking_mode
 :

 'LINKED'
 ,

 element_properties
 :

 {

 page_object_id
 :

 page_id
 ,

 size
 :

 {

 height
 :

 emu4M
 ,

 width
 :

 emu4M

 },

 transform
 :

 {

 scale_x
 :

 1
 ,

 scale_y
 :

 1
 ,

 translate_x
 :

 100000
 ,

 translate_y
 :

 100000
 ,

 unit
 :

 'EMU'

 }

 }

 }
 }
 ]
 # Execute the request.
 req

 =

 Google
 ::
 Apis
 ::
 SlidesV1
 ::
 BatchUpdatePresentationRequest
 .
 new
 (
 requests
 :

 requests
 )
 response

 =

 slides_service
 .
 batch_update_presentation
 (
 presentation_id
 ,

 req
 )
 puts

 "Added a linked Sheets chart with ID:
 #{
 presentation_chart_id
 }
 "
Refreshing a chart
If you embedded a LINKED
chart in your presentation, then you can refresh it
at any time using RefreshSheetsChartRequest
.
This updates the chart to bring it in sync with the underlying Sheets chart and
data that it's based on.
The following example refreshes an existing chart:
Apps Script
 /**
 * Refresh the sheets charts
 * @param {string} presentationId
 * @param {string} presentationChartId
 * @returns {*}
 */
 function

 refreshSheetsChart
 (
 presentationId
 ,

 presentationChartId
 )

 {

 const

 requests

 =

 [

 {

 refreshSheetsChart
 :

 {

 objectId
 :

 presentationChartId
 ,

 },

 },

 ];

 // Execute the request.

 try

 {

 const

 batchUpdateResponse

 =

 Slides
 .
 Presentations
 .
 batchUpdate
 (

 {

 requests
 :

 requests
 ,

 },

 presentationId
 ,

 );

 console
 .
 log
 (

 "Refreshed a linked Sheets chart with ID: %s"
 ,

 presentationChartId
 ,

 );

 return

 batchUpdateResponse
 ;

 }

 catch

 (
 err
 )

 {

 // TODO (Developer) - Handle exception

 console
 .
 log
 (
 "Failed with error: %s"
 ,

 err
 .
 error
 );

 }
 }
Go
 requests

 :=

 []
 *
 slides
 .
 Request
{{
	RefreshSheetsChart: &slides.RefreshSheetsChartRequest{
		ObjectId: presentationChartId,
	},
} }
 // Execute the requests.
 body

 :=

& slides
 .
 BatchUpdatePresentationRequest
 {
 Requests
 :

 requests
 }
 response
 ,

 _

 :=

 slidesService
 .
 Presentations
 .
 BatchUpdate
 (
 presentationId
 ,

 body
 ).
 Do
 ()
 fmt
 .
 Printf
 (
 "Refreshed a linked Sheets chart with ID %s"
 ,

 presentationChartId
 )
Java
 import

 com.google.api.client.googleapis.json.GoogleJsonError
 ;
 import

 com.google.api.client.googleapis.json.GoogleJsonResponseException
 ;
 import

 com.google.api.client.http.HttpRequestInitializer
 ;
 import

 com.google.api.client.http.javanet.NetHttpTransport
 ;
 import

 com.google.api.client.json.gson.GsonFactory
 ;
 import

 com.google.api.services.slides.v1.Slides
 ;
 import

 com.google.api.services.slides.v1.SlidesScopes
 ;
 import

 com.google.api.services.slides.v1.model.BatchUpdatePresentationRequest
 ;
 import

 com.google.api.services.slides.v1.model.BatchUpdatePresentationResponse
 ;
 import

 com.google.api.services.slides.v1.model.RefreshSheetsChartRequest
 ;
 import

 com.google.api.services.slides.v1.model.Request
 ;
 import

 com.google.auth.http.HttpCredentialsAdapter
 ;
 import

 com.google.auth.oauth2.GoogleCredentials
 ;
 import

 java.io.IOException
 ;
 import

 java.util.ArrayList
 ;
 import

 java.util.Collections
 ;
 import

 java.util.List
 ;
 /* Class to demonstrate the use of Slides Refresh Chart API */
 public

 class
 RefreshSheetsChart

 {

 /**
 * Refresh the sheets charts.
 *
 * @param presentationId      - id of the presentation.
 * @param presentationChartId - id of the presentation chart.
 * @return presentation chart id
 * @throws IOException - if credentials file not found.
 */

 public

 static

 BatchUpdatePresentationResponse

 refreshSheetsChart
 (

 String

 presentationId
 ,

 String

 presentationChartId
 )

 throws

 IOException

 {

 /* Load pre-authorized user credentials from the environment.
 TODO(developer) - See https://developers.google.com/identity for
 guides on implementing OAuth2 for your application. */

 GoogleCredentials

 credentials

 =

 GoogleCredentials
 .
 getApplicationDefault
 ()

 .
 createScoped
 (
 Collections
 .
 singleton
 (
 SlidesScopes
 .
 PRESENTATIONS
 ));

 HttpRequestInitializer

 requestInitializer

 =

 new

 HttpCredentialsAdapter
 (

 credentials
 );

 // Create the slides API client

 Slides

 service

 =

 new

 Slides
 .
 Builder
 (
 new

 NetHttpTransport
 (),

 GsonFactory
 .
 getDefaultInstance
 (),

 requestInitializer
 )

 .
 setApplicationName
 (
 "Slides samples"
 )

 .
 build
 ();

 List<Request>

 requests

 =

 new

 ArrayList
<> ();

 // Refresh an existing linked Sheets chart embedded a presentation.

 requests
 .
 add
 (
 new

 Request
 ()

 .
 setRefreshSheetsChart
 (
 new

 RefreshSheetsChartRequest
 ()

 .
 setObjectId
 (
 presentationChartId
 )));

 BatchUpdatePresentationResponse

 response

 =

 null
 ;

 try

 {

 // Execute the request.

 BatchUpdatePresentationRequest

 body

 =

 new

 BatchUpdatePresentationRequest
 ().
 setRequests
 (
 requests
 );

 response

 =

 service
 .
 presentations
 ().
 batchUpdate
 (
 presentationId
 ,

 body
 ).
 execute
 ();

 System
 .
 out
 .
 println
 (
 "Refreshed a linked Sheets chart with ID "

 +

 presentationChartId
 );

 }

 catch

 (
 GoogleJsonResponseException

 e
 )

 {

 // TODO(developer) - handle error appropriately

 GoogleJsonError

 error

 =

 e
 .
 getDetails
 ();

 if

 (
 error
 .
 getCode
 ()

 ==

 400
 )

 {

 System
 .
 out
 .
 printf
 (
 "Presentation chart not found with id '%s'.\n"
 ,

 presentationChartId
 );

 }

 else

 if

 (
 error
 .
 getCode
 ()

 ==

 404
 )

 {

 System
 .
 out
 .
 printf
 (
 "Presentation not found with id '%s'.\n"
 ,

 presentationId
 );

 }

 else

 {

 throw

 e
 ;

 }

 }

 return

 response
 ;

 }
 }
JavaScript
 function

 refreshSheetsChart
 (
 presentationId
 ,

 presentationChartId
 ,

 callback
 )

 {

 const

 requests

 =

 [{

 refreshSheetsChart
 :

 {

 objectId
 :

 presentationChartId
 ,

 },

 }];

 // Execute the request.

 try

 {

 gapi
 .
 client
 .
 slides
 .
 presentations
 .
 batchUpdate
 ({

 presentationId
 :

 presentationId
 ,

 requests
 :

 requests
 ,

 }).
 then
 ((
 batchUpdateResponse
 )

 =
>
 {

 console
 .
 log
 (
 `Refreshed a linked Sheets chart with ID:
 ${
 presentationChartId
 }
 `
 );

 if

 (
 callback
 )

 callback
 (
 batchUpdateResponse
 .
 result
 );

 });

 }

 catch

 (
 err
 )

 {

 document
 .
 getElementById
 (
 'content'
 ).
 innerText

 =

 err
 .
 message
 ;

 return
 ;

 }
 }
Node.js
 import

 {
 GoogleAuth
 }

 from

 'google-auth-library'
 ;
 import

 {
 google
 }

 from

 'googleapis'
 ;
 /**
 * Refreshes an embedded Sheets chart in a presentation.
 * @param {string} presentationId The ID of the presentation.
 * @param {string} presentationChartId The ID of the chart to refresh.
 * @return {Promise<object>} The response from the batch update.
 */
 async

 function

 refreshSheetsChart
 (
 presentationId
 ,

 presentationChartId
 )

 {

 // Authenticate with Google and get an authorized client.

 const

 auth

 =

 new

 GoogleAuth
 ({

 scopes
 :

 'https://www.googleapis.com/auth/presentations'
 ,

 });

 // Create a new Slides API client.

 const

 service

 =

 google
 .
 slides
 ({
 version
 :

 'v1'
 ,

 auth
 });

 // The request to refresh the chart.

 const

 requests

 =

 [

 {

 refreshSheetsChart
 :

 {

 objectId
 :

 presentationChartId
 ,

 },

 },

 ];

 // Execute the batch update request to refresh the chart.

 const

 batchUpdateResponse

 =

 await

 service
 .
 presentations
 .
 batchUpdate
 ({

 presentationId
 ,

 requestBody
 :

 {

 requests
 ,

 },

 });

 console
 .
 log
 (

 `Refreshed a linked Sheets chart with ID:
 ${
 presentationChartId
 }
 `
 ,

 );

 return

 batchUpdateResponse
 .
 data
 ;
 }
PHP
< ?php
 use Google\Client;
 use Google\Service\Drive;
 use Google\Service\Slides;
 use Google\Service\Slides\BatchUpdatePresentationRequest;
 function refreshSheetsChart($presentationId, $presentationChartId)
 {
 /* Load pre-authorized user credentials from the environment.
 TODO(developer) - See https://developers.google.com/identity for
 guides on implementing OAuth2 for your application. */
 $client = new Google\Client();
 $client->useApplicationDefaultCredentials();
 $client->addScope(Google\Service\Drive::DRIVE);
 $slidesService = new Google_Service_Slides($client);
 try {
 $requests = array();
 $requests[] = new Google_Service_Slides_Request(array(
 'refreshSheetsChart' => array(
 'objectId' => $presentationChartId
 )
 ));
 // Execute the request.
 $batchUpdateRequest = new Google_Service_Slides_BatchUpdatePresentationRequest(array(
 'requests' => $requests
 ));
 $response = $slidesService->presentations->batchUpdate($presentationId, $batchUpdateRequest);
 printf("Refreshed a linked Sheets chart with ID: %s\n", $response->getPresentationId());
 return $response;
 } catch (Exception $e) {
 echo 'Message: ' . $e->getMessage();
 }
 }
Python
 import

 google.auth
 from

 googleapiclient.discovery

 import
 build
 from

 googleapiclient.errors

 import
 HttpError
 def

 refresh_sheets_chart
 (
 presentation_id
 ,
 presentation_chart_id
 ):

 """
 refresh_sheets_chart the user has access to.
 Load pre-authorized user credentials from the environment.
 TODO(developer) - See https://developers.google.com/identity
 for guides on implementing OAuth2 for the application.
 """
 creds
 ,
 _
 =
 google
 .
 auth
 .
 default
 ()
 # pylint: disable=maybe-no-member
 try
 :
 slides_service
 =
 build
 (
 "slides"
 ,
 "v1"
 ,
 credentials
 =
 creds
 )
 # Refresh an existing linked Sheets chart embedded in a presentation.
 requests
 =
 [{
 "refreshSheetsChart"
 :
 {
 "objectId"
 :
 presentation_chart_id
 }}]
 # Execute the request.
 body
 =
 {
 "requests"
 :
 requests
 }
 response
 =
 (
 slides_service
 .
 presentations
 ()
 .
 batchUpdate
 (
 presentationId
 =
 presentation_id
 ,
 body
 =
 body
 )
 .
 execute
 ()
 )
 print
 (
 f
 "Refreshed a linked Sheets chart with ID:
 {
 presentation_chart_id
 }
 "
 )
 return
 response
 except
 HttpError
 as
 error
 :
 print
 (
 f
 "An error occurred:
 {
 error
 }
 "
 )
 return
 error
 if
 __name__
 ==
 "__main__"
 :
 # Put the presentation_id, presentation_chart_id
 # to be submitted.
 refresh_sheets_chart
 (
 "10QnVUx1X2qHsL17WUidGpPh_SQhXYx40CgIxaKk8jU4"
 ,
 "1107320627"
 )
Ruby
 # Refresh an existing linked Sheets chart embedded in a presentation.
 requests

 =

 [
 {

 refresh_sheets_chart
 :

 {

 object_id_prop
 :

 presentation_chart_id

 }
 }
 ]
 # Execute the request.
 req

 =

 Google
 ::
 Apis
 ::
 SlidesV1
 ::
 BatchUpdatePresentationRequest
 .
 new
 (
 requests
 :

 requests
 )
 response

 =

 slides_service
 .
 batch_update_presentation
 (
 presentation_id
 ,

 req
 )
 puts

 "Refreshed a linked Sheets chart with ID:
 #{
 presentation_chart_id
 }
 "