Monitored resources are how Google represents resources such as clusters,
nodes, Pods, and containers. To learn more, refer to Cloud Monitoring'sMonitored resource typesdocumentation.
To query for logs and metrics, you'll need to know at least these resource
labels:
project_id:Project IDof the cluster'slogging-monitoring
project.
You provided this value in thestackdriver.projectIDfield of your cluster
configuration file.
location: A Google Cloud region where you want to route and store your
Cloud Monitoring metrics. You specify the region during installation in
thestackdriver.clusterLocationfield of your cluster configuration file. We recommend choosing a region
that's near your on-premises data center.
You specify the Cloud Logging logs routing and storage location in the
Log Router configuration. For more information about logs routing, seeRouting and storage overview.
cluster_name: Cluster name that you chose when you created the cluster.
You can retrieve thecluster_namevalue for either the admin or the user
cluster by inspecting the Stackdriver custom resource:
CLUSTER_KUBECONFIGis the path to the admin
cluster's or user cluster's kubeconfig file for which the cluster name is required.
Logs and metrics routing
Stackdriver log forwarder (stackdriver-log-forwarder) sends logs from each
node machine to Cloud Logging. Similarly, GKE metrics agent
(gke-metrics-agent) sends metrics from each node machine to
Cloud Monitoring. Before the logs and metrics are sent, the Stackdriver
Operator (stackdriver-operator) attaches the value from theclusterLocationfield in thestackdrivercustom resource to each log entry and metric before
they're routed to Google Cloud. Additionally, the logs and metrics are
associated with the Google Cloud project
specified in thestackdrivercustom resource spec (spec.projectID).
All metrics and log entries sent by stackdriver agents are routed to a global
ingestion endpoint. From there, the data is forwarded to the closest reachable
regional Google Cloud endpoint to ensure the reliability of the data transport.
After the global endpoint receives the metric or log entry, what happens next is
service-dependent:
How logs routing is configured: when the logging endpoint receives a log
message, Cloud Logging passes the message through the Log Router. The
sinks and filters in the Log Router configuration determine how to route
the message. You can route log entries to destinations like regional
Logging buckets, which store the log entry, or to
Pub/Sub. For more information about how log routing works and how to
configure it, seeRouting and storage
overview.
Neither theclusterLocationfield in thestackdrivercustom resource or
theclusterOperations.locationfield in the Cluster spec are considered in
this routing process. For logs,clusterLocationis used to label log
entries only, which can be helpful for filtering in Logs Explorer.
How metrics routing is configured: when the metrics endpoint receives a
metric entry, the entry is routed automatically to be stored in the location
specified by the metric. The location in the metric came from theclusterLocationfield in thestackdrivercustom resource.
Plan your configuration: when you configure your Cloud Logging and
Cloud Monitoring, configure Log Router and specify an appropriateclusterLocationwith locations that best support your needs.
For example, if you want logs and metrics to go to the same location, setclusterLocationto the same Google Cloud region that
Log Router is using for your Google Cloud project.
Update your configuration when needed: you can make changes anytime
to the destination settings for logs and metrics due to business requirements,
such as disaster recovery plans. Changes to the Log Router configuration in
Google Cloud take effect quickly. ThelocationandprojectIDfields in
theclusterOperationssection of the Cluster resource are immutable, so
they can't be updated after you create your cluster. We don't recommend that
you change values in thestackdriverresource directly. This resource is
reverted to the original cluster creation state whenever a cluster
operation, such as an upgrade, triggers a reconciliation.
Thestackdriverresource gets values for theclusterLocationandprojectIDfields from thestackdriver.clusterLocationandstackdriver.projectIDfields in theclusterOperationssection of the Cluster resource at cluster
creation time.
Use Cloud Logging
You don't have to take any action to enable Cloud Logging for a cluster.
However, you must specify the Google Cloud project where you want to view logs. In
the cluster configuration file, you specify the Google Cloud project in
thestackdriversection.
You can access logs using theLogs Explorerin the Google Cloud console. For example, to access a container's logs:
Open theLogs Explorerin Google Cloud console for your project.
Find logs for a container by:
Clicking on the top-left log catalog drop-down box and
selectingKubernetes Container.
Selecting the cluster name, then the namespace, and then a container
from the hierarchy.
View logs for controllers in the bootstrap cluster
In the Google Cloud console, go to thesegmentLogs Explorerpage:
You don't have to take any action to enable Cloud Monitoring for a cluster.
However, you must specify the Google Cloud project where you want to view metrics.
In the cluster configuration file, you specify the Google Cloud project in
thestackdriversection.
You can choose from over 1,500 metrics by using Metrics Explorer.
To access Metrics Explorer, do the following:
In the Google Cloud console, selectMonitoring, or use the
following button:
You can also view metrics in dashboards in the Google Cloud console. For information
about creating dashboards and viewing metrics, seeCreating dashboards.
View fleet-level monitoring data
For an overall view of your fleet's resource utilization using
Cloud Monitoring data, including your Google Distributed Cloud clusters, you can use
the Google Kubernetes Engine overview in the Google Cloud console. SeeManage clusters from the Google Cloud consoleto find out more.
Default Cloud Monitoring quota limits
Google Distributed Cloud monitoring has a default limit of 6000 API calls per minute for
each project. If you exceed this limit, your metrics may not be displayed.
If you need a higher monitoring limit,request one through the Google Cloud console.
Configure the Stackdriver custom resource
When you create a cluster, Google Distributed Cloudautomatically createsa Stackdriver custom resource. You can edit the spec in the custom resource to override the default values for CPU and memory
requests and limits for a Stackdriver component, and you can separately override the default storage size and storage class.
Override the default CPU and memory requests and limits for a Stackdriver component
Clusters with high pod density introduce higher logging and monitoring
overhead. In extreme cases, Stackdriver components may report close to the CPU
and memory utilization limit or even may be subject to constant restarts due to
resource limits. In this case, to override the default values for CPU and memory
requests and limits for a Stackdriver component, use the following steps:
Run the following command to open your Stackdriver custom resource in a
command-line editor:
Note that theresourceAttrOverridesection overrides all existing default
limits and requests for the component you specify. The following components
are supported byresourceAttrOverride:
By default, the metrics agents running in the cluster collect and report an
optimized set of container, kubelet and kube-state-metrics metrics to Google Cloud Observability (formerly Stackdriver). If you
require additional metrics, we recommend that you find a replacement
from the list ofGoogle Distributed Cloud metrics.
Here are some examples of replacements you might use:
Add thestorageSizeOverridefield under thespecsection. You can use the componentstackdriver-prometheus-k8sorstackdriver-prometheus-app. The section takes this format:
storageSizeOverride:STATEFULSET_NAME:SIZE
This example uses the statefulsetstackdriver-prometheus-k8sand size120Gi.
whereKUBECONFIGis the path to your kubeconfig file for the cluster. This can be either an admin cluster or user cluster.
Add thestorageClassNamefield under thespecsection:
storageClassName:STORAGECLASS_NAME
Note that thestorageClassNamefield overrides the existing default storage class, and applies to all logging and monitoring components with persistent volumes claimed. An example file looks like the following:
Google Cloud Managed Service for Prometheus is part of Cloud Monitoring and is available
as an option for system components. The benefits of Managed Service for Prometheus
include the following:
You can continue to use your existing Prometheus-based monitoring without
altering your alerts and Grafana dashboards.
If you use both GKE and Google Distributed Cloud, you can use the samePrometheus Query Language (PromQL)for metrics on all your clusters. You can also use thePromQLtab inMetrics Explorerin the Google Cloud console.
Enable and disable Managed Service for Prometheus
Starting with Google Distributed Cloud release 1.30.0-gke.1930,
Managed Service for Prometheus is always enabled. In earlier versions, you
can edit the Stackdriver resource,stackdriver, to enable or disable
Managed Service for Prometheus. To disable Managed Service for Prometheus
for cluster versions prior to 1.30.0-gke.1930, setspec.featureGates.enableGMPForSystemMetricsin thestackdriverresource tofalse.
View metric data
WhenenableGMPForSystemMetricsis set totrue, metrics for the following
components have a different format for how they are stored and queried in
Cloud Monitoring:
Configure Grafana dashboards with Managed Service for Prometheus
To use Grafana with metrics data from Managed Service for Prometheus, follow the steps inQuery using Grafanato authenticate and configure a Grafana data source to query data from Managed Service for Prometheus.
A set of sample Grafana dashboards are provided in theanthos-samplesrepository on GitHub. To install the sample dashboards, do the following:
Download the sample JSON files:
git clone https://github.com/GoogleCloudPlatform/anthos-samples.git
cd anthos-samples/gmp-grafana-dashboards
If your Grafana data source was created with a name different withManaged Service for Prometheus, change thedatasourcefield in all the JSON files:
sed -i "s/Managed Service for Prometheus/[DATASOURCE_NAME]/g" ./*.json
Replace[DATASOURCE_NAME]with the name of the data source in your Grafana that was pointed to the Prometheusfrontendservice.
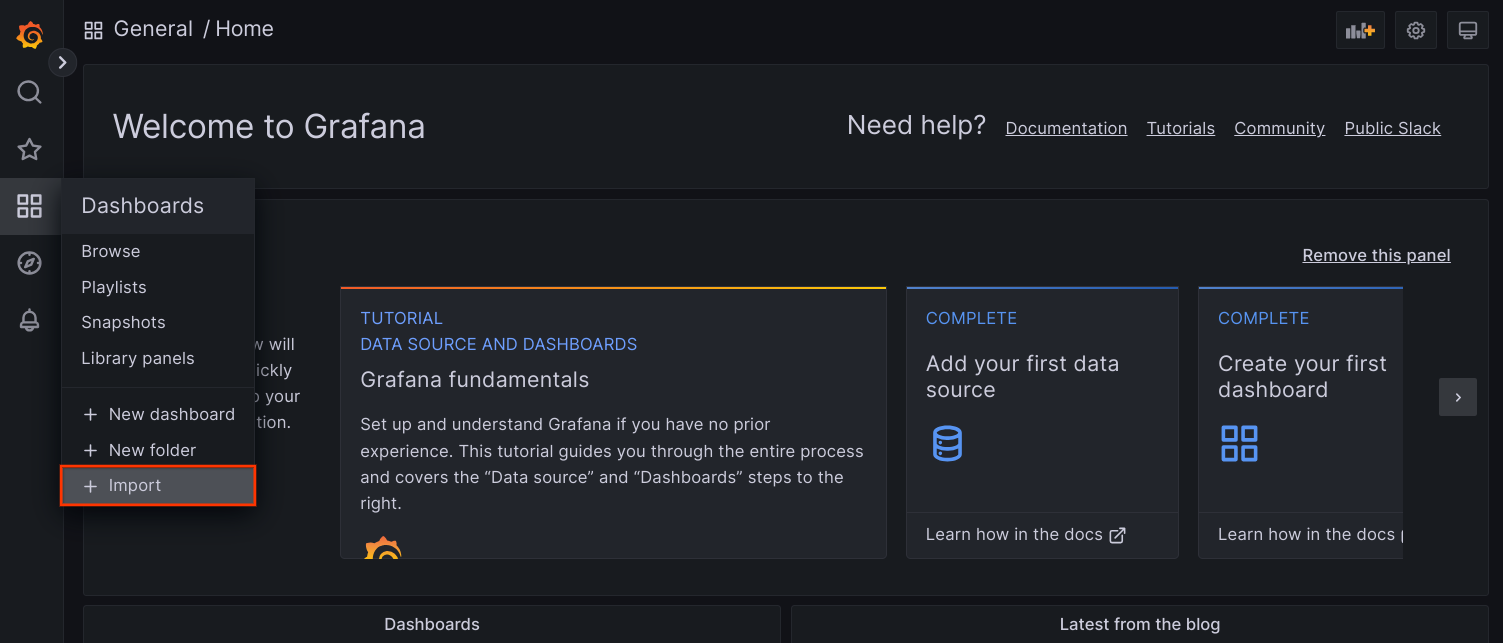
Access Grafana UI from your browser, and select+ Importafter theDashboardsmenu.
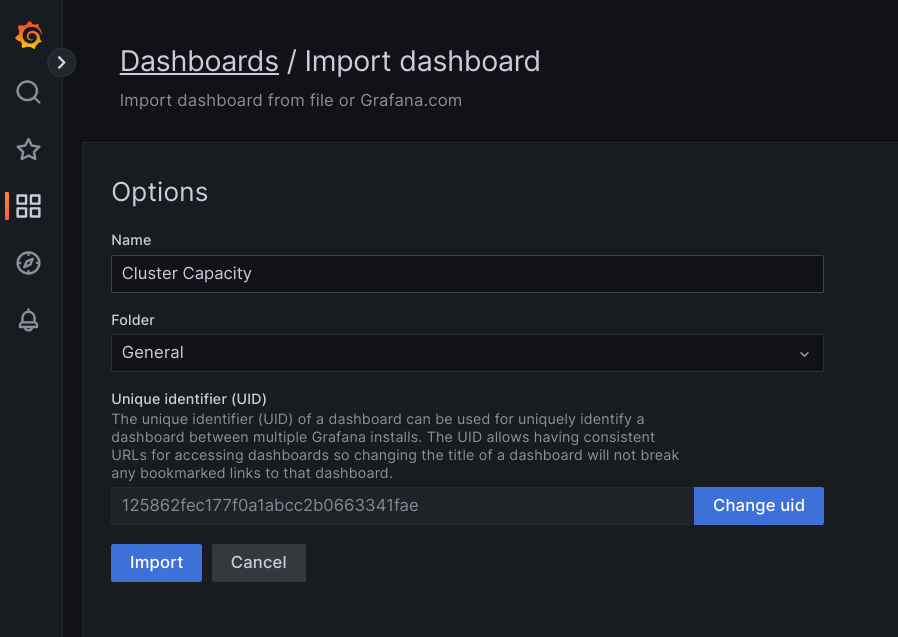
Either upload the JSON file, or copy and paste the file content and selectLoad. After the file content is successfully loaded, selectImport. Optionally you can also change the dashboard name and UID before importing.
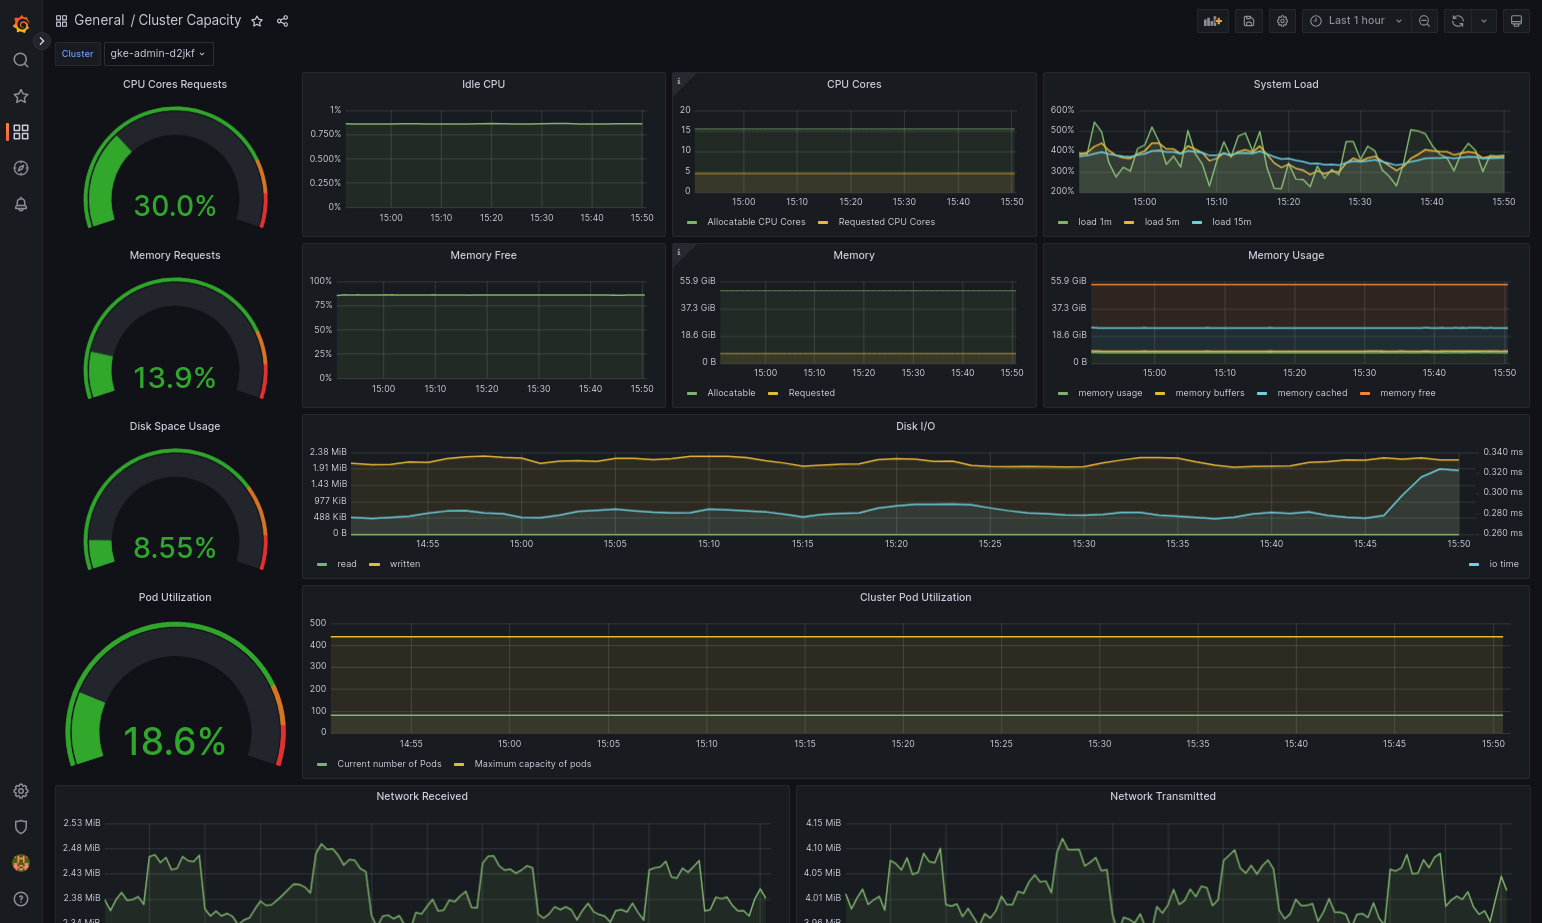
The imported dashboard loads successfully if your Google Distributed Cloud and the data source are configured correctly. For example, the following screenshot shows the dashboard configured bycluster-capacity.json.
Additional resources
For more information about Managed Service for Prometheus, see the following:
In user clusters, Prometheus and Grafana get automatically disabled during
upgrades. However, the configuration and metrics data are not lost.
To work around this issue, after the upgrade, openmonitoring-samplefor
editing and setenablePrometheustotrue.
Access monitoring metrics from Grafana dashboards
Grafana displays metrics gathered from your clusters. To view these metrics, you
need to access Grafana's dashboards:
Get the name of the Grafana Pod running in a user cluster'skube-systemnamespace:
kubectl --kubeconfig[USER_CLUSTER_KUBECONFIG]-n kube-system get pods
where[USER_CLUSTER_KUBECONFIG]is the user cluster's kubeconfig
file.
The Grafana Pod has an HTTP server listening on TCP localhost port 3000.
Forward a local port to port 3000 in the Pod, so that you can view Grafana's
dashboards from a web browser.
For example, suppose the name of the Pod isgrafana-0. To forward port
50000 to port 3000 in the Pod, enter this command::
From a web browser, navigate tohttp://localhost:50000.
On the login page, enteradminfor username and password.
If login is successful, you will see a prompt to change the password. After you have changed the default password, the user cluster's Grafana Home Dashboard should load.
To access other dashboards, click theHomedrop-down menu in the
top-left corner of the page.
Prometheus Alertmanager collects alerts from the Prometheus server. You can view
these alerts in a Grafana dashboard. To view the alerts, you need to access the
dashboard:
The container in thealertmanager-0Pod listens on TCP port 9093. Forward a
local port to port 9093 in the Pod:
From a web browser, navigate tohttp://localhost:50001.
Change Prometheus Alertmanager configuration
You can change Prometheus Alertmanager's default configuration by editing your
user cluster'smonitoring.yamlfile. You should do this if you want to direct
alerts to a specific destination, rather than keep them in the dashboard. You
can learn how to configure Alertmanager in Prometheus'Configurationdocumentation.
To change the Alertmanager configuration, perform the following steps:
Make a copy of the user cluster'smonitoring.yamlmanifest file:
You've deployed an application that exposes a metric, verified that the metric
is exposed, and verified that Prometheus scrapes the metric. Now you can add the
application-level metric to a custom Grafana dashboard.
To create a Grafana dashboard, perform the following steps:
From the Home Dashboard, click theHomedrop-down menu in the
top-left corner of the page.
From the right-side menu, clickNew dashboard.
From theNew panelsection, clickGraph. An empty graph dashboard
appears.
ClickPanel title, then clickEdit. The bottomGraphpanel opens
to theMetricstab.
From theData Sourcedrop-down menu, selectuser. ClickAdd
query, and enterfooin thesearchfield.
Click theBack to dashboardbutton in the top-right corner of the
screen. Your dashboard is displayed.
To save the dashboard, clickSave dashboardin the top-right corner
of the screen. Choose a name for the dashboard, then clickSave.
Disabling Prometheus and Grafana
Starting from version 1.16, Prometheus and Grafana are no longer controlled by
theenablePrometheusfield in themonitoring-sampleobject.
SeeUsing Prometheus and Grafanafor details.
Example: Adding application-level metrics to a Grafana dashboard
The following sections walk you through adding metrics for an application. In
this section, you complete the following tasks:
Deploy an example application that exposes a metric calledfoo.
Verify that Prometheus exposes and scrapes the metric.
Create a custom Grafana dashboard.
Deploy the example application
The example application runs in a single Pod. The Pod's container exposes a
metric,foo, with a constant value of40.
To verify that Prometheus is scraping the metric, navigate to
http://localhost:50003/targets, which should take you to theprometheus-0Pod under theprometheus-io-podstarget group.
To view metrics in Prometheus, navigate to http://localhost:50003/graph.
From thesearchfield, enterfoo, then clickExecute. The page should
display the metric.
Known issue: Cloud Monitoring error condition
(Issue ID 159761921)
Under certain conditions, the default Cloud Monitoring pod,
deployed by default in each new cluster, can become unresponsive.
When clusters are upgraded, for example, storage data can become
corrupted when pods instatefulset/prometheus-stackdriver-k8sare restarted.
Specifically, monitoring podstackdriver-prometheus-k8s-0can be
caught in a loop when corrupted data preventsprometheus-stackdriver-sidecarwriting to the cluster storagePersistentVolume.
You can manually diagnose and recover the error following the steps below.
Diagnose the Cloud Monitoring failure
When the monitoring pod has failed, the logs will report the following:
{"log":"level=warn ts=2020-04-08T22:15:44.557Z caller=queue_manager.go:534 component=queue_manager msg=\"Unrecoverable error sending samples to remote storage\" err=\"rpc error: code = InvalidArgument desc = One or more TimeSeries could not be written: One or more points were written more frequently than the maximum sampling period configured for the metric.: timeSeries[0-114]; Unknown metric: kubernetes.io/anthos/scheduler_pending_pods: timeSeries[196-198]\"\n","stream":"stderr","time":"2020-04-08T22:15:44.558246866Z"}
{"log":"level=error ts=2020-04-08T22:15:44.663Z caller=main.go:603 err=\"corruption after 29032448 bytes: unexpected non-zero byte in padded page\"\n","stream":"stderr","time":"2020-04-08T22:15:44.663707748Z"}
{"log":"level=info ts=2020-04-08T22:15:44.663Z caller=main.go:605 msg=\"See you next time!\"\n","stream":"stderr","time":"2020-04-08T22:15:44.664000941Z"}
Recover from the Cloud Monitoring error
To recover Cloud Monitoring manually:
Stop cluster monitoring. Scale down thestackdriveroperator to prevent monitoring reconciliation:
[[["Easy to understand","easyToUnderstand","thumb-up"],["Solved my problem","solvedMyProblem","thumb-up"],["Other","otherUp","thumb-up"]],[["Hard to understand","hardToUnderstand","thumb-down"],["Incorrect information or sample code","incorrectInformationOrSampleCode","thumb-down"],["Missing the information/samples I need","missingTheInformationSamplesINeed","thumb-down"],["Other","otherDown","thumb-down"]],["Last updated 2026-05-01 UTC."],[],[]]