
In Cloud Billing cost reports , you can use the forecast feature to see how your costs are trending and how much you're projected to spend, up to 12 months in the future.
If you're viewing your Cloud Billing report using a date range that ends in a future date, your Cloud Billing report chart displays both actual costs and forecasted costs:
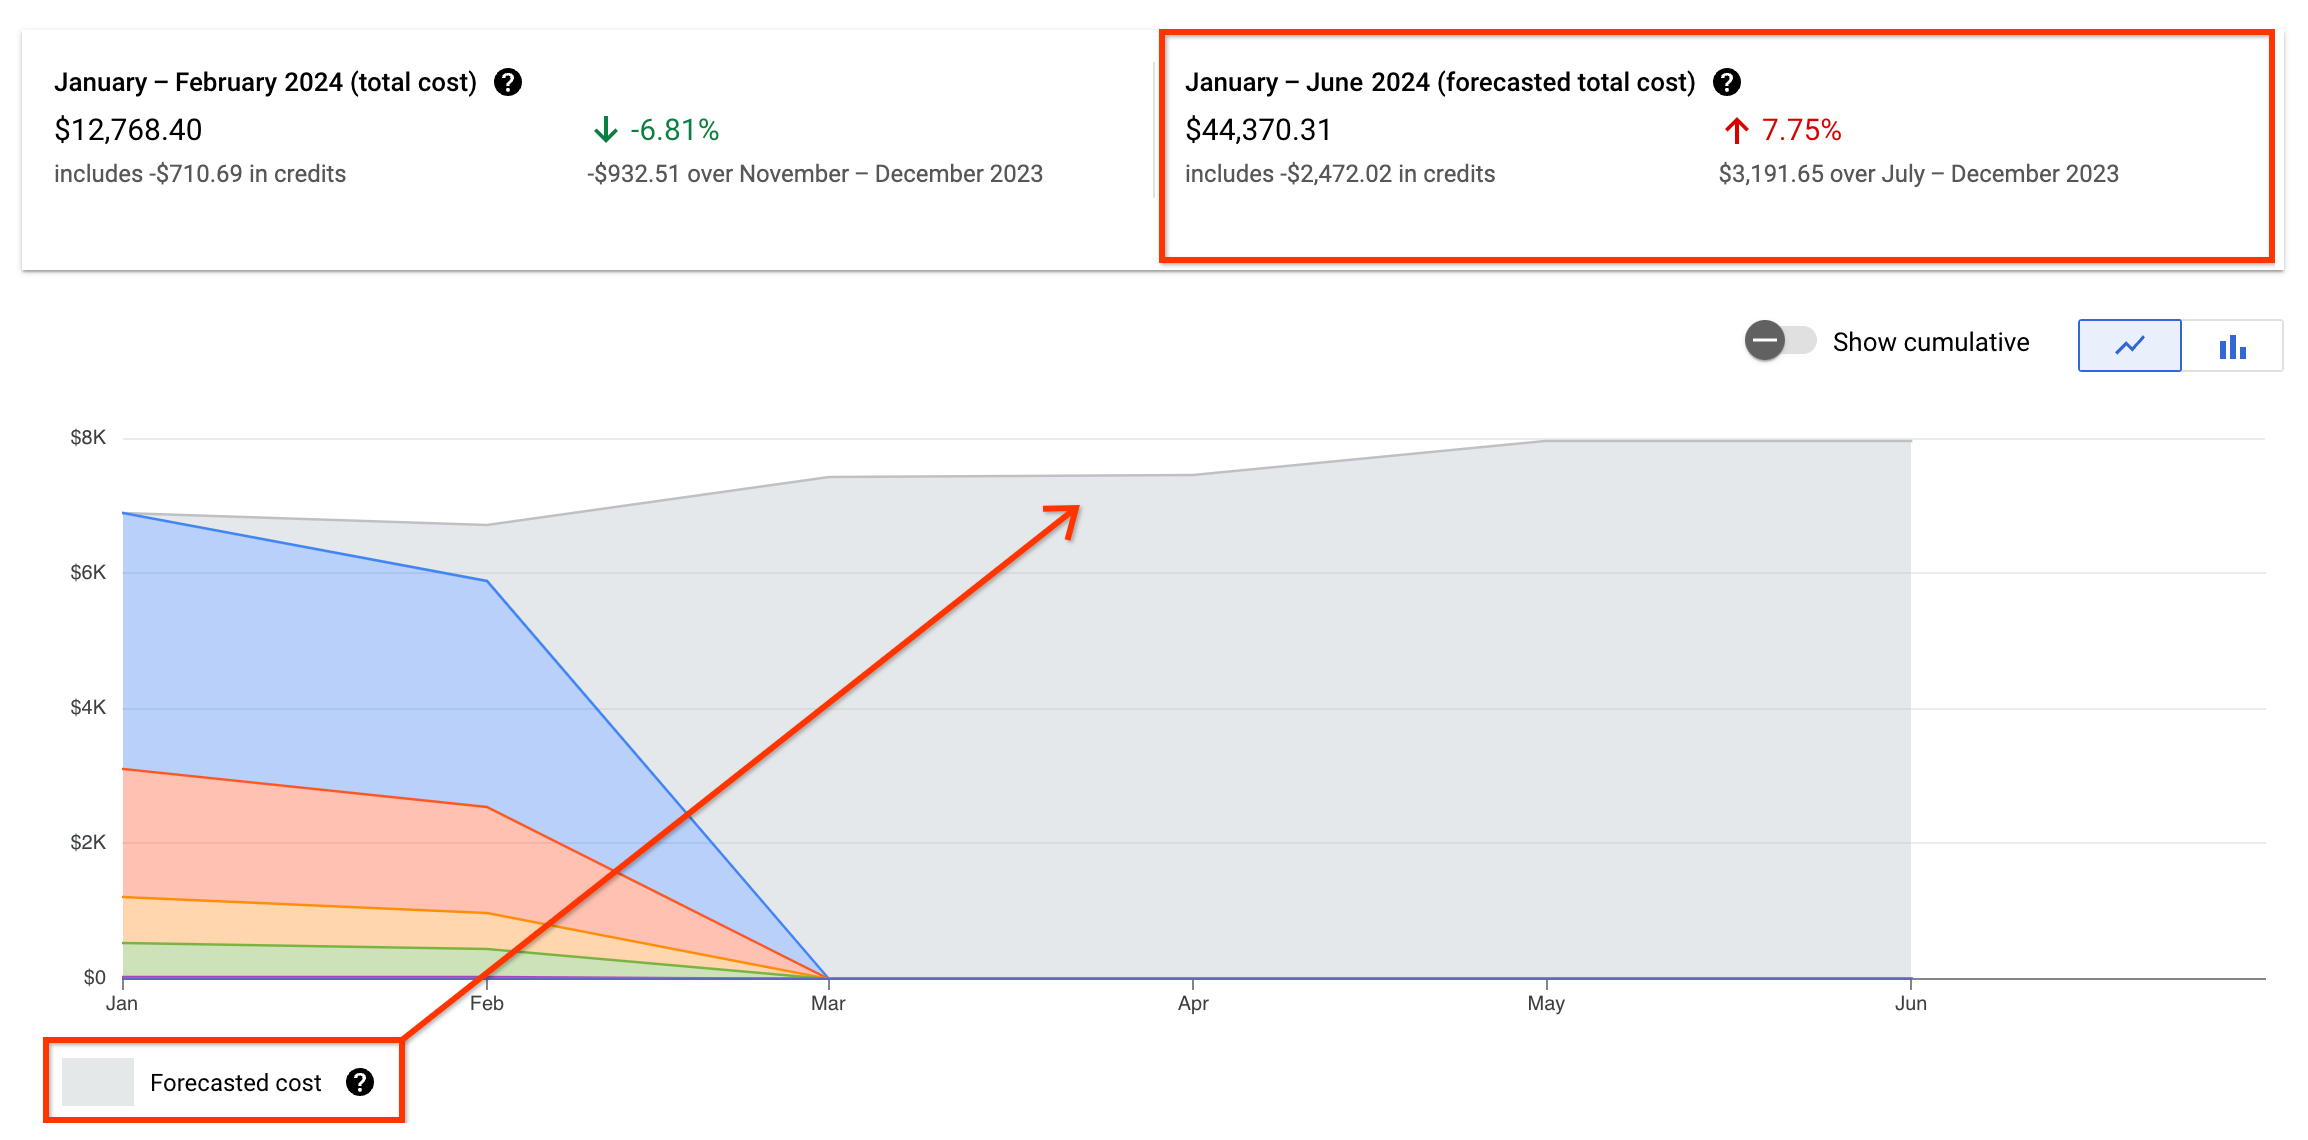
- The report header above the chart provides a split view of cost: actual cost-to-date calculated from the starting date, and the total forecasted cost for the entire date range.
- Your forecasted cost is indicated in the chart using light grey in the stacked bar or line chart.
How to view your cost forecasts
In the Billingsection of the Google Cloud console, access the cost report for the Cloud Billing account you want to analyze.
In reports, forecasts are available for:
- Any combination of filters (except for an Invoice month Time range).
-
Any Usage date Time rangethat ends with a future date. (Forecasts aren't available for an Invoice month Time range.)
- If you're viewing the report for the Current monthtime range, the default end date is the last day of the current month .
-
If you choose to specify a custom time range, select Usage date, and configure a date range with the To:date set for a future date.
You can see your forecasted spend up to 12 months in the future.
The cost prediction is driven by AI
The cost forecasting model applies advanced machine learning techniques designed to understand complex cost patterns and handle real-world data imperfections to provide you with more reliable and actionable cost predictions. The cost trend is determined by:
- Gathering historical data: Based on the report filters you select, the forecasting model collects all of your historical Google Cloud spend.
- Smart data preparation: Using a comprehensive suite of data pre-processing steps, high-quality data is prepared that intelligently handles outlier costs (such as unexpected cost spikes), more accurately fills in gaps in usage data, and detects significant shifts in your spending patterns to adapt the forecast accordingly (for example, due to new project launches or major architectural changes).
- Accounting for seasonality and trends: The machine learning engine is designed to recognize and adapt to multiple layers of seasonality and underlying trends in your cost data, detecting and modeling various recurring patterns, such as daily, weekly, and monthly cycles in your cloud spend.
- Comprehensive data regularization: The forecasting model consistently structures your cost data over time, enabling reliable time-series analysis by our machine learning models. This generates a forecast that intelligently captures complex trends, multiple seasonalities, and handles data anomalies.
The total forecasted cost combines the following costs:
- The total actual cost to date for the selected time period.
- The predicted cost for each future day in the selected time period.