
This page introduces you to data exploration with Looker. Read the following sections to learn about these Looker concepts:
- How to find Explores in Looker
- How to use Quick Start analyses as a starting point for Explores
- How to add fields to Explores
- How to use the field picker
- How to remove fields
- How to sort data
- How to pivot data
- How to reorder columns
- How to display totals
- How to view an estimate of the cost of the query
- How to use the features that are available to developers
- How to use the Explore query tracker
For more information about the components on the Explore page and interacting with Explore data, visit the Viewing and interacting with Explores documentation page.
Explores are the starting point for exploration
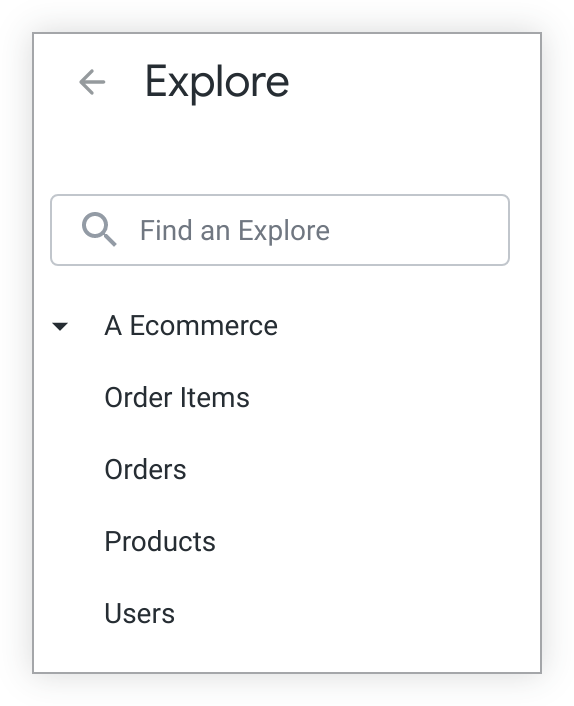
An Explore is a starting point for a query that is designed to explore a particular subject area. To open the Exploremenu, select the Exploreoption from the main navigation panel .
The Exploremenu presents a number of descriptive model or group names that are organized in alphanumeric order. From the Exploremenu, you can search for and select Explores, which are organized alphanumerically under the model or group name to which they belong.
For example, if you operate an ecommerce store, you would use the Exploremenu to find models or groups that contain Explores that let you view your ecommerce store data.
You can display a list of Explores by expanding or collapsing a model or group name within the Exploremenu. You can open an Explore page by selecting the name of an Explore.
For example, the A Ecommercestore model includes the Explores Order Items(the products that are associated with an order), Orders(purchase events), Products(information about inventory products), and Users(individuals who are associated with purchase events). When you have questions about items that are associated with an order, you might want to select the Order ItemsExplore.
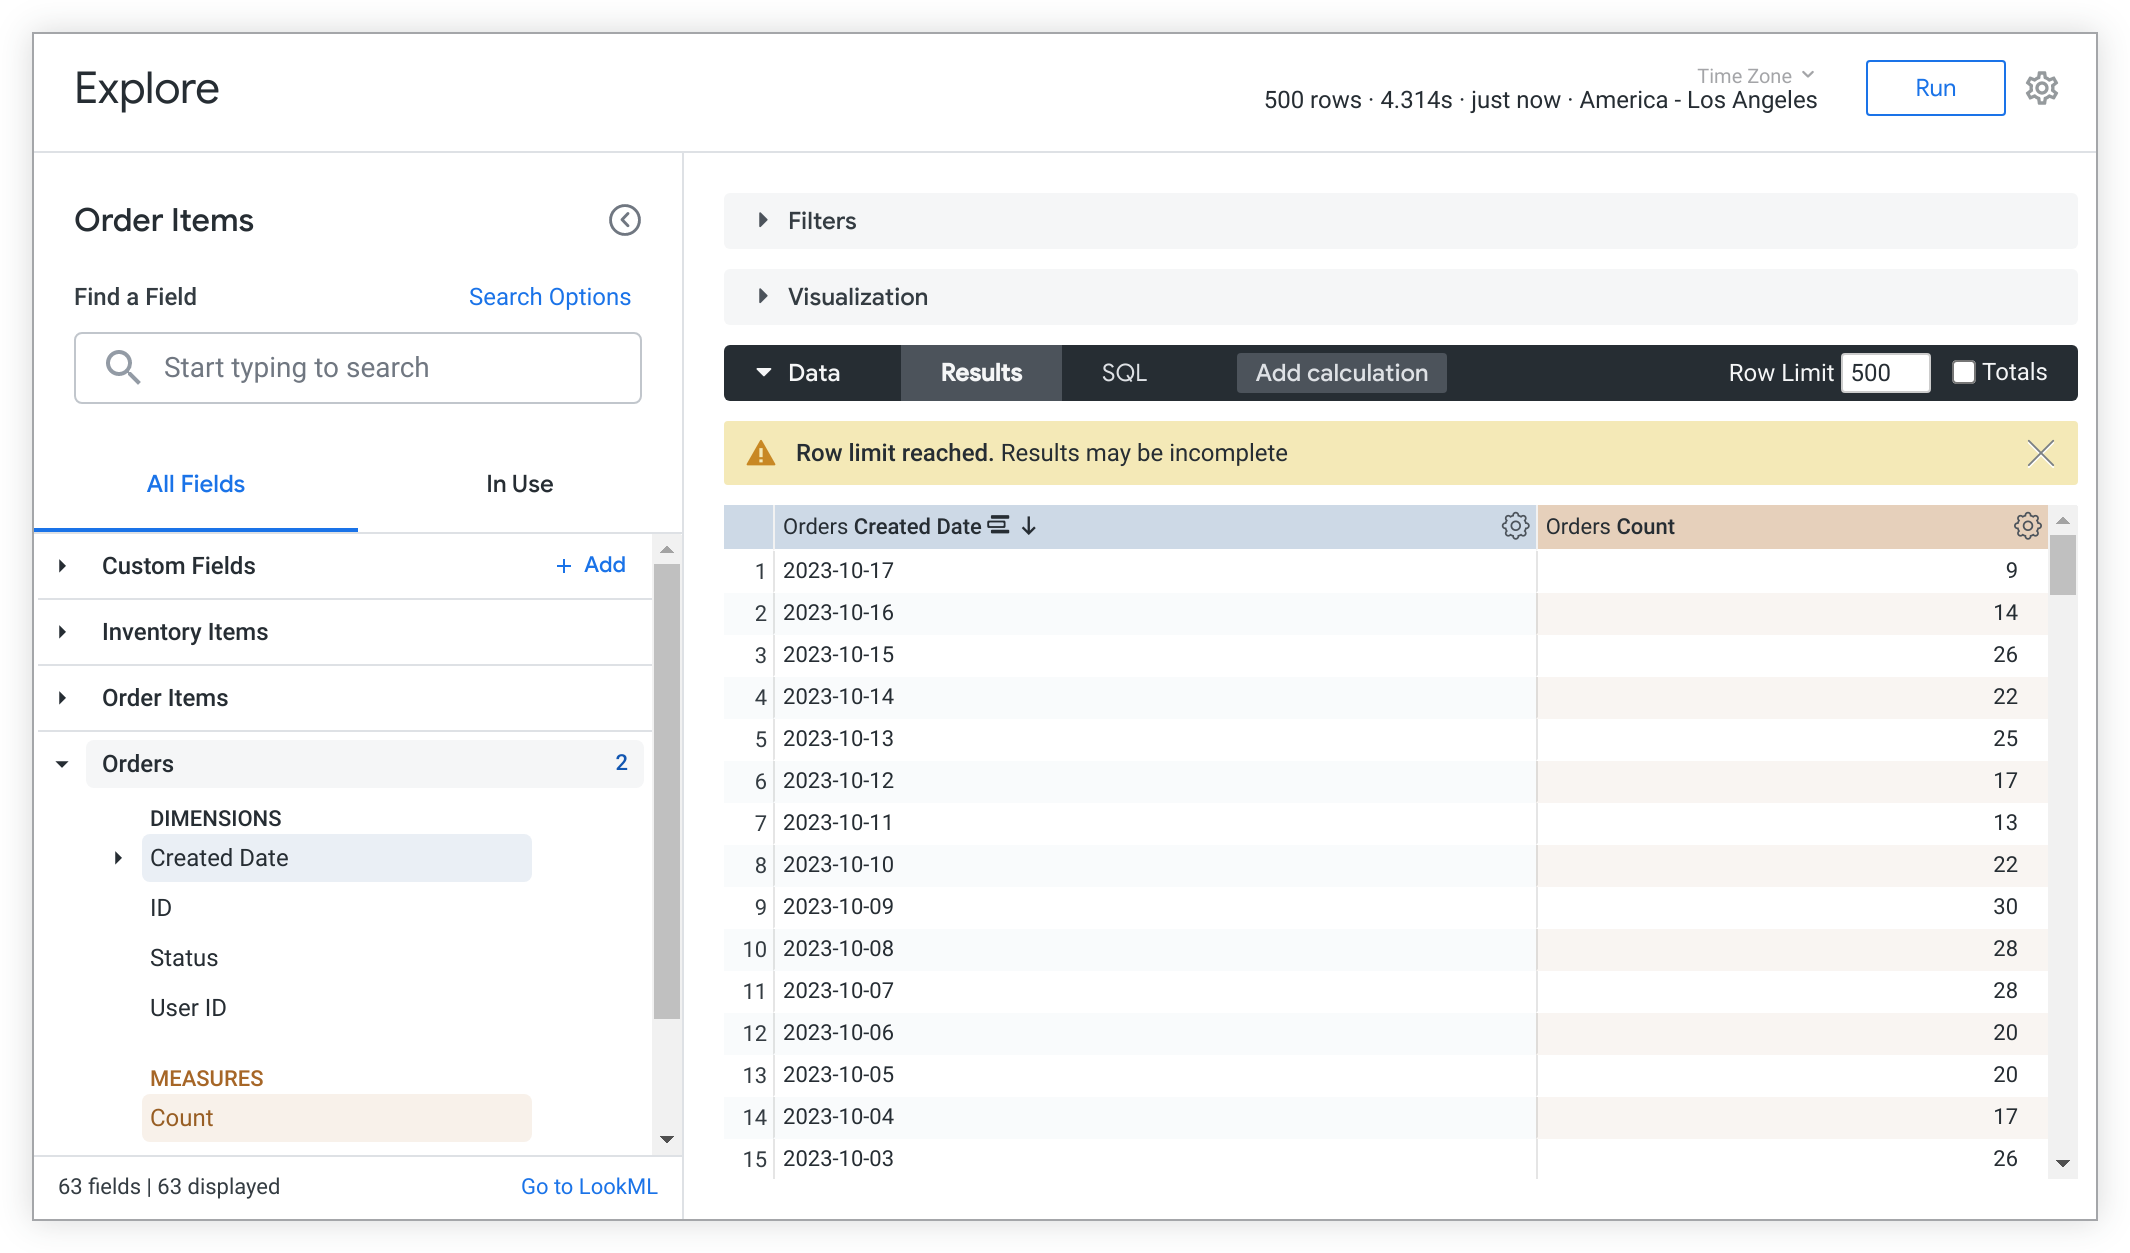
Explores contain views , which are groupings of dimensions and measures. The data that is shown in an Explore is determined by the dimensions and measures that you select from the views that are listed in the field picker at the left. A dimension can be thought of as a group or a bucket of data. A measure is information about that bucket of data. In the Explore data table, dimensions appear as blue columns and measures appear as orange columns.
For example, to display the number of orders that are placed per day, a user can select the dimension Created Dateand the measure Countfrom the Ordersview in the Order ItemsExplore.
If an Explore contains modeled queries , you can use Quick Start analyses to populate fields. The next section provides an in-depth overview of Quick Start analyses and how to use them as a starting point for exploring data.
Quick Start analyses
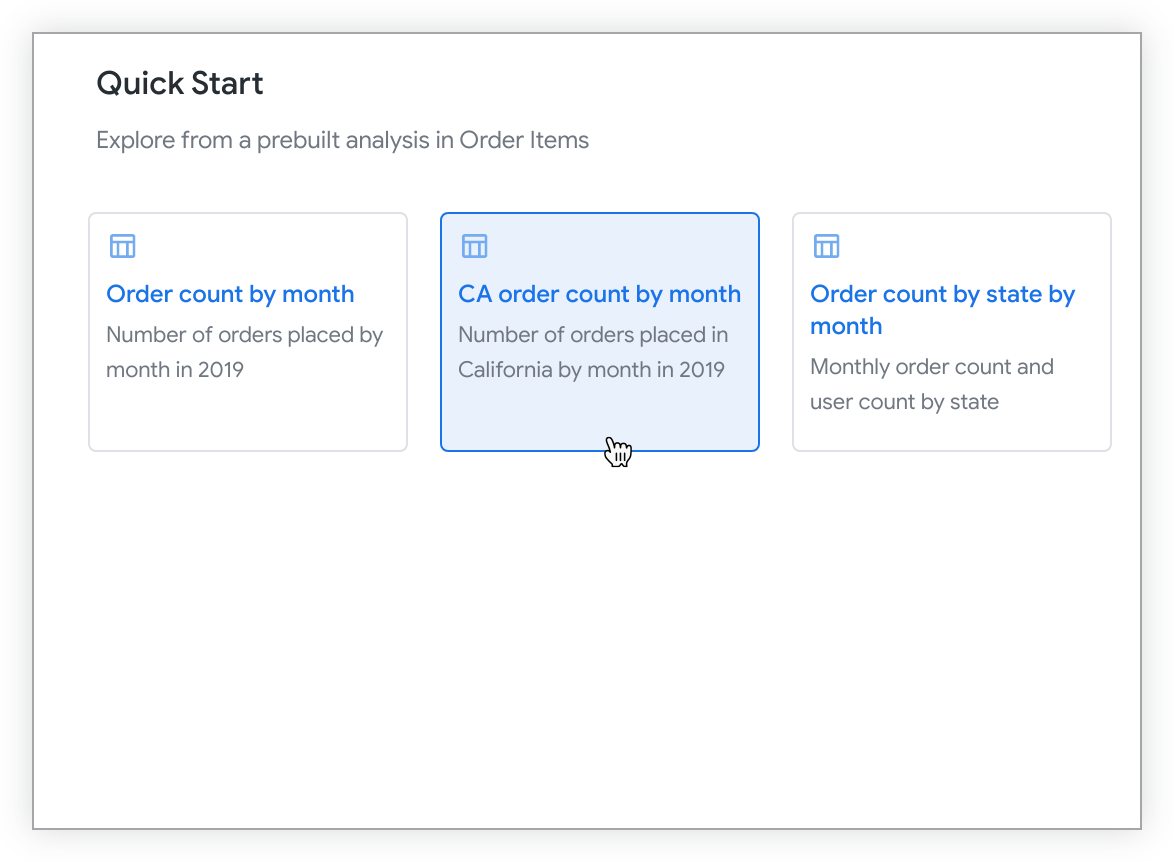
Modeled queries are available as Quick Start analysis options in Explores. Quick Start analyses provide a helpful starting point for quickly running and building analyses.
Quick Start analyis cards are displayed to the right of the field picker in a blank Explore. Each Quick Start analysis card displays the name of the analysis and, when available, a description .
More information on how developers can model prebuilt analyses for users is available on the query
parameter documentation page.
Choosing a Quick Start option from a blank Explore
To run a Quick Start analysis, select the analysis option that you want to explore. The query will automatically run and display results, including the visualization.
You can modify a Quick Start analysis once it has run by adding or removing fields from the All Fields tab, from Search results, or from the In Use tab in the field picker .
Choosing a Quick Start option once an Explore has run
Once an Explore has finished running, you can select a new Quick Start analysis by selecting the Quick Startlightning bolt icon next to the Explore name.
Selecting this icon opens the Quick Startmenu that displays the available analysis cards.
Selecting a Quick Start analysis from the menu runs the analysis and replaces all the previous Explore results except the existing filters.
Quick Start filter behavior
Filters are additive. This means that, when run, Quick Start analyses will include any existing Explore filters. If a selected Quick Start analysis has a filter value that conflicts with an existing Explore filter, you will be prompted to select which filter value to use in the analysis.
For example, you are viewing the results of an Explore query that include these filters:
- Orders Created Dateis in the year "2019".
- Orders Statusis equal to "complete".
- Users Stateis equal to "Washington".
You want to select a new Quick Start analysis called CA order count by monththat will display the number of orders placed in California by month in the year 2019.
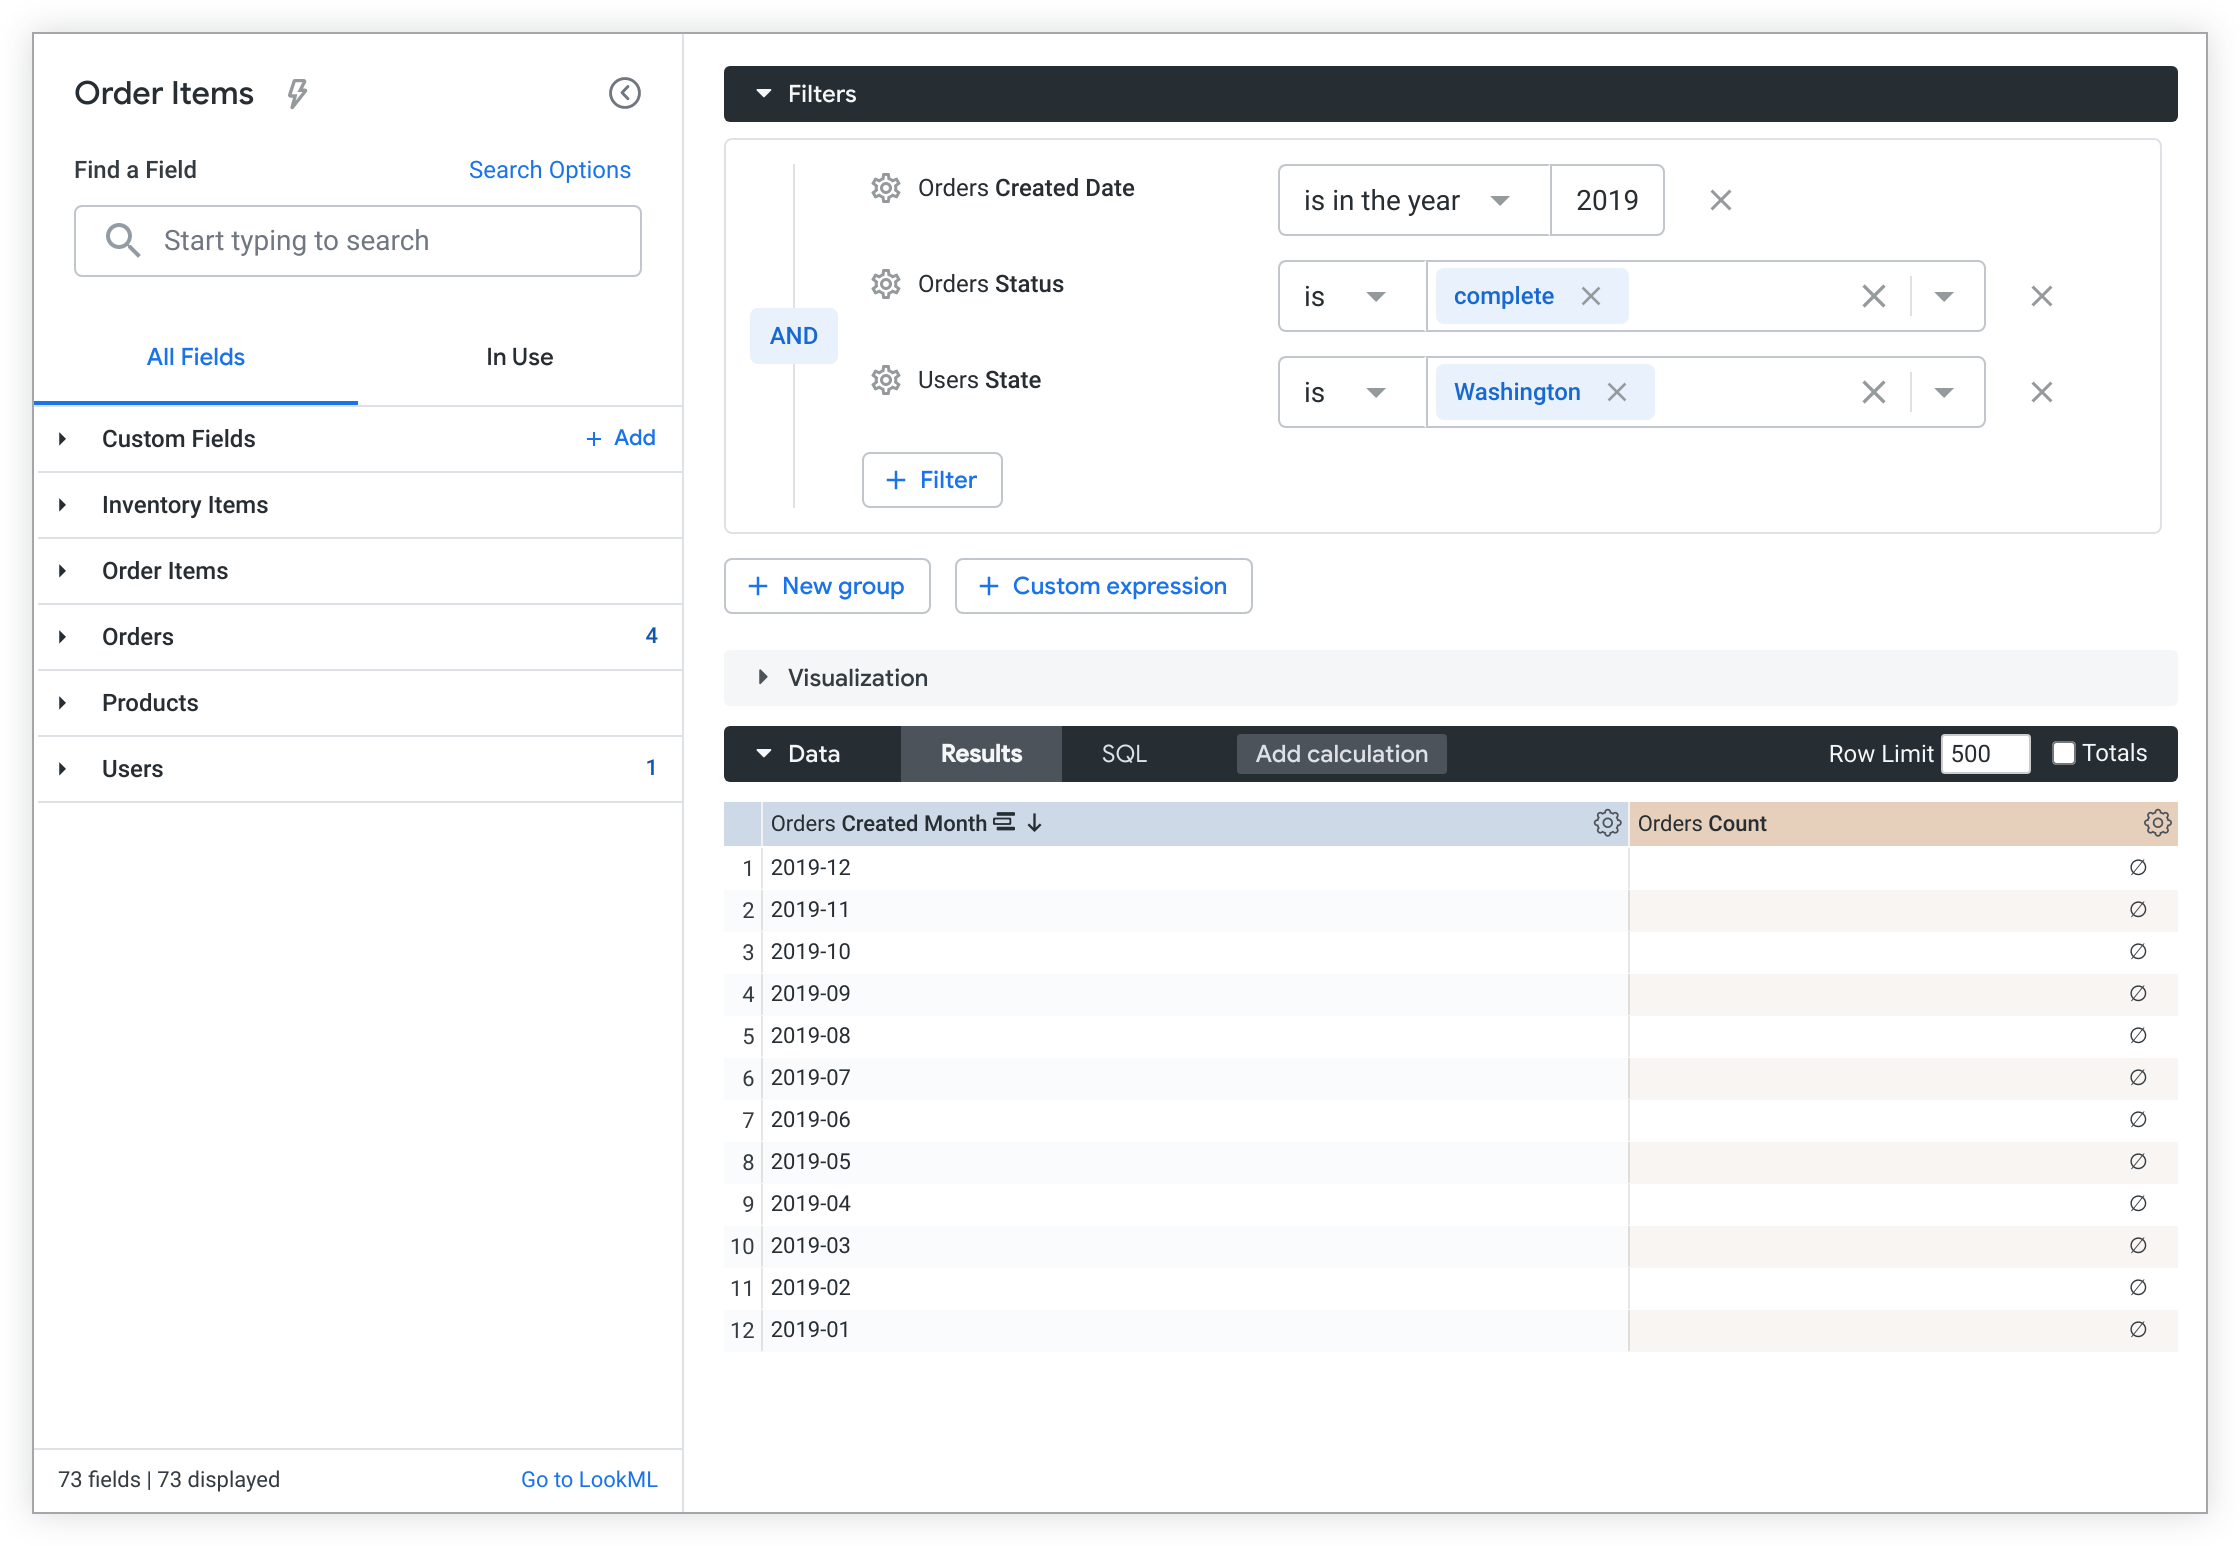
You select the Quick Startlightning bolt icon to open the Quick Start menu and select the CA order count by monthanalysis option:
The CA order count by monthanalysis has a conflicting filter value for the Users Statefilter. The Choose filter setmenu opens, and you're prompted to resolve the conflict by selecting either the Keep current filtersoption, which lists the current filter values, or the Replace with new filtersoption, which lists the filter values of the selected Quick Start analysis.
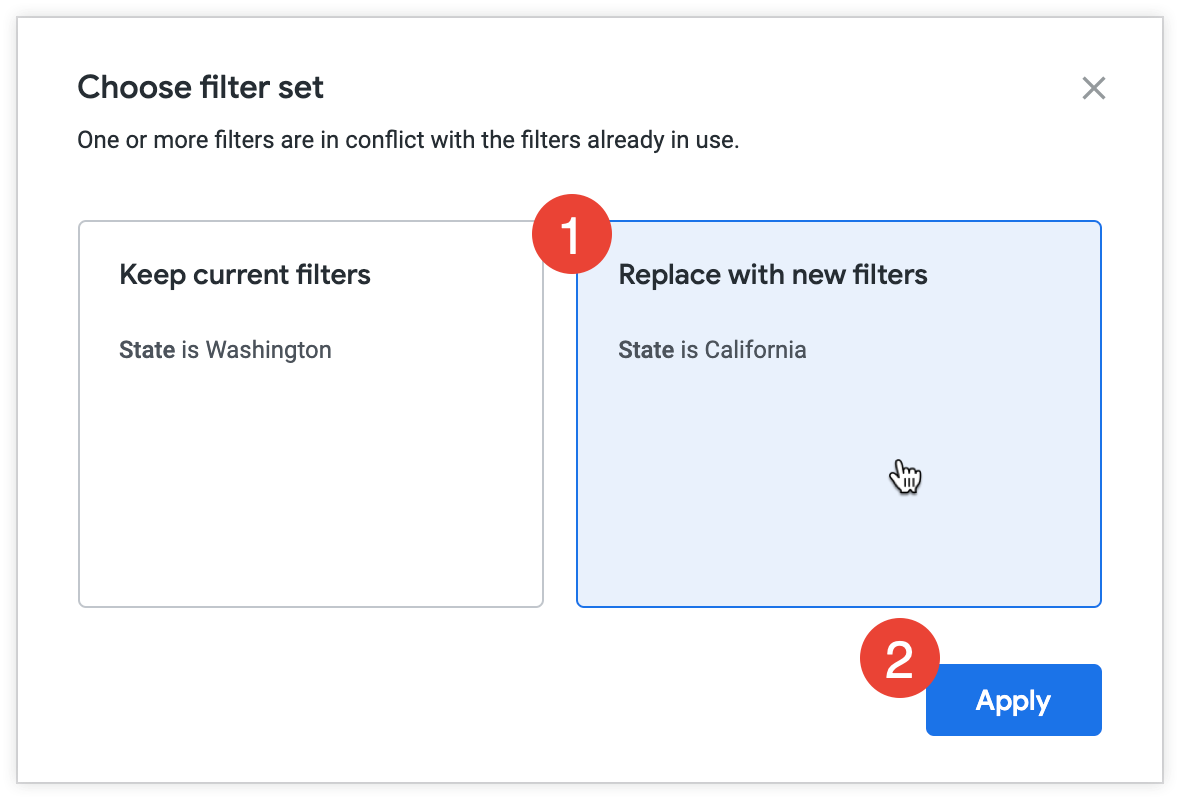
To resolve the conflict in the Choose filter setmenu, follow these steps:
- Choose an option.
- Choose Keep current filtersto run the new analysis with the existing filter value ( Users Stateis equal to "Washington" in this case).
- Choose Replace with new filtersto run the new analysis with its prebuilt filter condition ( Users Stateis equal to "California" in this case).
- Select Applyto confirm the selection and run the analysis.
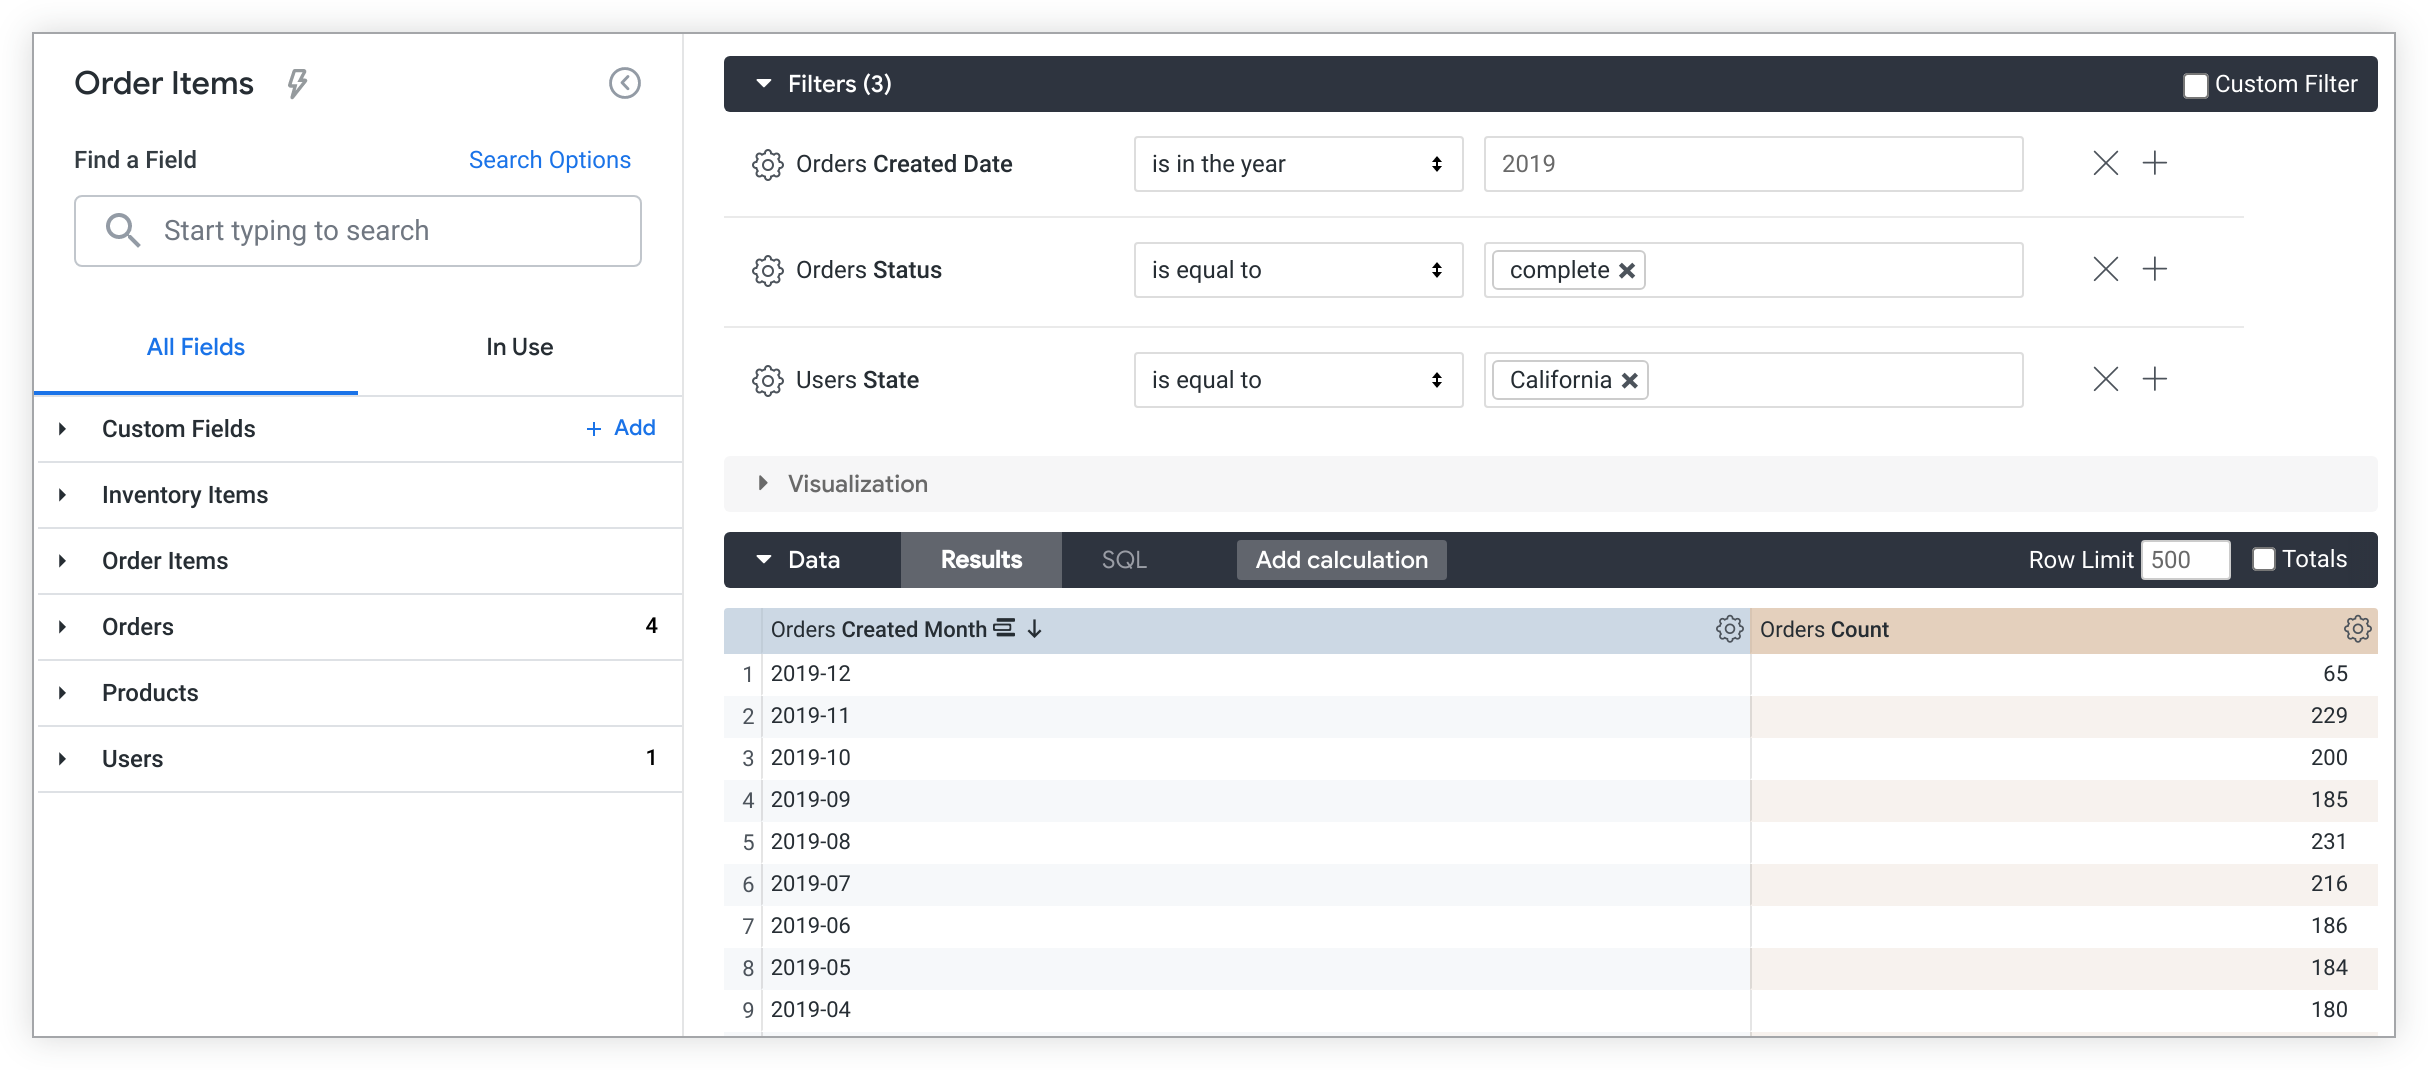
The Explore runs with the updated Users Stateis equal to "California" filter condition, and it includes any existing non-conflicting filters ( Orders Created Dateis in the year "2019" and Orders Statusis equal to "complete").
Adding more dimensions for more detail
Whether you added fields to your Explore manually or by selecting a Quick Start option, you can add more dimensions to learn more about your data.
To add a field, follow these steps:
- Select a field from the field picker to add it to the query.
- Select the Runbutton to re-run the query.
For example, selecting the Orders Statusdimension in an Explore that contains Orders Created Dateand Orders Countwill display the order number of orders that have the status complete, pending, or canceled by day.
Field picker
The field picker, which is located on the left side of the Explore page, includes the following elements from top to bottom:
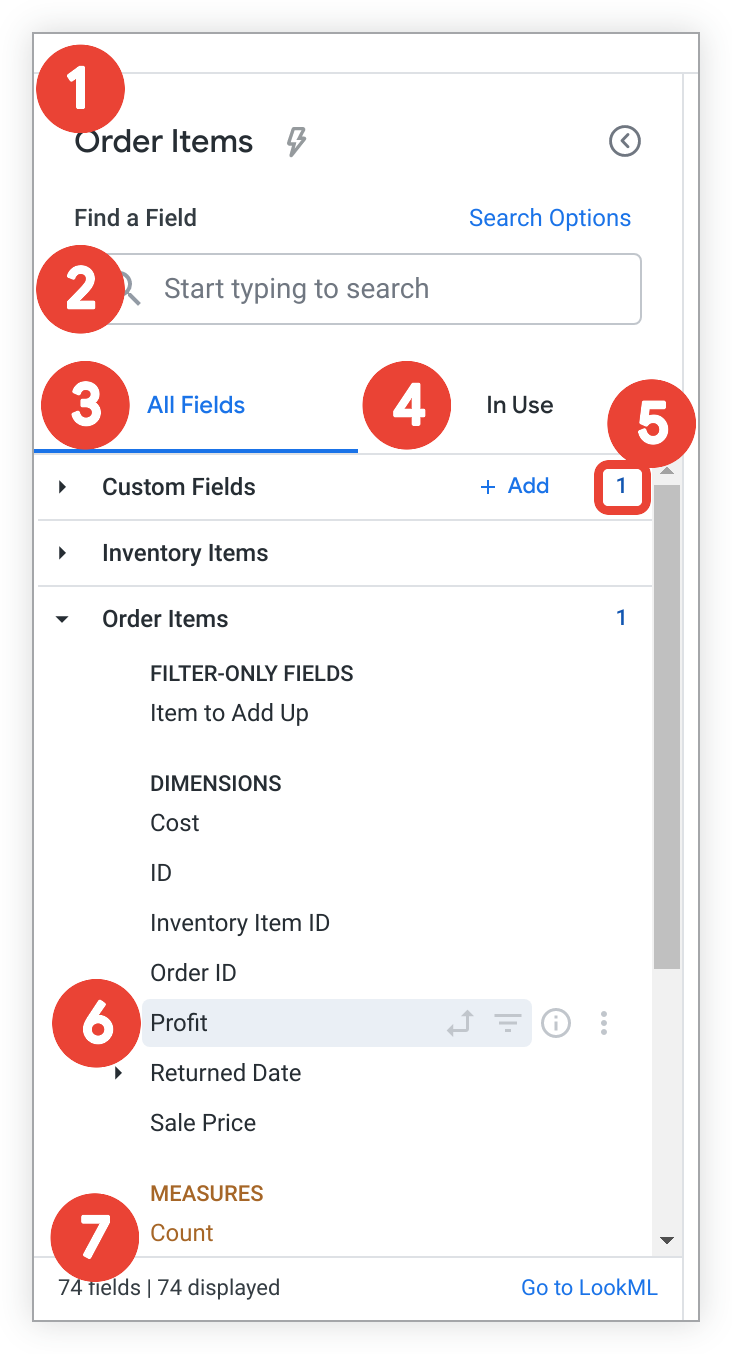
- The Explore name displays the name of the current Explore. The Quick Startlightning bolt icon will also appear for Explores that have modeled queries , which lets you access Quick Start analysis options after an Explore has run.
- The Find a Fieldsearch bar
lets users search for fields that match specific terms and criteria.
- To change the scope of your search, click Search Options. You can limit your search to field labels , field descriptions , group labels , or view labels .
- The All Fieldstab displays all available fields for an Explore.
- The In Usetab displays all Explore fields that are in use.
- The view level summary displays the total number of selected fields from a view. This number is shown when a view is collapsed, and when it is expanded.
-
The field-specific information and actions icons display a field's current and potential functions in an Explore query, as well as more details about a field.
-
The Explore summary displays the total number of fields in an Explore (including custom fields and table calculations when permissions allow) in the bottom left corner, and the Go to LookMLlink in the bottom right. Go to LookMLdirects users to the
exploredefinition in its LookML project. This link is visible only to users with thesee_lookmlpermission.
Field-specific information and actions
The icons next to each field provide more information about the field and indicate the available options for that field. The icons are visible when you hold the pointer over a field.
You can select an icon to perform several changes to a query with a field depending on the field's data type, including filtering or pivoting by a field. You can also use icons to information about a field, or — when permissions allow — to create a custom field that is based on the field.
These icons appear on the All Fields and In Use tabs.
The available icons and functions include the following:
- Pivot dataicon
 — Select this icon to pivot or unpivot a field in an Explore. This icon will appear gray when a field is not pivoted and bold when a field is pivoted.
 -
Filter by fieldicon — Select this icon to filter query results by a field, or to remove a field as a filter. This icon will appear gray when a field is not an active filter and bold when it is an active filter.
-
Infoicon info — Select this icon to open a tooltip to learn more information about a field:
- The tooltip will display the field's data type, description
(when available), and LookML field name (in
view_name.field_namesyntax) for all users. - For users with the
see_lookmlpermission, the tooltip will include the definition of the LookML field'ssqlparameter, as well as a link to navigate to that field in the LookML project.
- The tooltip will display the field's data type, description
(when available), and LookML field name (in
-
The three-dot Moremenu is available to users in certain cases:
- When a user has the
create_custom_fieldspermission. - When a dimension group is selected in the Explore query. The three-dot Moremenu will appear for dimension groups on the In Use tab.
Users with the
create_custom_fieldspermission can use the three-dot Moremenu to quickly create custom fields depending on a field's type. - When a user has the
All Fields tab
When you open an existing Explore, the All Fieldstab is displayed by default. This tab is the starting place for building an Explore and displays all the available fields that you can select for a query. Fields are organized alphanumerically by type (dimensions, followed by measures) under the name of the view or view label in which they are defined. Each field will show field-specific information and actions , such as a field's current and potential functions in an Explore query.
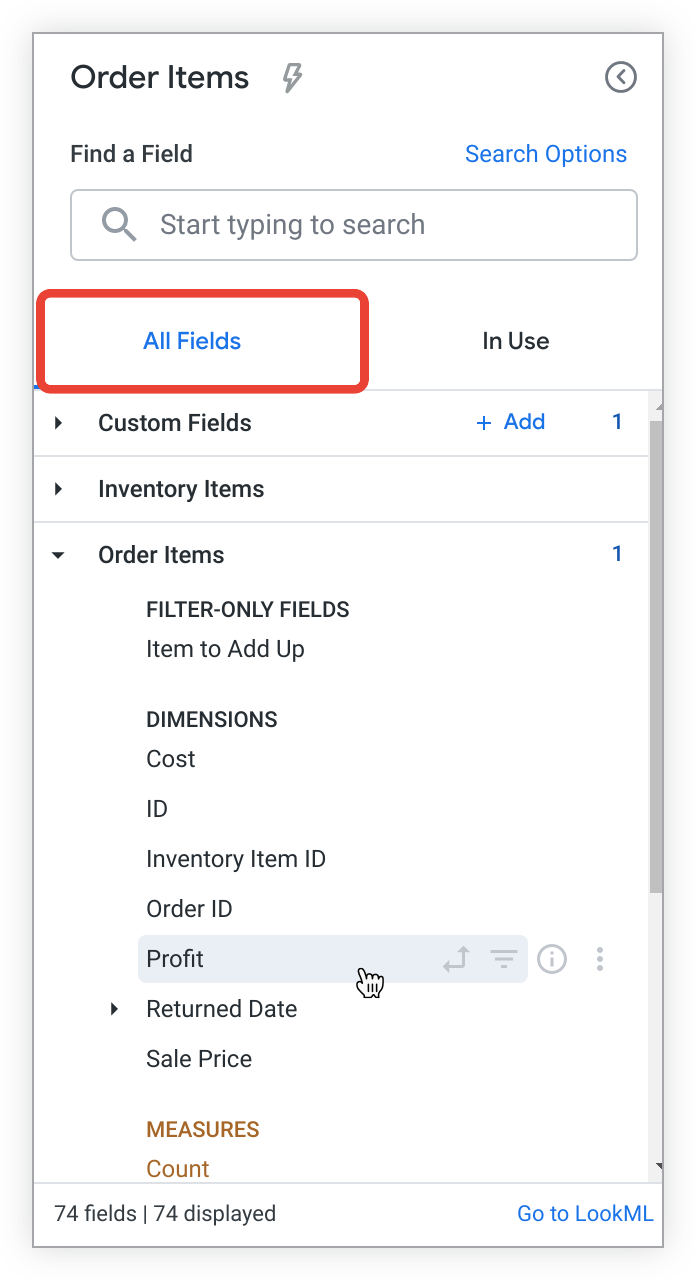
Fields that are selected in a query will appear highlighted by a gray background and corresponding field icons (pivot, filter) will appear in bold without you needing to hold the pointer over a field when it is active. For example, the field Profitin the preceding field picker example is highlighted in gray, indicating that it is selected. You can tell that this field is not pivoted or filtered because all corresponding field icons are not bold and don't appear when you aren't holding the pointer over the field.
Select a field from the All Fieldstab to add it to or remove it from an Explore query. Additionally, you can select the appropriate field icon to filter, pivot, or perform other field-specific actions from the All Fieldstab.
Custom fields
and table calculations
are listed under the Custom Fieldsview label. Users with the create_table_calculations
permission can create and edit table calculations, and users with the create_custom_fields
permission can create and edit custom fields by selecting the Addbutton next to the view label, or by choosing a custom field option from a field's three-dot More
menu.
In Use tab
The In UseTab shows all fields that are active in an Explore, organized alphanumerically by view or view label , and whether they are dimensions or measures:
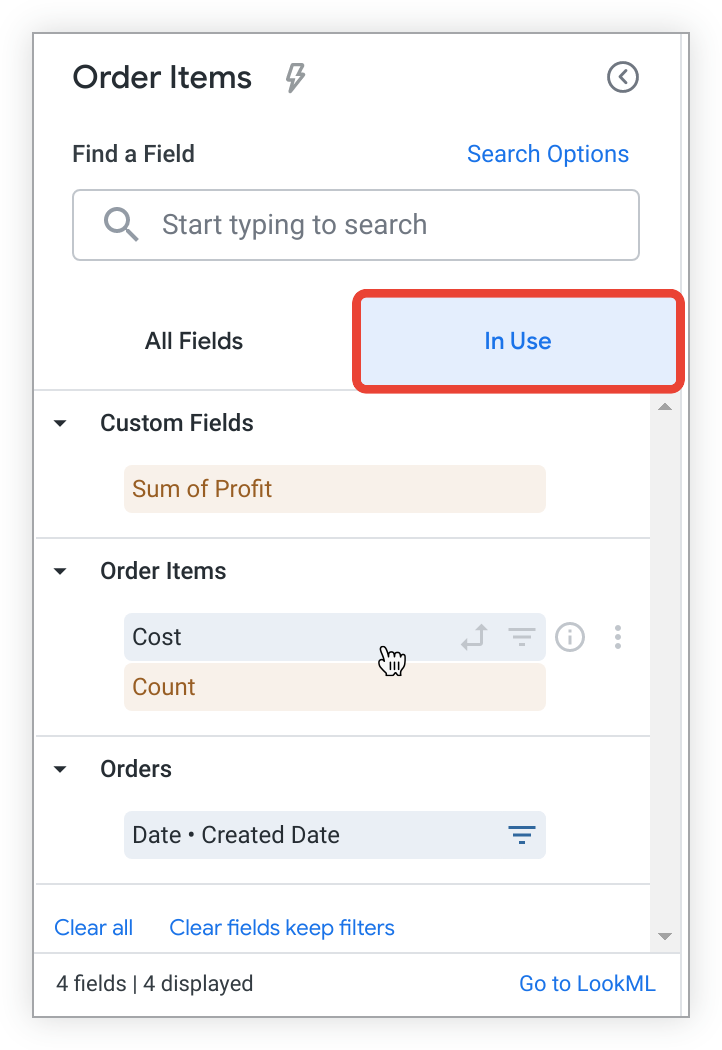
The In Usetab also displays an updated Explore summary at the bottom of the tab. The bottom left corner displays the total number of active fields in an Explore. A Go to LookMLlink is available in the bottom right to users with the see_lookml
permission. Go to LookMLdirects users to the explore
definition in its LookML project. The preceding example shows that there are four total active fields in the Explore.
Removing fields from the In Use tab
When a field is in use, you can remove it from an Explore by selecting the field's name from the field picker.
You can also remove all selected fields (including custom fields and table calculations) by selecting Clear all, or you can remove all fields (including custom fields and table calculations), except those that are active filters, by selecting Clear fields, keep filters. Neither of these options will remove Custom filters ; to remove a custom filter you need to manually uncheck the checkbox next to the filter.
Alternatively, you can choose to filter, pivot, or perform other field-specific actions from the In Usetab by choosing the appropriate field icon.
In Use tab field-specific icons and actions
The icons
that are next to each field indicate the field's current and potential functions in an Explore query. Custom fields
and table calculations
are listed under the Custom Fieldsview label when they are used in an Explore. Users with the create_table_calculations
permission can create and edit table calculations, and users with the create_custom_fields
permission can create and edit custom fields by selecting the Addbutton or by choosing a custom field option from a field's three-dot More
menu.
Users must have
the create_table_calculations
or create_custom_fields
permission to see the three-dot Moremenu. The only exception is for dimension groups
in the In Usetab — the three-dot Moremenu will appear for dimension groups that appear in the In Usetab.
When a dimension group is active in an Explore's data table, users can use the three-dot Moremenu to access the Switch tolist to replace a selected timeframe with another, if available, without having to manually deselect one field and select another field:
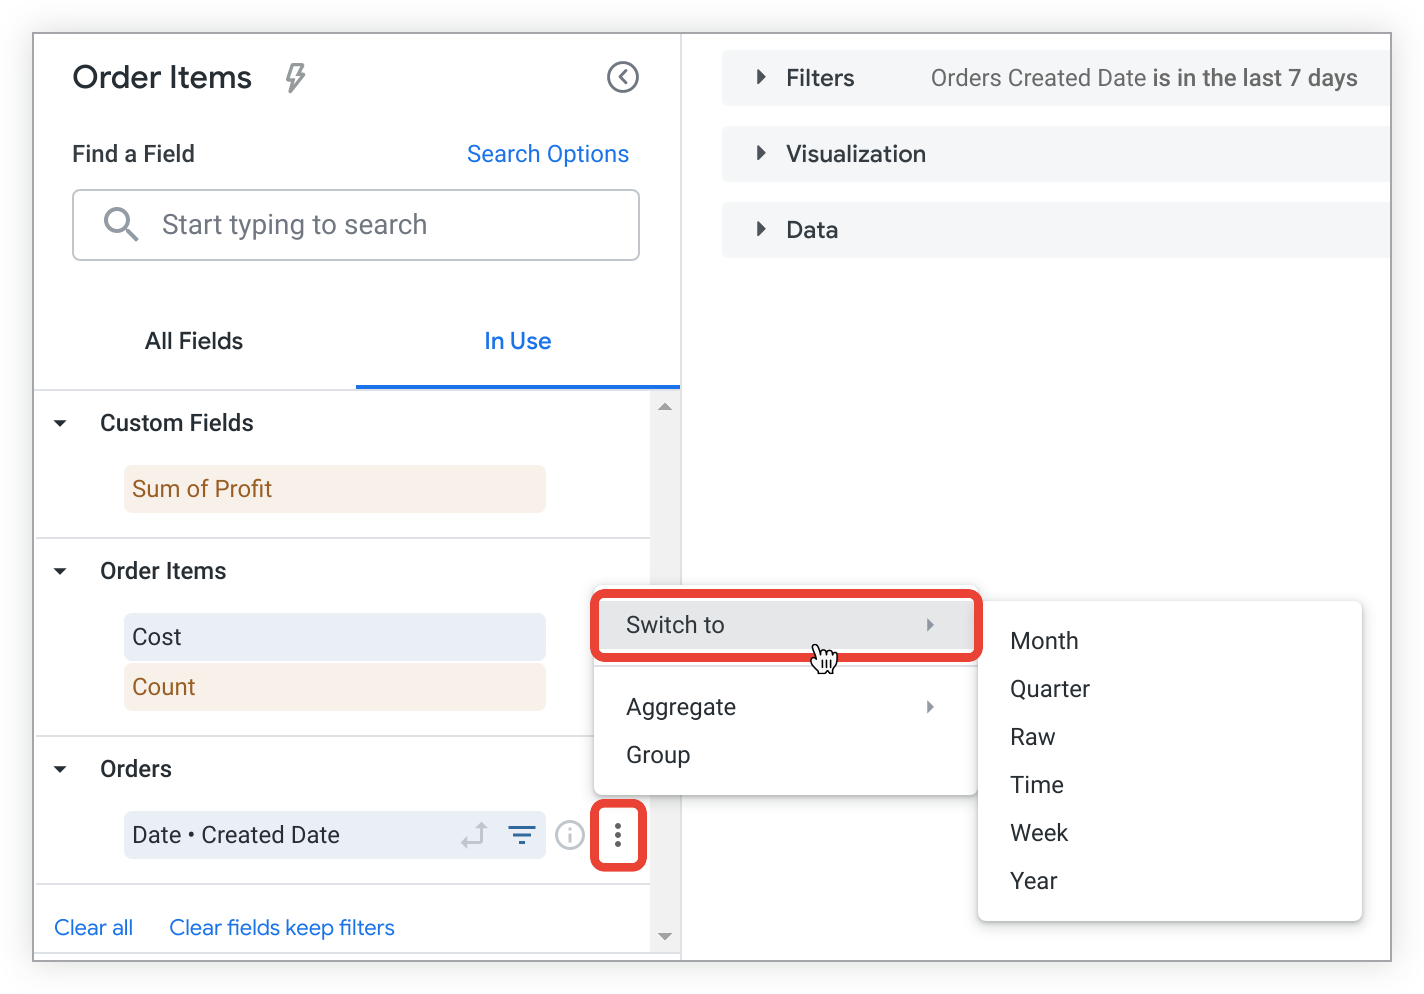
When you select a new timeframe from the Switch tolist, the Explore automatically reruns with updated results. When you're using the Switch tofunction, only timeframes in the Explore data table, not filtered timeframes, will be replaced.
Search bar
The search function empowers you to quickly select the specific fields you need to build Explores.
Entering a search term in the search bar
Entering a string in the search bar will filter the field picker to display only the fields, views, and fields with descriptions that match all or part of a search string.
To perform a search, begin by entering a term. You can also select the Search Optionslink to choose an option for limiting your search:
-
Any— Select this option to search the field picker without restriction for the term you entered. This is the default for Explores that contain 5,000 or fewer fields.
-
Field Label— Select this option to limit your field picker search to field names. This is the default for Explores that contain more than 5,000 fields.
-
Field Description— Select this option to limit your field picker search to field descriptions.
-
Dimension Group— Select this option to limit your field picker search to dimension groups.
-
View Name— Select this option to limit your field picker search to view names.
The filtered field picker features the same functionality as described in the All Fieldstab section.
Removing fields
To remove a field from an Explore:
- Select the field in the field picker or choose Removefrom the column's gear menu in the Explore data table.
- Select the Runbutton to re-run the query.
You can also remove all fields in an Explore using the keyboard shortcuts Command-K (Mac) or Ctrl+K (Windows).
Sorting data
Unpivoteddata on the Explorepage is sorted by default according to the following prioritization:
- The first date dimension, descending
- If no date dimension exists, the first measure, descending
- If no measure exists, the first added dimension, ascending
For information on sorting pivoted data, see the Pivots and sorting section.
A field's sort order is indicated in the data table in several ways:
- With a number next to the field name that distinguishes its sort-by order as compared to other fields
- With an arrow next to the field name that indicates the sorting direction (pointed up for ascending or down for descending)
- With a dialog that appears when you hold the pointer over a field name
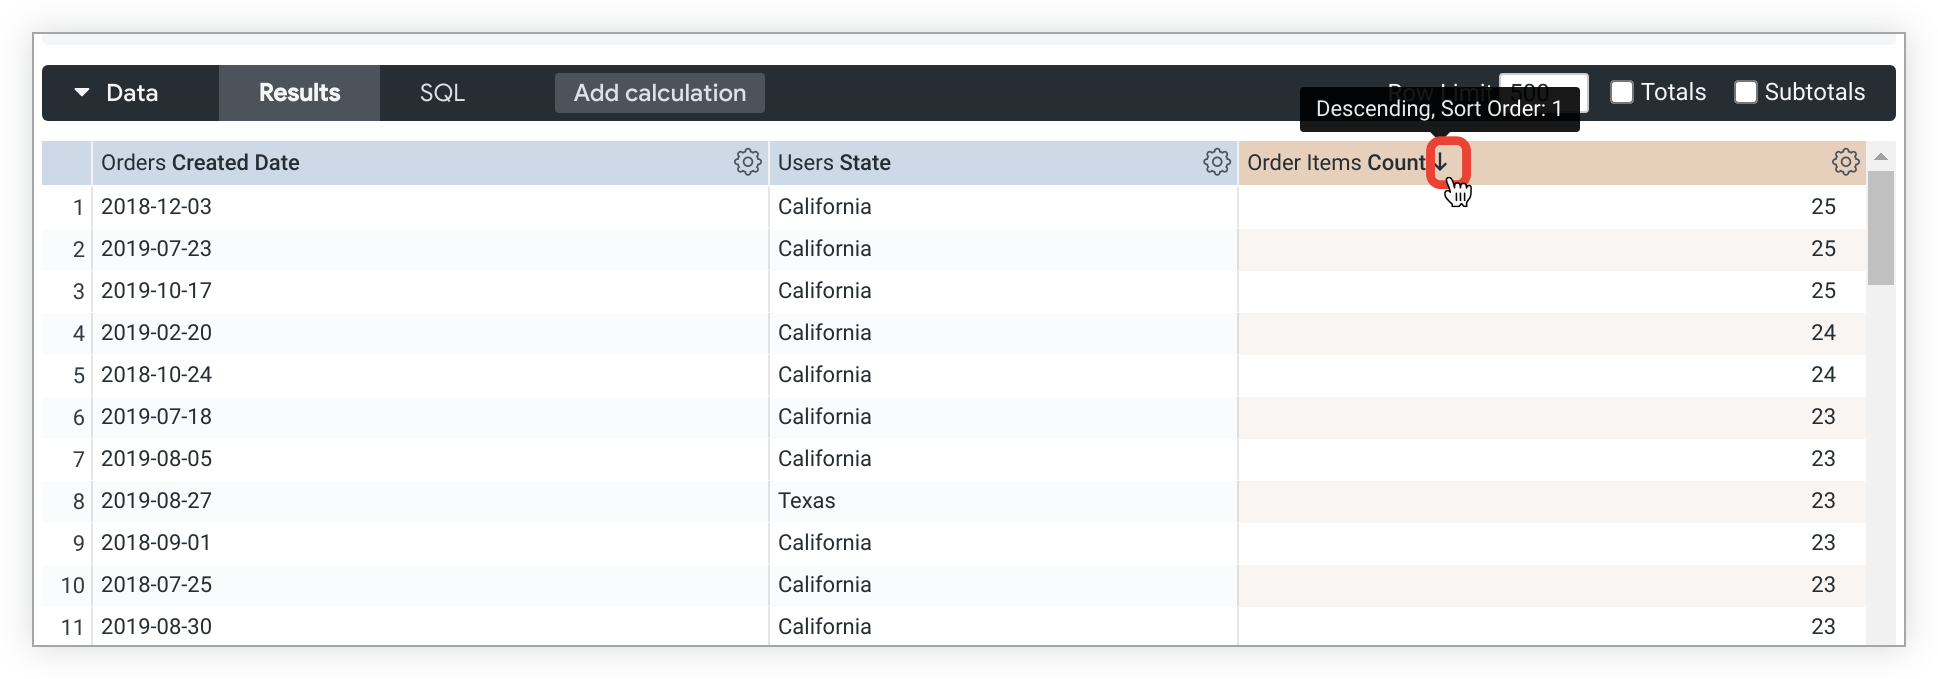
You may want to sort data differently than the default order. You can sort by selecting a field's name in the data table to sort the query by that field:
- Select a field name once to sort by that field in descending order.
- Select a field name twice to sort that field in ascending order.
You can select a field multiple times as necessary to attain the desired sort order.
For example, an Explore query with Orders Created Date, Users State, and Orders Countis sorted by Orders Created Datein descending order.
However, you want to see the date that has the most orders from returning customers (in other words, customers who are not making their first purchases). Select the Order Items Countcolumn header to re-sort the query to display the dates that have the highest count of orders to the lowest. A downward arrow next to Order Items Countindicates that the results are now sorted by this field, in descending order. Additionally, a tooltip that appears when you hold the pointer over a the field name confirms the sort order:
Sorting by multiple fields
To sort multiple fields, hold down the Shift key and then select the column headers in the order that you want them sorted.
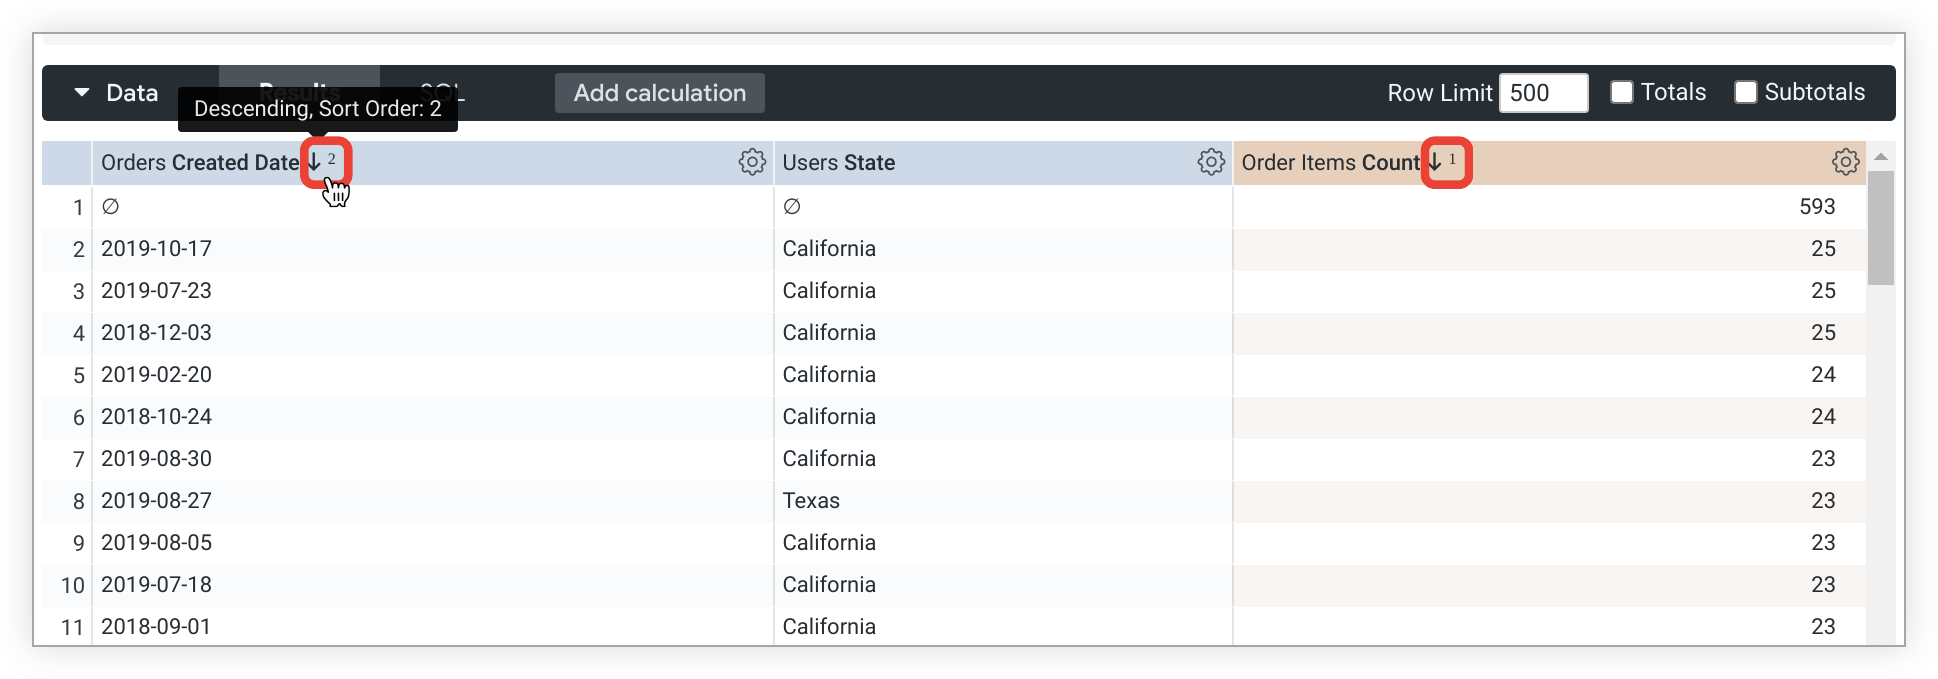
The arrows next to Orders Created Dateand Order Items Countfield names indicate that the table is sorted by both fields, and the order by which the table is sorted. Orders Created Dateis the second order-by field (descending), as indicated by the downward-pointing arrow and 2next to the field name.
You can also create custom sorting using the case
parameter.
Pivoting dimensions
Multiple dimensions are often easier to look at when you pivot one of the dimensions horizontally. Each value in the dimension will become a column in your Look. This makes the information easier to consume visually, and reduces the need to scroll to find data. Looker supports up to 200 pivoted values.
To pivot Explore results by a dimension:
- Hold the pointer over the dimension in the field picker and select the Pivot dataicon .
- Select Runto re-run the query.
- You can unpivot a field in one of two ways:
- By selecting the Unpivotoption from the field's gear icon menu at the top of the column in the data table
- By selecting the dimension's Pivot dataicon again in the field picker
Pivots and nulls
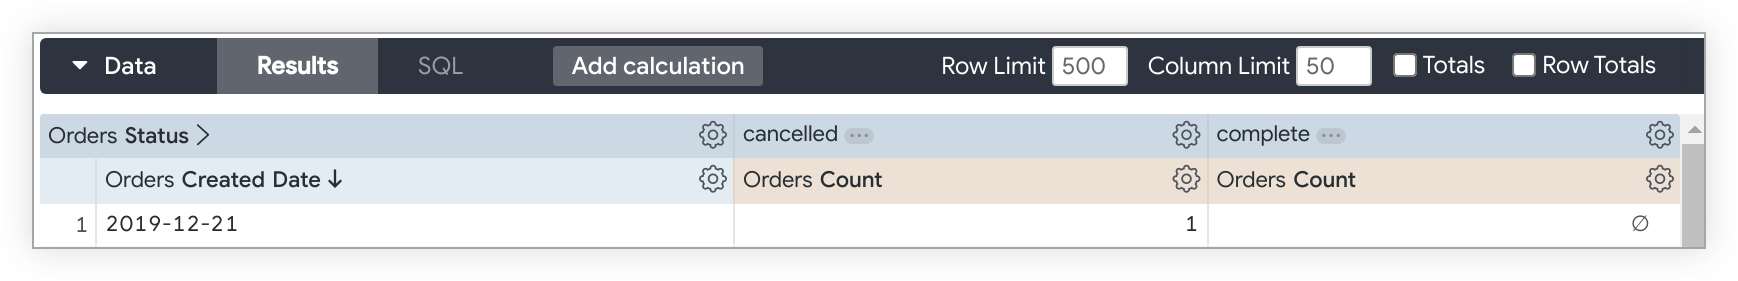
A row of data whose value won't appear in a column is indicated with the null value symbol, a zero with a slash across it. For example, on December 21st, there were no completed orders:
Pivots and sorting
You can also sort pivoted dimensions by selecting the title of the dimension in the data table. To sort by multiple pivoted dimensions, hold down the Shift key and then select the dimension titles in the order that you want them sorted. When you're sorting a pivoted measure, any rows with values in that column are sorted first, followed by rows without data in that column (indicated by the null value symbol).
You can also create custom sorting using the case
parameter.
Reordering columns
You can reorder columns in the Datasection by selecting a column header and dragging and dropping the column to its new position. The Explore's visualization will reflect the new column order after you select the Runbutton.
Columns are organized in the Datasection by field type:
- Dimensions
- Dimension table calculations
- Measures
- Measure table calculations
- Row totals
For the most part, columns can be reordered within each field type but cannot be moved out of their field type section.
For example, dimension table calculations can be rearranged among themselves, but you cannot place a dimension table calculation in between two measures.
One exception, however, is that you can use the arrow next to the row totals checkbox on the Datatab to move the row total column from the far right of the data table to just after the dimension table calculations.
Columns under a pivoted dimension can be reordered, but the order of pivoted dimensions can be changed only by changing the sort order, not by manual reordering.
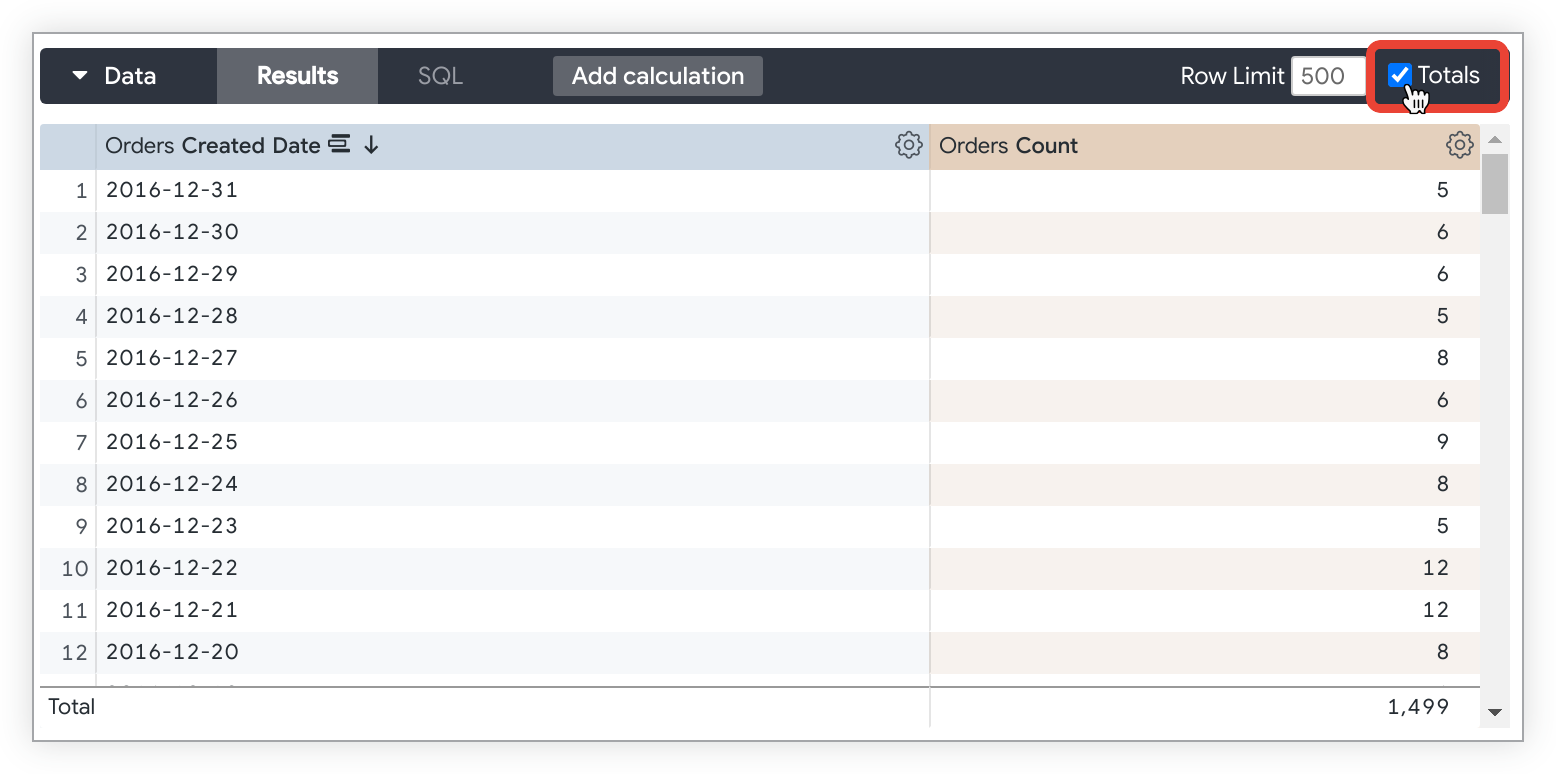
Displaying totals
Sometimes a summary of your data is useful. You can add column totals to an Explore query by checking the Totalscheckbox in the upper right of the Explore data table and then rerunning the query.
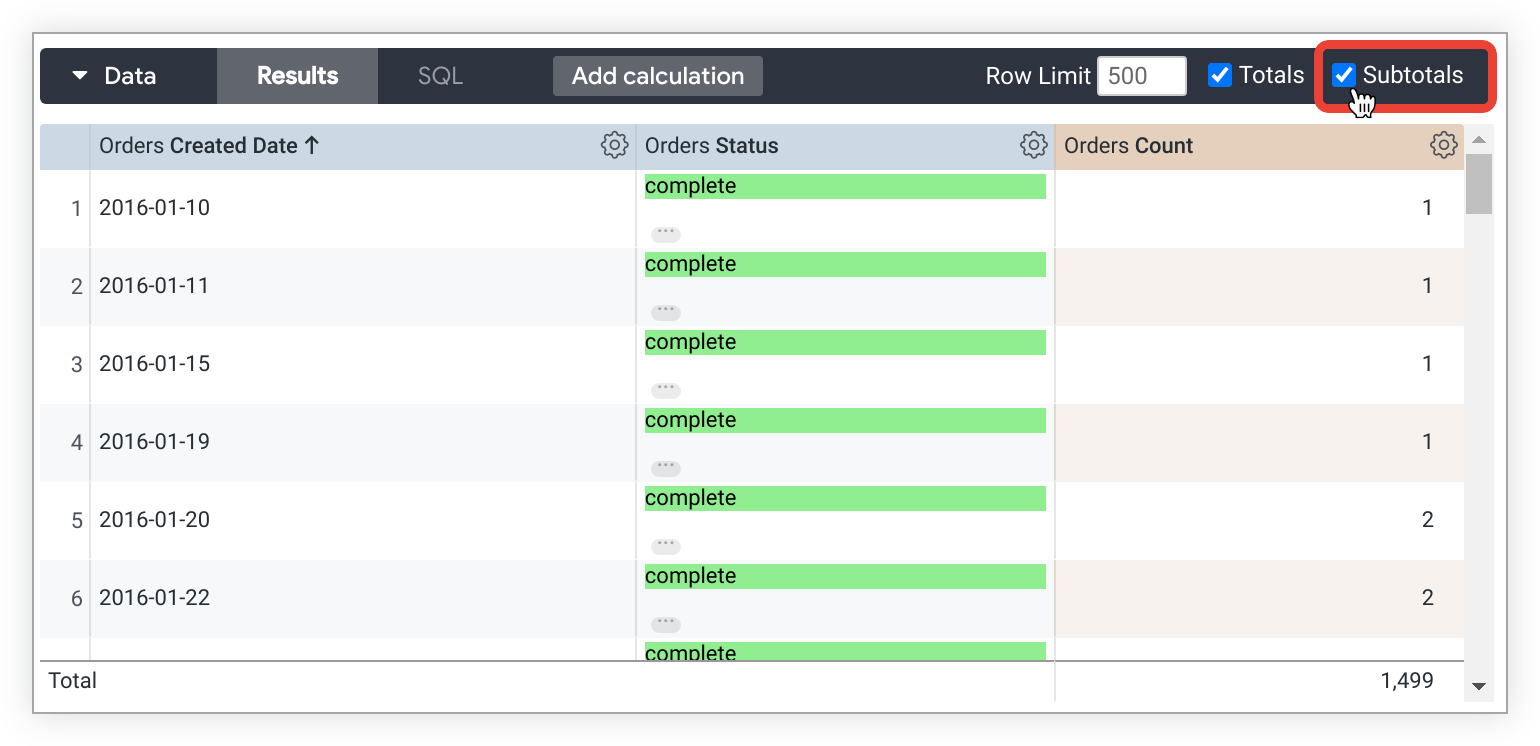
If an Explore query contains more than one dimension, you can choose to include Subtotals in your table visualization by checking the Subtotalscheckbox in the upper right of the Explore data table next to the Totalscheckbox. The Subtotalscheckbox only appears when your query includes more than one dimension.
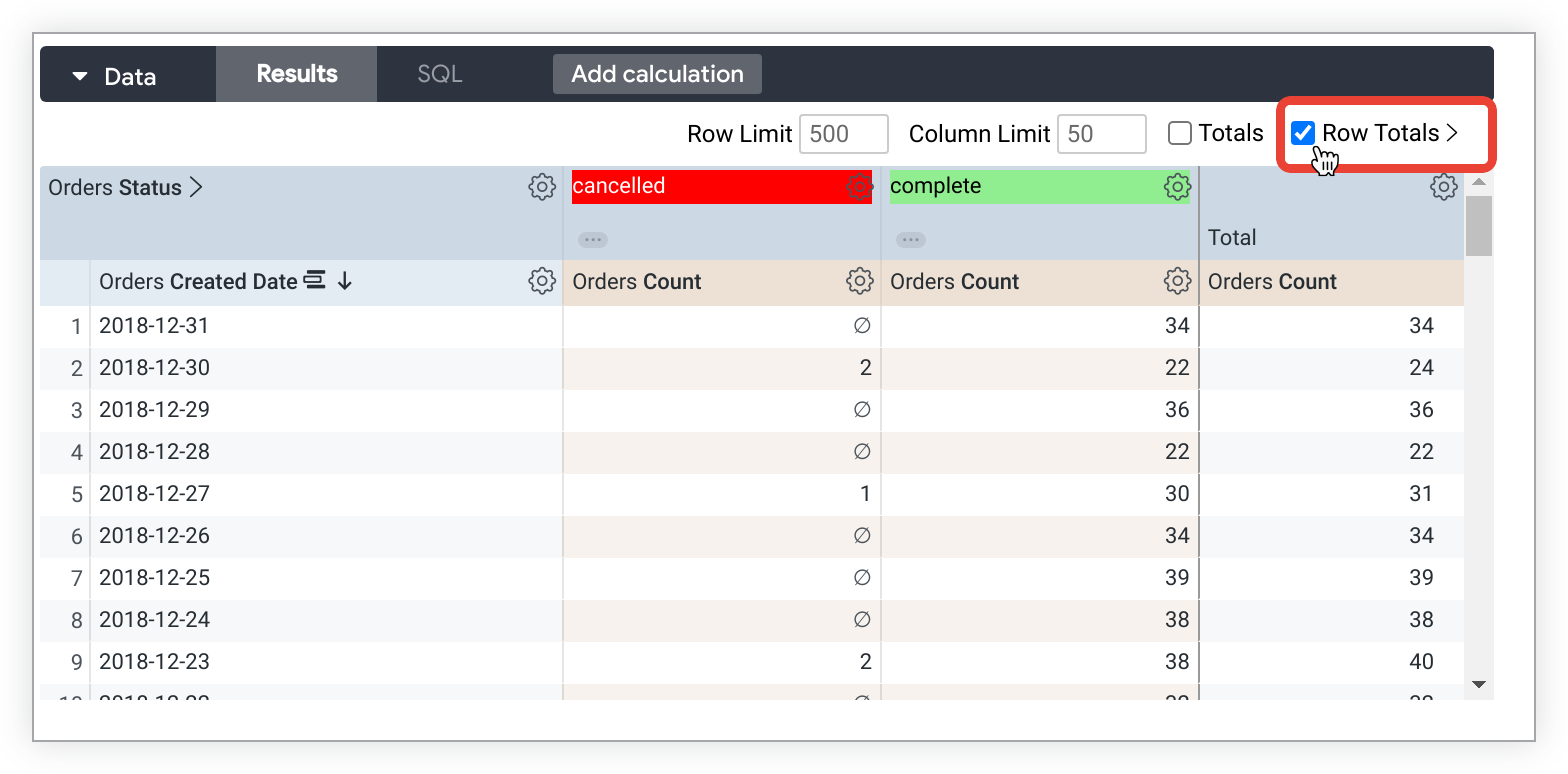
You can also add row totals to a pivoted Explore query by checking the Row Totalscheckbox in the upper right of the data table. The Row Totalscheckbox is only available if an Explore query includes a pivoted dimension.
If you've added row totals, and your query exceeds any row limit that you've set, you won't be able to sort the Row Totalscolumn (although you can sort dimension and measure columns as normal). This is because you might be missing rows in your data that should be included in your totals. If you run into this issue, you can try increasing the query's row limit (up to 5,000 rows, or up to 50,000 rows if a higher limit is specified by your admin ).
When totals aren't available
There are some cases when totals won't be available:
- Column totals are available only for measures and table calculations that exclusively reference measures, not for dimensions or table calculations that reference dimensions.
- Row totals are available only for measures, not for table calculations that are based on dimensions or dimensions.
- Certain types of columns won't be totaled, because of database limitations or because the value wouldn't make sense as a total. For example, you can't add together a list of words.
Things to consider with totals
Additionally, there are some things to keep in mind about how totals work in certain situations:
- Columns that count unique items might not add up as you expect, since the same item might show up in several categories but be counted as only one unique item in the totals.
- The Row Totalsfeature creates an additional query, and this query has a limit of 30,000 rows. If your Explore query has more than 30,000 rows, row totals will be shown for the first 30,000 rows only. Furthermore, if the data is pivoted , the row totals limit is further reduced by the number of options in your pivot.
- Some table calculations
that perform aggregations, such as calculations that use
percentileormedian, might not add up as you expect. This is because table calculations calculate totals by using the values in the Totalrow, not the values in the data column. See the Display potentially confusing table calculation totals as nulls Best Practices page for troubleshooting tips. - If you've filtered your query by a measure, totals may appear to be too high. However, in actuality, what you're seeing is a total for your data before the measure filter is applied. In other words, the measure filter may be hiding some data from your query results, even though that data is included in the total.
- If you've used totals with merged results , Looker calculates totals on each of the component queries and uses those totals in the merged result. Therefore, totals may appear too high, because what you are seeing are totals calculated before the results were merged . One way to avoid this is to align the filters on each query.
- Similarly, if you've placed row or column limits on your query, and your query results exceed that limit, totals may also appear to be too high. However, what you're seeing is a total for your data before the limits are applied. In other words, the limits may be hiding some data from your query results, even though that data is included in the total.
In the situations described in the third and fourth bullets in the preceding list, it is possible to calculate totals only
for the data you can see. To do so, you'll need to use a table calculation, explained later on this page. For a column total, use sum(${view_name.field_name})
. For a row total, use sum(pivot_row(${view_name.field_name}))
.
Cost estimates for Explore queries
For BigQuery , MySQL , Amazon RDS for MySQL , Snowflake , Amazon Redshift , Amazon Aurora , PostgreSQL, Cloud SQL for PostgreSQL, and Microsoft Azure PostgreSQL connections, the Explore page provides an estimate of the cost of the query. Select one or more fields from the field picker and refrain from running the query immediately. The Explore page will calculate the amount of data that the query will require and display the information near the Runbutton.
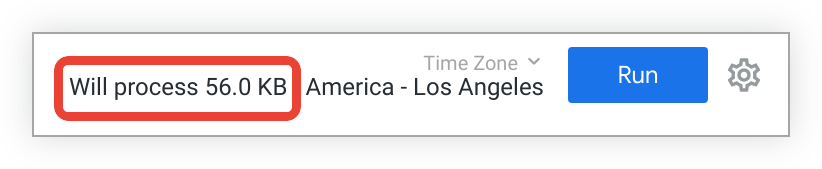
The Explore page displays different information depending on the query:
- For new queries on the database, the Explore page displays the number of bytes that will be processed.
- For queries that can be pulled from the cache , the Explore page displays the number of rows that will be pulled from the cache.
- For queries that use aggregate awareness optimization, the Explore page displays the number of bytes that will be processed and the number of bytes that will be saved by using aggregate awareness.
The calculation of cost estimates is dialect specific. Use Looker's EXPLAIN
function to see how a query is processed by your database.
Features for developers
Depending on your permissions , you may see several features designed for Looker developers in the Explore field picker :
- The Go to LookMLoption on the All Fields and In Use tabs lets developers navigate to the Explore's LookML.
- The
sqlparameter definition in a field's Infoicon menu lets developers see a field'ssqldefinition without needing to navigate to the field's LookML. - The Go to LookMLoption in a field's Infoicon menu lets developers see the field's LookML.
You may also see several features in the Explore's data table gear menu for fields and in the Explore actionsgear menu:
- The Go to LookMLoption in a field's data table gear menu lets Looker developers navigate to the field's LookML definition.
- The SQLtab in the Explore's Datasection lets Looker developers see the SQL query that Looker sends to the database to retrieve the data.
- The Get LookMLoption in the Explore actionsgear menu lets developers copy LookML for the Explore's query, which can be used to add a tile to LookML dashboards , to improve query performance with aggregate tables , or to define native derived tables .
Explore query tracker
If either the Explore visualization panel or the data panel is open, the Explore query tracker , which lets you view the query's progress, appears while an Explore query is running.
Conclusion
Now that you know how powerful the Looker Explorepage is for building queries, displaying results, and discovering insights through iterative searches, you may want to learn how to do the following:
- Filter and limit your results to just the data you're interested in.
- Use table calculations to create ad hoc Explore metrics.
- Use custom fields to create ad hoc dimensions and measures.
- Create visualizations .
- Save Explore queries as Looks .
- Add Explore queries to dashboards .
- Share data with other users.