If you're using version 2 of Google Cloud's Agent for SAP, then we recommend that you switch to the latest version of the agent as soon as possible. For information about how to update Google Cloud's Agent for SAP, see Update Google Cloud's Agent for SAP .
This guide shows you how to configure version 2 of Google Cloud's Agent for SAP to collect the Process Monitoring metrics from your SAP systems.
For information about this feature, see Process Monitoring using Google Cloud's Agent for SAP .
Before you begin
- Validate your installation of Google Cloud's Agent for SAP. For instructions, see the installation guide for your scenario .
- If you have installed the agent on a Bare Metal Solution server, then make sure that you have completed the required prerequisites and set up a service account. For instructions, see Configure Google Cloud's Agent for SAP on Linux .
Set IAM roles
To allow Google Cloud's Agent for SAP collect the Process Monitoring metrics, you must ensure that the service account being used by your Compute Engine instance or Bare Metal Solution server includes the following roles:
- Compute Viewer (
roles/compute.viewer) - Monitoring Metric Writer (
roles/monitoring.metricWriter) roles. - Secret Manager Secret Accessor (
roles/secretmanager.secretAccessor) , if you use Secret Manager for storing SAP HANA database password.
To add these required roles to your service account, follow these steps:
-
In the Google Cloud console, go to the IAMpage.
-
Select your Google Cloud project.
-
Identify the service account to which you want to add a role.
- If the service account isn't already on the principals list, then it doesn't have any roles assigned to it. Click Addand enter the email address of the service account.
- If the service account is already on the principals list, then it has existing roles. Click the Editbutton for the service account that you want to edit.
-
Select the required role from the list of available roles:
- Compute Viewer
- Monitoring > Monitoring Metric Writer
- Secret Manager > Secret Manager Secret Accessor
-
Click Addor Saveto apply the roles to the service account.
Enable Process Monitoring metrics collection
To enable the collection of Process Monitoring metrics using Google Cloud's Agent for SAP, follow these steps:
-
Establish an SSH connection with your host Compute Engine instance.
-
Open the agent's configuration file:
/etc/google-cloud-sap-agent/configuration.json
-
In the
collection_configurationsection, perform the following:- For the parameter
collect_process_metrics, specify the valuetrue. - To enable the collection of process monitoring metrics related to your
SAP HANA database instances, you need to configure additional parameters
in the
hana_metrics_configsection. For information about these parameters, see Configuration parameters .
- For the parameter
-
Optionally, under the
cloud_propertiessection, you can update the parameter values that are set automatically. To do so, add thecloud_propertiessection to your configuration file, and then specify the required parameters and their values. -
Save the configuration file.
-
Restart the agent for the new settings to take effect:
sudo systemctl restart google-cloud-sap-agent
Example configuration files
Compute Engine instance
The following example is a completed configuration file of Google Cloud's Agent for SAP, running on a Compute Engine instance, where the collection of Process Monitoring metrics is enabled:{ "provide_sap_host_agent_metrics" : true , "bare_metal" : false , "log_level" : "INFO" , "log_to_cloud" : true , "collection_configuration" : { "sap_system_discovery" : true , "collect_workload_validation_metrics" : true , "collect_process_metrics" : true , "process_metrics_frequency" : 5 , "slow_process_metrics_frequency" : 30 , "hana_metrics_config" : { "hana_db_user" : "db_user_name" , "sid" : "DEH" , "hana_db_password_secret_name" : "db_pwd_secret_name" } }, "hana_monitoring_configuration" : { "enabled" : false } }
Bare Metal Solution server
The following example is a completed configuration file of Google Cloud's Agent for SAP, running on a Bare Metal Solution server, where the collection of Process Monitoring metrics is enabled:{ "provide_sap_host_agent_metrics" : true , "bare_metal" : true , "log_level" : "INFO" , "log_to_cloud" : true , "collection_configuration" : { "sap_system_discovery" : true , "collect_workload_validation_metrics" : true , "collect_process_metrics" : true , "process_metrics_frequency" : 5 , "slow_process_metrics_frequency" : 30 , "hana_metrics_config" : { "hana_db_user" : "db_user_name" , "sid" : "DEH" , "hana_db_password_secret_name" : "db_pwd_secret_name" } }, "cloud_properties" : { "project_id" : "my-project" , "instance_name" : "bms-machine-1" , "region" : "us-central1" , "image" : "rhel-8" }, "hana_monitoring_configuration" : { "enabled" : false } }
Configuration parameters
The following table explains the configuration parameters of Google Cloud's Agent for SAP that are specific to the collection of the Process Monitoring metrics.
provide_sap_host_agent_metrics
Boolean
To enable the collection of the metrics required by the
SAP Host Agent, specify true
.
Default is true
.
Don't set provide_sap_host_agent_metrics
to false
unless you are directed by Cloud Customer Care or SAP Support.
bare_metal
Boolean
When the agent is installed on a Bare Metal Solution server, specify true
. Default is false
.
log_level
String
To set the logging level of the agent, set the required value. The available log levels are as follows:
-
DEBUG -
INFO -
WARNING -
ERROR
Default is INFO
. Don't change the logging level unless you
are directed by Cloud Customer Care.
log_to_cloud
Boolean
To redirect the agent's logs to Cloud Logging
, specify true
. The default is true
.
sap_system_discovery
Boolean
To enable the SAP system discovery, specify true
. Default is true
.
cloud_properties.project_id
String
If your SAP system is running on a Bare Metal Solution server, then
specify the project ID of the Google Cloud project that you are
using with Bare Metal Solution.
When the agent runs on a Compute Engine instance, by default,
the agent detects the project ID automatically.
cloud_properties.instance_name
String
If your SAP system is running on a Compute Engine instance, then specify the name of that compute instance. The agent automatically detects the compute instance name upon installation.
If your SAP system is running on a Bare Metal Solution server, then
specify the name of that server. In agent version 2.5 or earlier, specify
the Bare Metal Solution server name for the property instance_id
.
cloud_properties.region
String
If your SAP system is running on a Bare Metal Solution server,
then specify the region where you've deployed the Bare Metal Solution server.
When the agent runs on a compute instance, by default,
the agent uses the region where the compute instance is deployed.
cloud_properties.zone
String
When the agent runs on a compute instance, by default, the agent uses the zone where the compute instance is deployed.
cloud_properties.image
String
Specify the OS image name of the instance.
When the agent runs on a compute instance, by default, the agent
automatically detects the OS image used by the compute instance.
cloud_properties.numeric_project_id
String
Specify the numeric ID of the Google Cloud project where the SAP system
is running.
When the agent runs on a compute instance, by default, the agent
automatically detects project number.
collection_configuration.collect_process_metrics
Boolean
To enable Process Monitoring metrics collection, specify true
.
Default is false
.
This parameter is applicable only for Linux.
If you enable Process metrics collection for SAP HANA, then you need to
set up additional parameters listed under hana_metrics_config
.
collection_configuration.process_metrics_frequency
Int
From version 2.6, this parameter determines the collection frequency of the fast-changing Process Monitoring metrics
,
in seconds. Fast-changing Process Monitoring metrics are: sap/hana/availability
, sap/hana/ha/availability
, and sap/nw/availability
.
The default value for this parameter is 30
seconds. We recommend that you use this default value.
All other ( slow-changing
) Process Monitoring metrics are collected at a
default frequency of 120 seconds. To change the collection frequency of
the slow-changing Process Monitoring metrics, use the parameter slow_process_metrics_frequency
.
collection_configuration.slow_process_metrics_frequency
Int
Specify the collection frequency of the slow-changing Process Monitoring metrics , in seconds.
The default value for this parameter is 120
seconds.
collection_configuration.process_metrics_to_skip
Array
Specify the Process Monitoring metrics
that you don't want the agent to collect. This parameter accepts a
comma-separated value of Process Monitoring metric names. For example: "process_metrics_to_skip": ["/sap/nw/abap/sessions", "/sap/nw/abap/rfc"]
.
collection_configuration.hana_metrics_config.hana_db_user
String
Specify the database user account that the agent uses to query
SAP HANA. Default is SYSTEM
.
collection_configuration.hana_metrics_config.hana_db_password
String
Specify the plain text password for the database user account that the agent uses to query SAP HANA.
Instead of specifying a plain text password, we recommend that you use one of the following options:
-
hana_db_password_secret_name, for which you specify a secret stored in Secret Manager .
collection_configuration.hana_metrics_config.hana_db_password_secret_name
String
To securely provide the password for the database user account that the agent uses to query SAP HANA, specify the name of the secret that contains the security credentials for the database user account.
The agent collects the SAP HANA related metrics only when you specify
either hana_db_password_secret_name
or hana_db_password
.
collection_configuration.hana_metrics_config.sid
String
Specify the SID of your SAP HANA instance.
View the collected metrics
To visualize the Process Monitoring metrics that the agent collects, you can use the following custom dashboards that Google Cloud provides:
-
Agent for SAP - HANA Overview: This dashboard provides charts that display status overview for the following metrics: SAP HANA Availability, SAP HANA HA Availability, SAP HANA HA Replication, SAP HANA Service Status, HA Cluster - Node State, and HA Cluster - Resource State for SAP Instances.
The JSON file for this dashboard is
sap-agent-status-overview.json. -
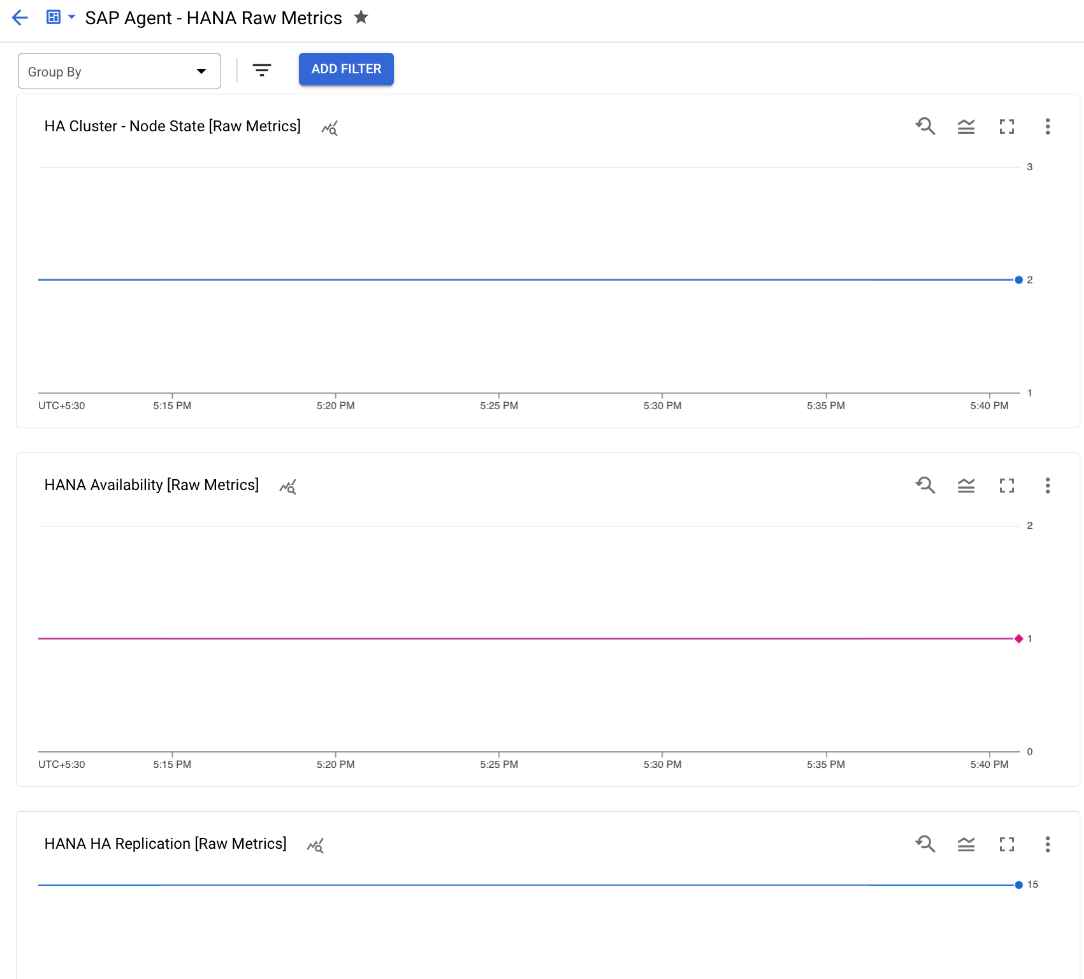
Agent for SAP - HANA Raw Metrics: This dashboard provides charts that display raw metric values for the following metrics: SAP HANA Availability, SAP HANA HA Availability, SAP HANA HA Replication, SAP HANA Service Status, HA Cluster - Node State, and HA Cluster - Resource State for SAP Instances.
The JSON file for this dashboard is
sap-agent-raw-metrics.json.
Install dashboards
To install a custom dashboard, complete the following steps:
Google Cloud console
-
In the Google Cloud console, go to the Monitoringpage:
-
In the Monitoring navigation panel, click Dashboards.
-
Click the Sample librarytab.
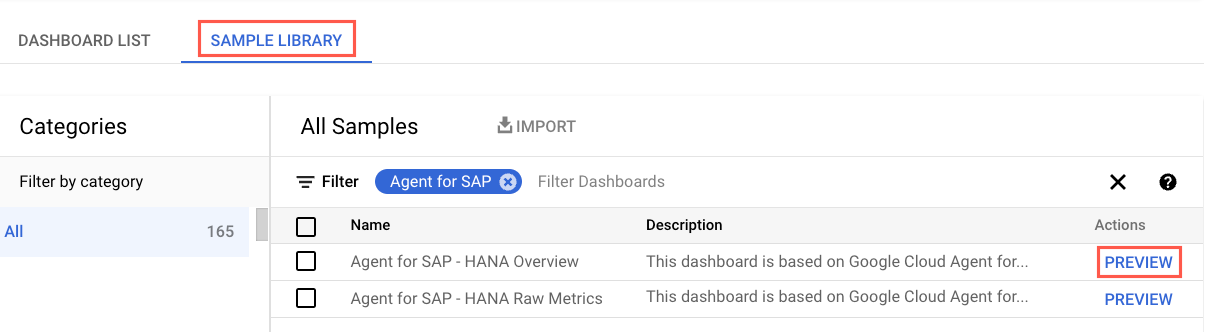
-
To filter the agent-specific custom dashboards, in the Filterfield, type
Agent for SAP. -
(Optional) To view details about a dashboard or to preview its contents, click Preview.
-
Select the dashboard that you want to install.
-
Click Import, and then click Confirm.
The dashboard is added to the available dashboards in your Google Cloud project. To see your dashboard, follow the instructions in View the installed dashboard .
Google Cloud CLI
-
Open the Cloud Shell:
-
In the Cloud Shell, clone or download the repository:
git clone https://github.com/GoogleCloudPlatform/monitoring-dashboard-samples/
-
In the Cloud Shell, install the required dashboard using the corresponding JSON file:
gcloud monitoring dashboards create --config-from-file= CONFIG_FROM_FILEReplace
CONFIG_FROM_FILEwith the path to the JSON file that contains the dashboard configuration. Dashboard configuration files can be located at path:monitoring-dashboard-samples/dashboards/google-cloud-agent-for-sap.The dashboard is added to the available dashboards in your Google Cloud project. To see your dashboard, follow the instructions in View the installed dashboard .
View the installed dashboards
To view the installed dashboards, follow these steps:
-
In the Google Cloud console, go to the Monitoringpage:
-
In the Monitoring navigation panel, click Dashboards.
-
Click the dashboard name in the list.
If you have a lot of dashboards, then you can filter for custom dashboards or for the name of the new dashboard. For information on filtering this list, see View custom dashboards .
The following image is an example that shows a part of the custom dashboard for SAP HANA metrics in Monitoring.