
This page describes how to use Cloud Monitoring and Spanner audit logs to monitor and analyze Spanner Data Boost usage.
Cloud Monitoring provides the ability to track total usage over time and to break down that usage by user. Spanner audit logs allow more flexible usage analysis, including providing metrics by user or by BigQuery job ID.
Use Cloud Monitoring to track Data Boost usage
Follow these steps to track overall Data Boost usage:
- In the Google Cloud console, go to Monitoring
.
Go to Monitoring - If Metrics Exploreris shown in the navigation menu, select it. Otherwise, click Resources, and then select Metrics Explorer.
- At the top of the page, select a time interval.
- In the Metricdrop-down list, in the Filter by resource or metric
namefield, enter
spannerand pressEnterto narrow the search. -
In the Metriclist, select Cloud Spanner Instance > Instance > Processing unit second, and then click Apply.
This creates a line chart of aggregate Data Boost usage across all Spanner instances.
-
To view usage for a particular instance, follow these steps:
- Use the Filterfield to add filters, such as the instance ID.
- Click +to add other attributes.
-
To view a breakdown of usage by all instances, follow these steps:
- Clear any filters by clicking the Xicon next to the filter fields.
- In the Aggregationoperator drop-down list, select Sum, and then select by instance_id.
-
To break down usage by principal, in the Aggregationoperator drop-down, select Sum, and then select by credential_id.
Use audit logs to analyze Data Boost usage
Spanner audit logs allow more flexible analysis of Data Boost usage. In addition to the ability to break down usage over time by instance or principal as with Cloud Monitoring, Spanner audit logs, if enabled and available, allow breaking down usage over time by database or BigQuery job ID.
Enabling audit logs can incur extra charges. For information about Logging pricing, see Google Cloud Observability pricing: Cloud Logging .
Enable Data Boost usage audit logs
You must enable data access audit logs for Spanner before you can collect usage data for Data Boost. To do so, follow these steps:
- Follow the instructions in Configure Data Access audit logs with the Google Cloud console .
- Enable the Data Readlog type for the Spanner APIservice.
- To obtain Data Boost usage by BigQuery job SQL text, ensure that that the audit logs for BigQuery are enabled as well.
View usage by principal
To query the audit logs to view Data Boost usage by user, follow these steps:
-
Go to the Logs Explorer in the Google Cloud console.
-
In the navigation menu, click Log Analytics.
-
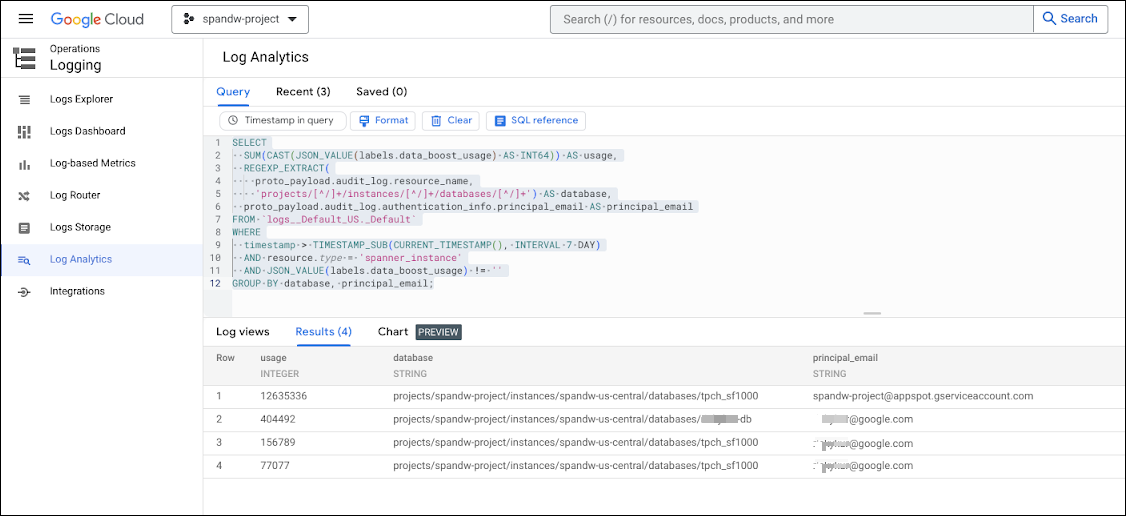
To show usage by user and database over the past 7 days, run the following query. To change the timespan for which usage is shown, modify the
timestampexpression in theWHEREclause.SELECT SUM ( CAST ( JSON_VALUE ( labels . data_boost_usage ) AS INT64 )) AS usage , REGEXP_EXTRACT ( proto_payload . audit_log . resource_name , 'projects/[^/]+/instances/[^/]+/databases/[^/]+' ) AS database , proto_payload . audit_log . authentication_info . principal_email AS principal_email FROM ` PROJECT_NAME . global . _Default . _AllLogs ` WHERE timestamp > TIMESTAMP_SUB ( CURRENT_TIMESTAMP (), INTERVAL 7 DAY ) AND resource . type = 'spanner_instance' AND operation . last IS NULL AND JSON_VALUE ( labels . data_boost_usage ) != '' GROUP BY database , principal_email ;Replace
PROJECT_NAMEwith your project name.
The following example shows usage in processing units for 4 principals.
View usage by BigQuery job ID
To query the audit logs to view Data Boost usage broken down by database, user, and BigQuery job ID, follow these steps:
-
Go to the Logs Explorer in the Google Cloud console.
-
In the navigation menu, click Log Analytics.
-
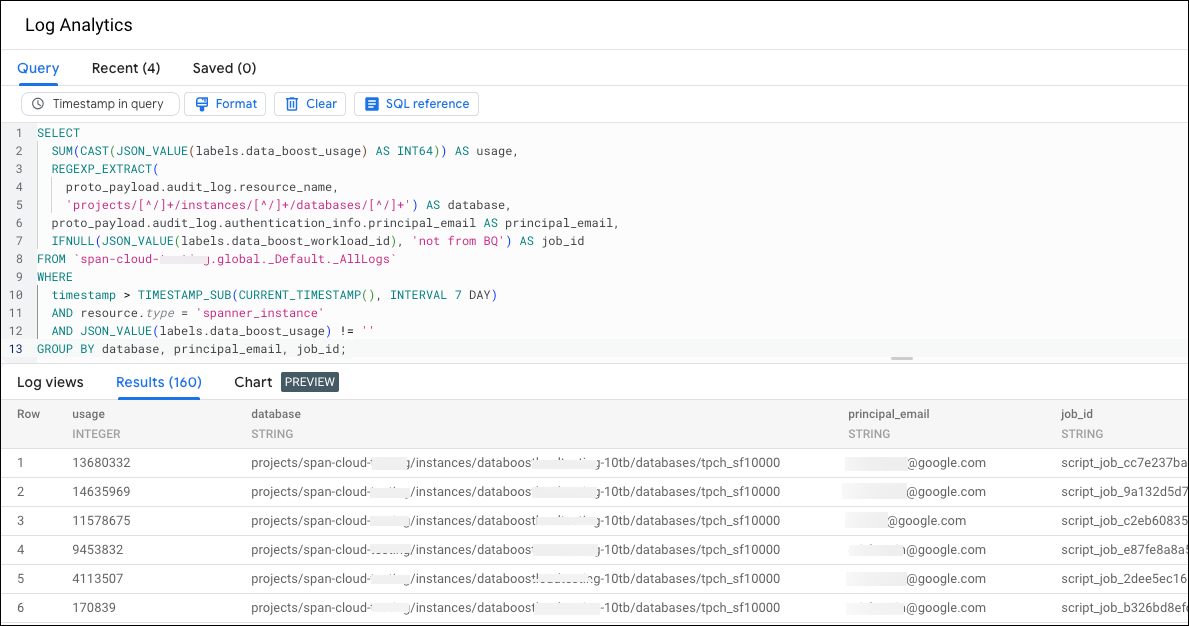
Run the following query:
  SELECT

 SUM
 (
 CAST
 (
 JSON_VALUE
 (
 labels
 .
 data_boost_usage
 )

 AS

 INT64
 ))

 AS

 usage
 ,

 REGEXP_EXTRACT
 (

 proto_payload
 .
 audit_log
 .
 resource_name
 ,

 'projects/[^/]+/instances/[^/]+/databases/[^/]+'
 )

 AS

 database
 ,

 proto_payload
 .
 audit_log
 .
 authentication_info
 .
 principal_email

 AS

 principal_email
 ,

 IFNULL
 (
 JSON_VALUE
 (
 labels
 .
 data_boost_workload_id
 ),

 'not from BigQuery'
 )

 AS

 job_id
 FROM

 `
  PROJECT_NAME

 .
 global
 .
 _Default
 .
 _AllLogs
 `
 WHERE

 timestamp
 >
 TIMESTAMP_SUB
 (
 CURRENT_TIMESTAMP
 (),

 INTERVAL

 7

 DAY
 )

 AND

 resource
 .
 type

 =

 'spanner_instance'

 AND

 operation
 .
 last

 IS

 NULL

 AND

 JSON_VALUE
 (
 labels
 .
 data_boost_usage
 )

 !=

 ''
 GROUP

 BY

 database
 ,

 principal_email
 ,

 job_id
 ;
Replace
PROJECT_NAMEwith your project name.
The following example shows usage by BigQuery job ID.
View usage by BigQuery SQL text
To view Data Boost usage for multiple BigQuery jobs aggregated by the SQL text of those jobs, follow these steps:
-
Go to the Logs Explorer in the Google Cloud console.
-
In the navigation menu, click Log Analytics.
-
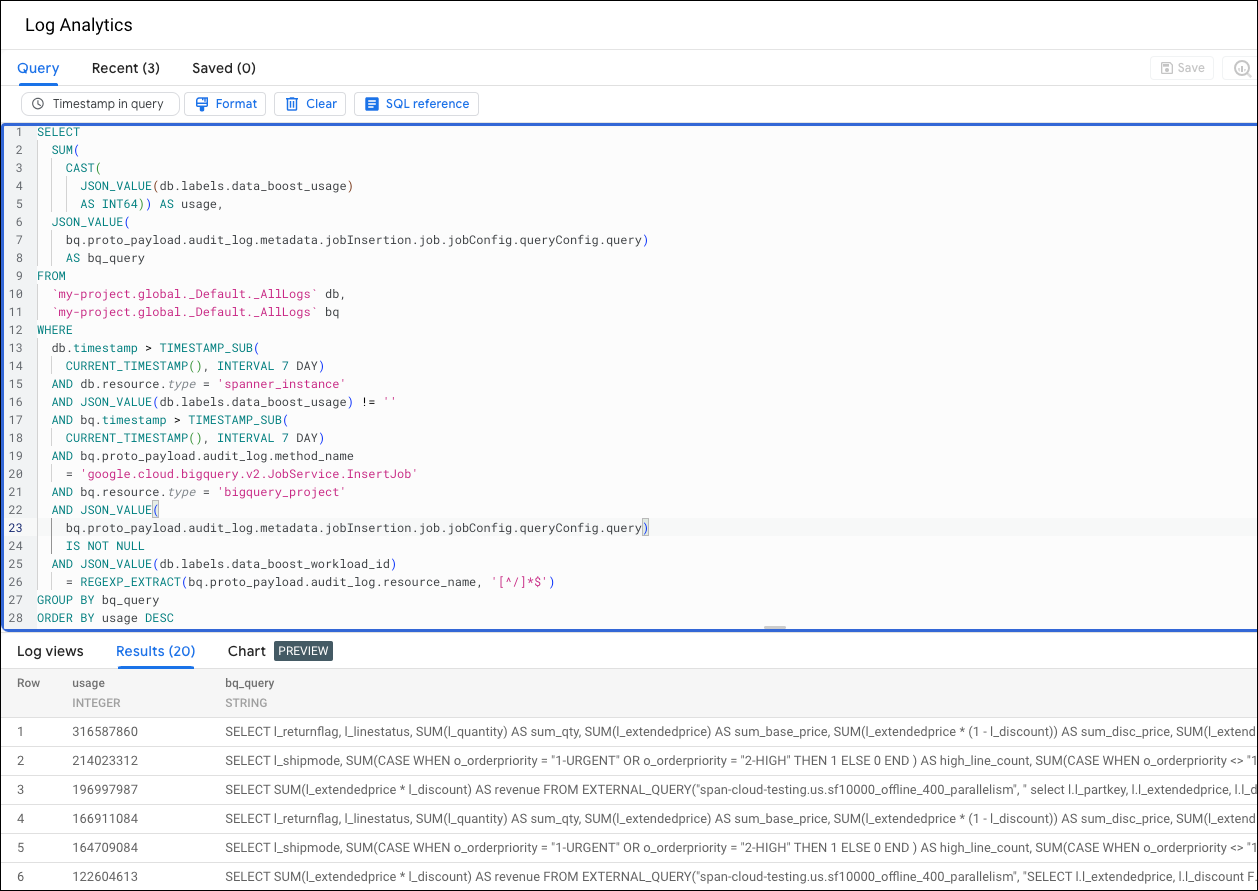
Run the following query:
  SELECT

 SUM
 (

 CAST
 (

 JSON_VALUE
 (
 db
 .
 labels
 .
 data_boost_usage
 )

 AS

 INT64
 ))

 AS

 usage
 ,

 JSON_VALUE
 (

 bq
 .
 proto_payload
 .
 audit_log
 .
 metadata
 .
 jobInsertion
 .
 job
 .
 jobConfig
 .
 queryConfig
 .
 query
 )

 AS

 bq_query
 FROM

 `
  PROJECT_NAME

 .
 global
 .
 _Default
 .
 _AllLogs
 `

 db
 ,

 `
  PROJECT_NAME

 .
 global
 .
 _Default
 .
 _AllLogs
 `

 bq
 WHERE

 db
 .
 timestamp
 >
 TIMESTAMP_SUB
 (

 CURRENT_TIMESTAMP
 (),

 INTERVAL

 7

 DAY
 )

 AND

 db
 .
 resource
 .
 type

 =

 'spanner_instance'

 AND

 JSON_VALUE
 (
 db
 .
 labels
 .
 data_boost_usage
 )

 !=

 ''

 AND

 db
 .
 operation
 .
 last

 IS

 NULL

 AND

 bq
 .
 timestamp
 >
 TIMESTAMP_SUB
 (

 CURRENT_TIMESTAMP
 (),

 INTERVAL

 7

 DAY
 )

 AND

 bq
 .
 proto_payload
 .
 audit_log
 .
 method_name

 =

 'google.cloud.bigquery.v2.JobService.InsertJob'

 AND

 bq
 .
 resource
 .
 type

 =

 'bigquery_project'

 AND

 JSON_VALUE
 (

 bq
 .
 proto_payload
 .
 audit_log
 .
 metadata
 .
 jobInsertion
 .
 job
 .
 jobConfig
 .
 queryConfig
 .
 query
 )

 IS

 NOT

 NULL

 AND

 JSON_VALUE
 (
 db
 .
 labels
 .
 data_boost_workload_id
 )

 =

 REGEXP_EXTRACT
 (
 bq
 .
 proto_payload
 .
 audit_log
 .
 resource_name
 ,

 '[^/]*$'
 )
 GROUP

 BY

 bq_query
 ORDER

 BY

 usage

 DESC
Replace
PROJECT_NAMEwith your project name.
The following example shows Data Boost usage by SQL text.
Create a Data Boost alert
To create an alert that is issued when Data Boost usage exceeds a predefined threshold, see Set an alert for Data Boost usage .
What's next
- Learn about Data Boost in Data Boost overview .