
Page Summary
-
The dataset contains total cloud cover data from 1979 to 2025, updated every 6 hours.
-
The data is provided by NOAA as part of the NCEP-DOE Reanalysis 2 project.
-
There are no restrictions on the use of these datasets.
-
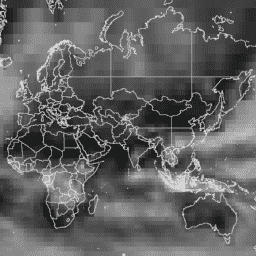
The dataset includes a 'tcdc' band representing total cloud cover in percentage.
-
This dataset can be explored and analyzed using Google Earth Engine.
- Dataset Availability
- 1979-01-01T00:00:00Z–2026-03-01T00:00:00Z
- Dataset Producer
- NOAA
- Cadence
- 6 Hours
- Tags
Description
This collection is no longer being updated. The Model is no longer being updated at the source.
NCEP-DOE Reanalysis 2 project is using a state-of-the-art analysis/forecast system to perform data assimilation using past data from 1979 through the previous year.
Bands
Bands
Pixel size: 278300 meters (all bands)
| Name | Units | Min | Max | Pixel Size | Description |
|---|---|---|---|---|---|
tcdc
|
% | 0* | 100* | 278300 meters | Total cloud cover |
Terms of Use
Terms of Use
There are no restrictions on the use of these datasets.
Citations
Explore with Earth Engine
Code Editor (JavaScript)
 // Import the dataset, filter the first five months of 2020.
 var

 dataset

 =

 ee
 .
 ImageCollection
 (
 'NOAA/NCEP_DOE_RE2/total_cloud_coverage'
 )

 .
 filter
 (
 ee
 .
 Filter
 .
 date
 (
 '2020-01-01'
 ,

 '2020-06-01'
 ));
 // Select the total cloud cover band.
 var

 totalCloudCoverage

 =

 dataset
 .
 select
 (
 'tcdc'
 );
 // Reduce the image collection to per-pixel mean.
 var

 totalCloudCoverageMean

 =

 totalCloudCoverage
 .
 mean
 ();
 // Define visualization parameters.
 var

 vis

 =

 {

 min
 :

 0
 ,

 max
 :

 80
 ,

 // dataset max is 100

 palette
 :

 [
 'black'
 ,

 'white'
 ],
 };
 // Display the dataset.
 Map
 .
 setCenter
 (
 0
 ,

 20
 ,

 2
 );
 Map
 .
 addLayer
 (
 totalCloudCoverageMean
 ,

 vis
 ,

 'Total Cloud Coverage Data'
 ,

 false
 );
 // Display a visualization image with opacity defined by cloud cover.
 var

 visImg

 =

 totalCloudCoverageMean
 .
 visualize
 (
 vis
 )

 .
 updateMask
 (
 totalCloudCoverageMean
 .
 divide
 (
 100
 ));
 Map
 .
 addLayer
 (
 visImg
 ,

 null
 ,

 'Total Cloud Coverage Vis.'
 ,

 true
 );