Linear regression: Parameters exerciseStay organized with collectionsSave and categorize content based on your preferences.
The graph below plots 20 examples from a fuel-efficiency dataset, with the
feature (car heaviness in thousands of pounds) plotted on the x-axis and the
label (miles per gallon) plotted on the y-axis.
Your task:Adjust theWeightandBiassliders above the graph to
find the linear model that minimizes MSE loss on the data.
Questions to consider:
What is the lowest MSE you can achieve?
What weight and bias values produced this loss?
Click the plus icon to see the solution
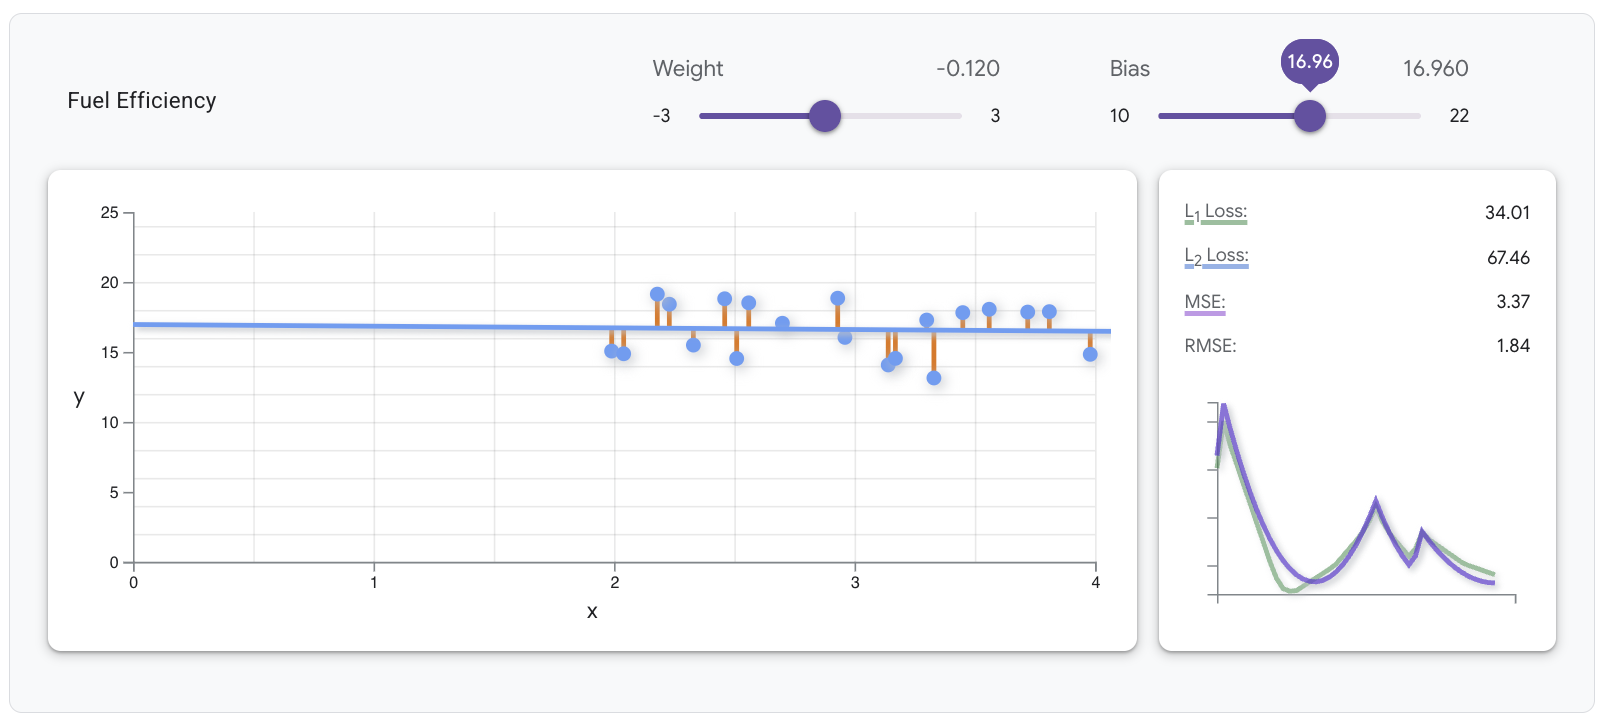
The optimal linear model for this data has an MSE of 3.37, with a
weight of –0.12 and a bias of 16.96, as shown in the following image.
[[["Easy to understand","easyToUnderstand","thumb-up"],["Solved my problem","solvedMyProblem","thumb-up"],["Other","otherUp","thumb-up"]],[["Missing the information I need","missingTheInformationINeed","thumb-down"],["Too complicated / too many steps","tooComplicatedTooManySteps","thumb-down"],["Out of date","outOfDate","thumb-down"],["Samples / code issue","samplesCodeIssue","thumb-down"],["Other","otherDown","thumb-down"]],["Last updated 2025-10-27 UTC."],[],[]]