

Page Summary
-
BigQuery enables analysis of Fleet Engine logs via SQL-like queries after routing logs to a BigQuery dataset.
-
Routing logs to BigQuery involves creating a sink in the Logs Explorer and selecting a BigQuery dataset as the destination.
-
BigQuery automatically populates tables for each Fleet Engine log type under the specified dataset.
-
Example queries demonstrate how to analyze trip creation, vehicle stops, and other data points within BigQuery.
-
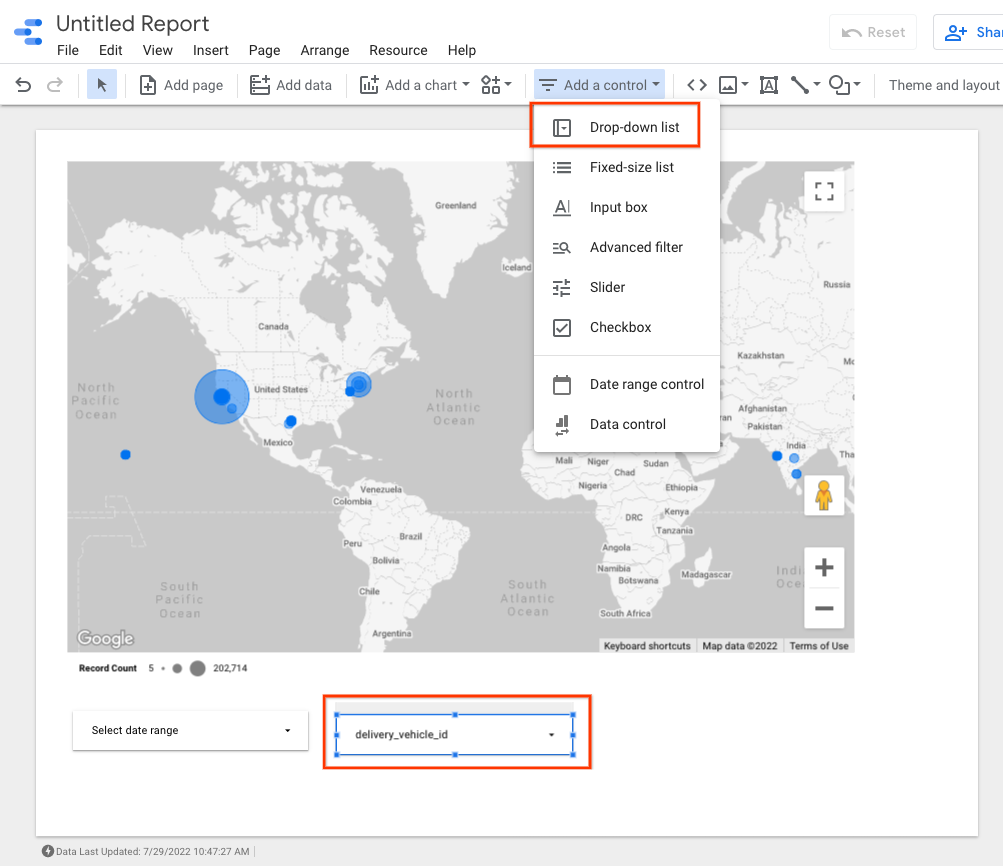
BigQuery integrates with Looker Studio for creating dashboards and visualizing data, such as vehicle movement on a map.
BigQuery is a powerful tool for performing analytics. You can use it to store longer-term logs and to perform SQL-like queries against the data. To use BigQuery for analysis, you must explicitly route your logs to BigQuery, as described in the next section.
Route logs to BigQuery
- In the Logs Explorer
, create a filter that
isolates the Fleet Engine logs:
Fleetengine.googleapis.com/Fleet. - In the Query Results pane, click the Actionsor More Actionsmenu and choose Create Sink.
- Specify a sink name (for example, FleetEngineLogsSink ). Click Next.
- In the Sink Destination, select BigQuery dataset.
- In Select BigQuery dataset, select Create new BigQuery dataset.
- In the Create datasetdialog, enter a Dataset ID.
- Leave everything else as is and click Create dataset.
- Check Use partitioned tables. Click Next.
- Leave Choose logs to include in sinkand Choose logs to filter out of sinkas they are.
- Click Create Sink.
Your logs should now begin to populate the BigQuery dataset, which can take a short while. See also Route logs to supported destinations .
Once you are routing log data to BigQuery, several tables under the FleetEngineLogs dataset are automatically populated, one for each log type:
- CreateVehicle
- GetVehicle
- ListVehicles
- SearchVehicles
- UpdateVehicle
- CreateTrip
- GetTrip
- UpdateTrip
- ListTrips
The table names use the following pattern:
project_id.data_set.log_name
For example, if the project is called test-project
and the dataset name is FleetEngineLogs
, the CreateTrip
table has the following name:
test-project.FleetEngineLogs.fleetengine_googleapis_com_create_trip
Example queries for BigQuery
The following example queries show how you can search for different log entries in BigQuery.
Number of CreateTrips logs grouped by hour
SELECT
TIMESTAMP_TRUNC (
timestamp,
HOUR )

as
hour,
count (
* )

as
num_trips_created
FROM
 `
ProjectId.FleetEngineLogs.fleetengine_googleapis_com_create_trip `

GROUP
BY
hour
ORDER
by
hour
Number of stops per vehicle per hour
SELECT
jsonpayload_v1_updatevehiclelog.request.vehicleid
AS
vehicle,
TIMESTAMP_TRUNC (
timestamp,
HOUR )

AS
hour,
COUNT (
* )

AS
num_stops
FROM
 `
ProjectId.FleetEngineLogs.fleetengine_googleapis_com_update__vehicle `

WHERE
ARRAY_LENGTH (
jsonpayload_v1_updatevehiclelog.request.vehicle.remainingvehiclejourneysegments )
 >
 0

AND
jsonpayload_v1_updatevehiclelog.request.vehicle.remainingvehiclejourneysegments [

OFFSET
 (
 0
 )]
.stop.state
 =

 'VEHICLE_STOP_STATE_LOG_ARRIVED'

GROUP
BY
 1
,
 2

ORDER
BY
 2
For example, this query could tell you that in the last hour:
- Vehicle A completed 10 stops in hour 12 and 8 stops in hour 13.
- Vehicle B completed 5 stops in hour 11 and 7 stops in hour 12.
- Vehicle C completed 12 stops in hour 13 and 9 stops in hour 14.
See also View logs routed to BigQuery .
Integrate BigQuery with Looker Studio
BigQuery can be integrated with business intelligence tools to create dashboards for business analytics. See Looker Studio .
The following example shows how to build a Looker Studio dashboard for visualizing trips and vehicle movements on a map.
- Launch a new Looker Studio dashboard and select BigQueryas the data connection.
- Select Custom Queryand manually enter or select the Cloud Project to which it should be billed.
- Enter one of the following queries into the query box.
On-demand trips example query
SELECT
timestamp,
labels.vehicle_id,
jsonpayload_v1_updatevehiclelog.response.lastlocation.location.latitude
AS
lat,
jsonpayload_v1_updatevehiclelog.response.lastlocation.location.longitude
AS
lng
FROM
 `
ProjectId.TableName.fleetengine_googleapis_com_update_vehicle `
Scheduled Tasks example query
SELECT
labels.delivery_vehicle_id,
jsonpayload_v1_updatedeliveryvehiclelog.response.lastlocation.rawlocation.longitude
as
lat,
jsonpayload_v1_updatedeliveryvehiclelog.response.lastlocation.rawlocation.latitude
as
lng
FROM
 `
ProjectID.TableName.fleetengine_googleapis_com_update_delivery_vehicle `
- Select Chart Type as Bubble Map, and then select the locationfield.
- Select Add a Field.
- Name the field and add the following formula:
CONCAT(lat, ",", lng). - Set the type to Geo->Latitude, Longitude.
- You can add controls to the dashboard to filter data. For example, select the Date-rangefilter.
- Edit the date range box to select a default date range.
- You can add additional drop-down list
controls for
vehicle_id. With these controls, you can visualize the movement of the vehicle or the movement within a trip.
Looker Studio example output:
What's next
To comply with data retention policies, see Restrict log retention .