Page Summary
-
Tag Manager's server-side preview and debug mode allows you to inspect incoming HTTP requests from your website or app and understand how they are processed.
-
The debugger helps verify that the correct client is claiming requests, ensuring data is routed properly within your server container.
-
You can examine outgoing HTTP requests to vendor endpoints like Google Analytics 4 to confirm data is being sent correctly with the expected parameters.
-
The debugger provides insights into tag firing status, variable values, and event data, enabling you to troubleshoot issues and ensure accurate data collection.
-
The console displays error messages related to tag execution, aiding in identifying and resolving problems within your server-side setup.
You can preview and debug your server-side container in Tag Manager.
Understand the preview layout
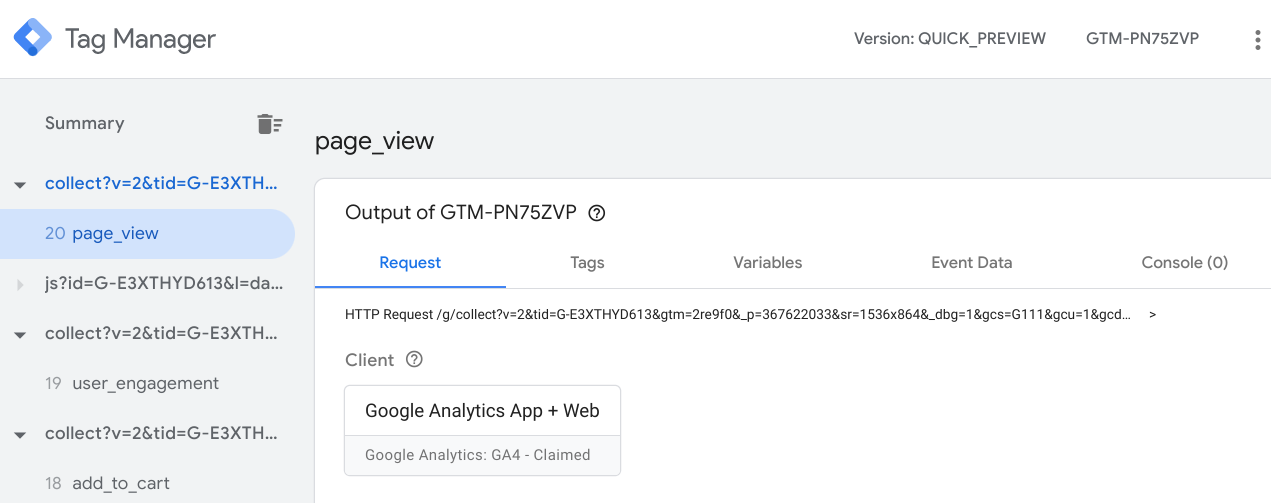
To open the debugger, in Tag Manager select your server container and click Preview.
The left panel lists incoming HTTP requests, e.g. collect?v=2&....
. If the
client that claimed the request created an event data object, e.g. scroll
, page_view
, add_to_cart
, this event displays as a sub item under the request.
The tabs on the right include details about the item selected in the left panel. Each tab is discussed in a separate section.
Debug requests
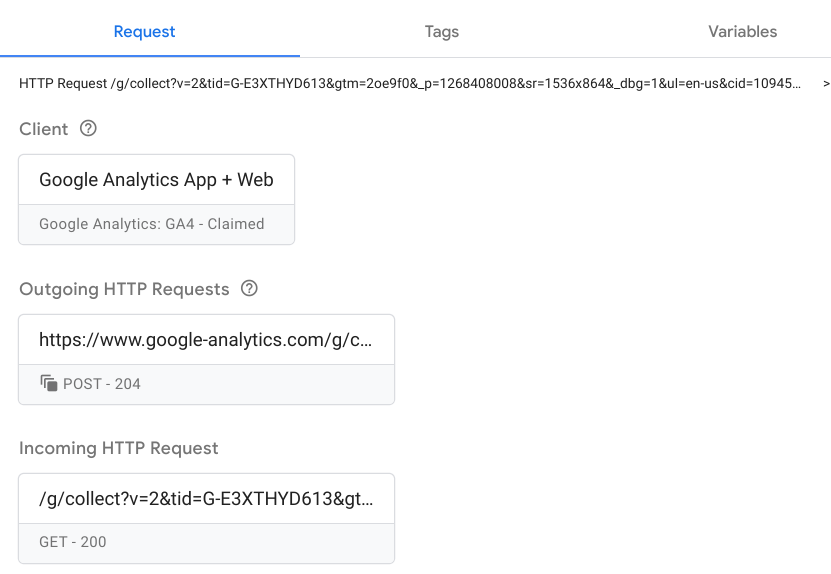
The Requesttab contains boxes for the:
- Client that claimed the request
- Outgoing HTTP requests
- Incoming HTTP request
Check the right client claimed the request
Server containers can have many clients, but only one client can claim a request. The correct client recognizes the format of the request from the browser and claims it if there is a match.
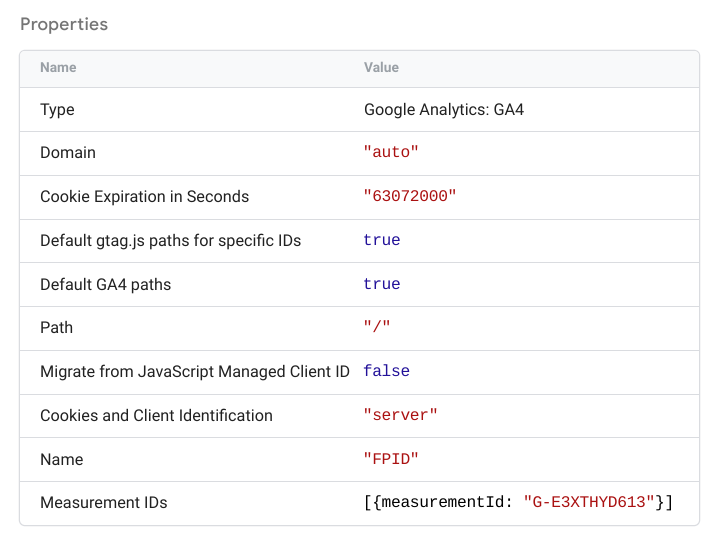
Click the Clientbox to check the client’s details. This information should correspond with the client configuration in Clients > Client name .
Check incoming requests
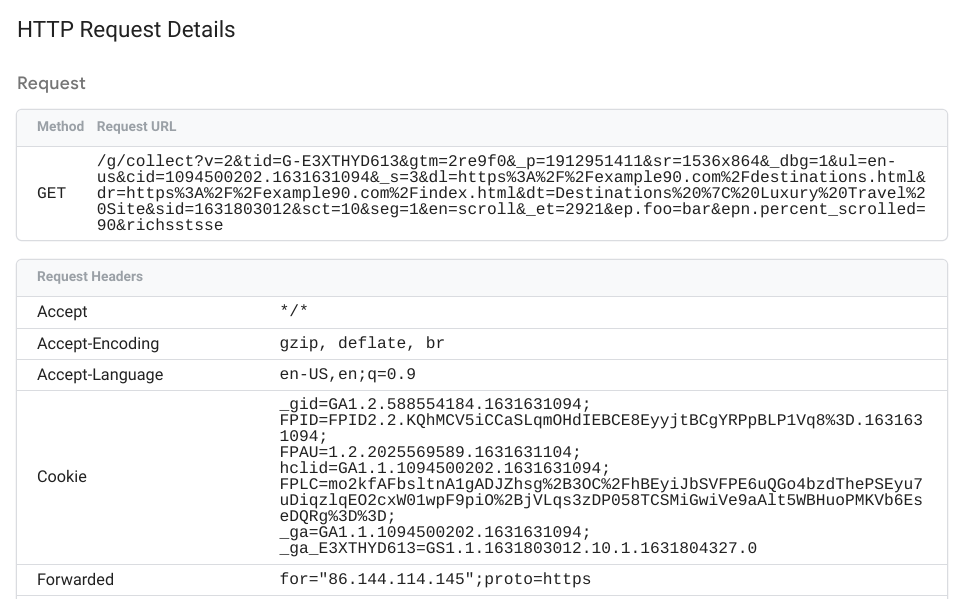
Click the Incoming HTTP Requestbox to view the full details of the incoming request.
The request ( collect?v=...
) should be a 1:1 representation of what you see in
the Chrome network tab. Confirm that what you see in the browser is a match and
that the server container is receiving the right parameters.
Check outgoing requests
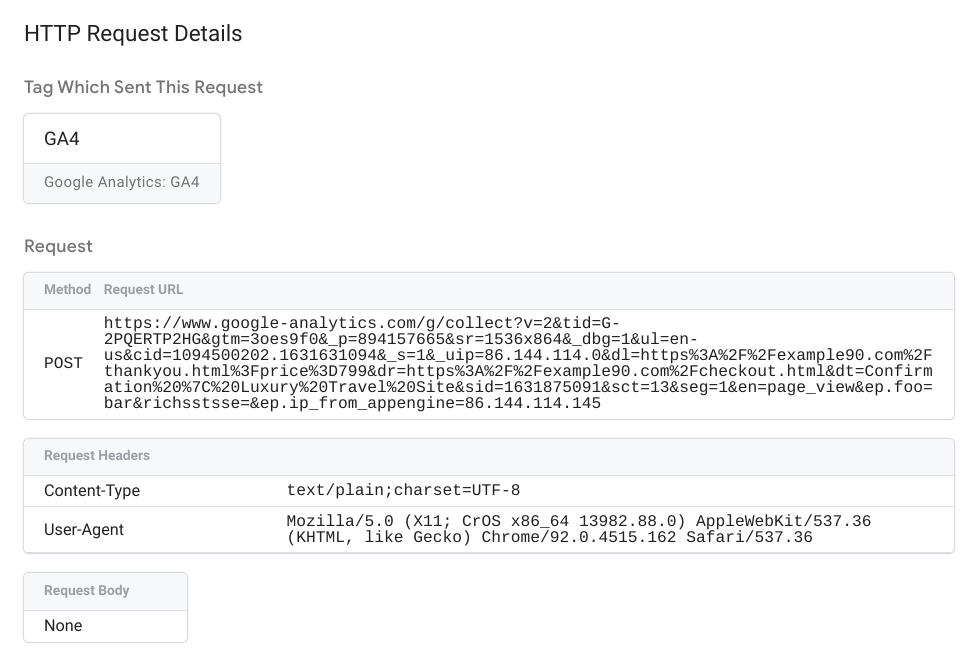
Click any Outgoing HTTP Requestsbox to view details about the:
- Tag that generated the request
- Outgoing request
- HTTP response returned by the vendor endpoint
The outgoing request details show the data sent by the server container to the vendor endpoint.
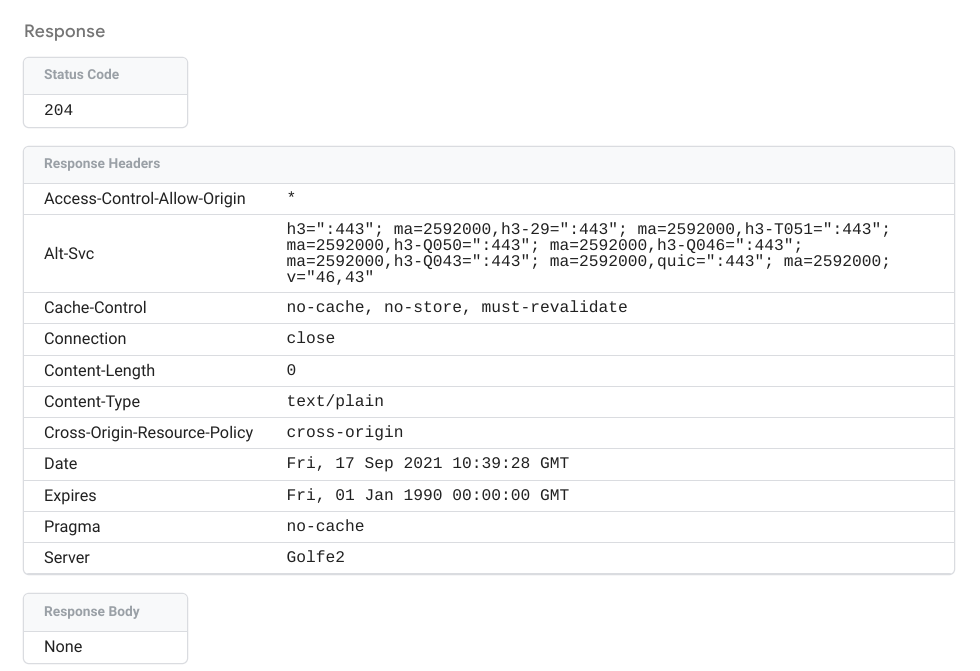
The Response shows the status code, headers and body (if any) returned by the vendor endpoint.
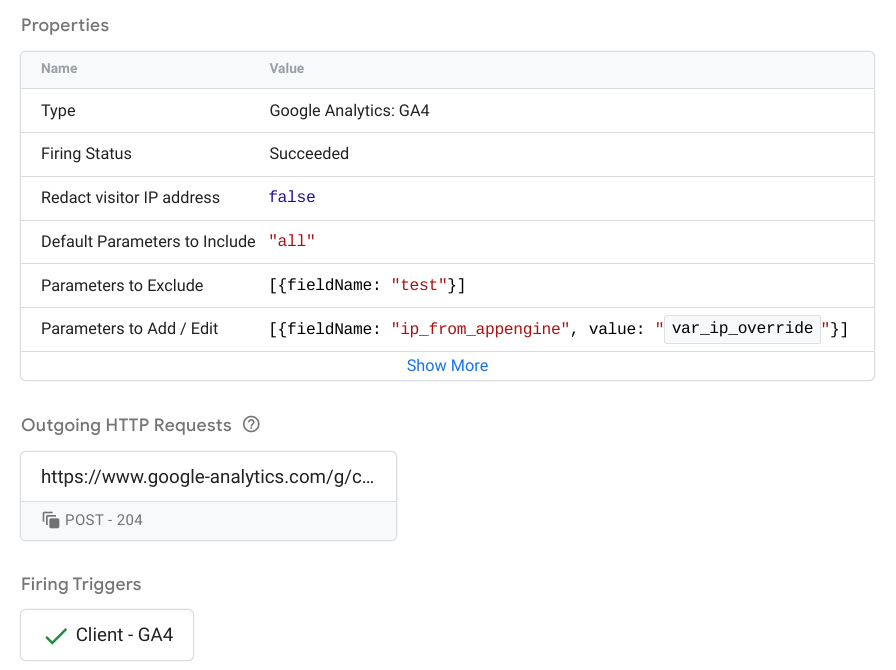
Debug tags
The Tagstab lists all configured tags:
- Tags Fired: Tags fired by the event. Each box indicates whether the tag failed or fired successfully, and the number of times the tag fired.
- Tags Not Fired: Available tags that did not fire.
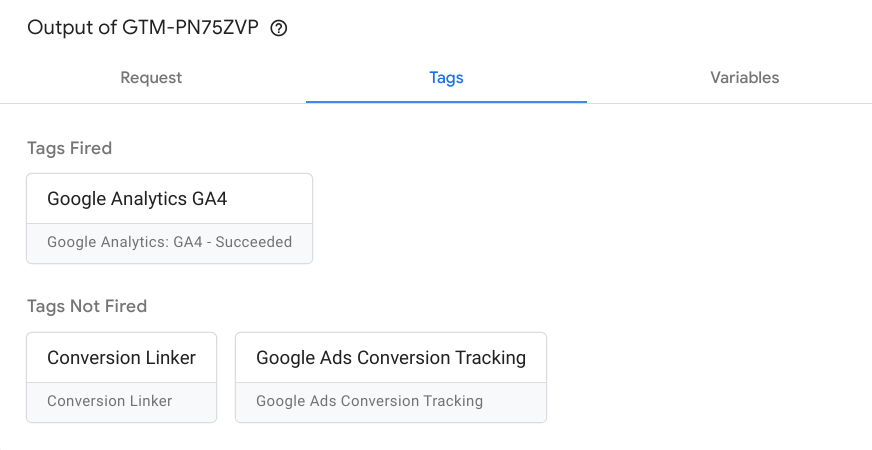
Click any box to view the tag properties, outgoing HTTP requests and firing triggers.
Read How to build a server tag for more information about configuring and implementing server tags.
Debug variables
The Variablestag lists the event’s variables and includes the variable
type, return type, and value. For example, the screenshot below for a user-engagement
event shows the var_screen_resolution
variable set to
“1536x864”.
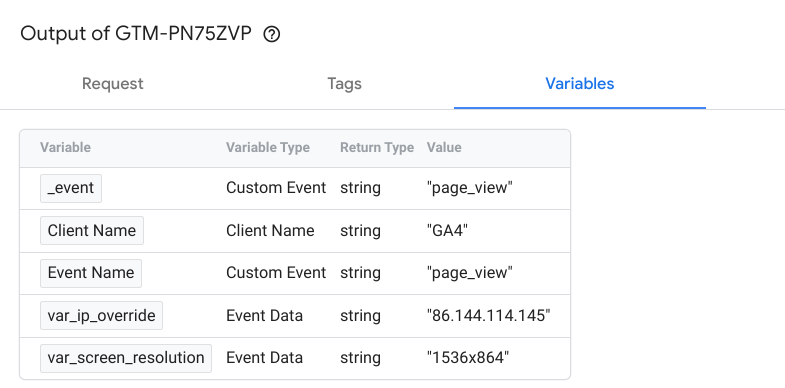
The data used to set the variable values is shown in the Event Datatab .
Read Variables for more information about configuring built-in variables and user-defined variables .
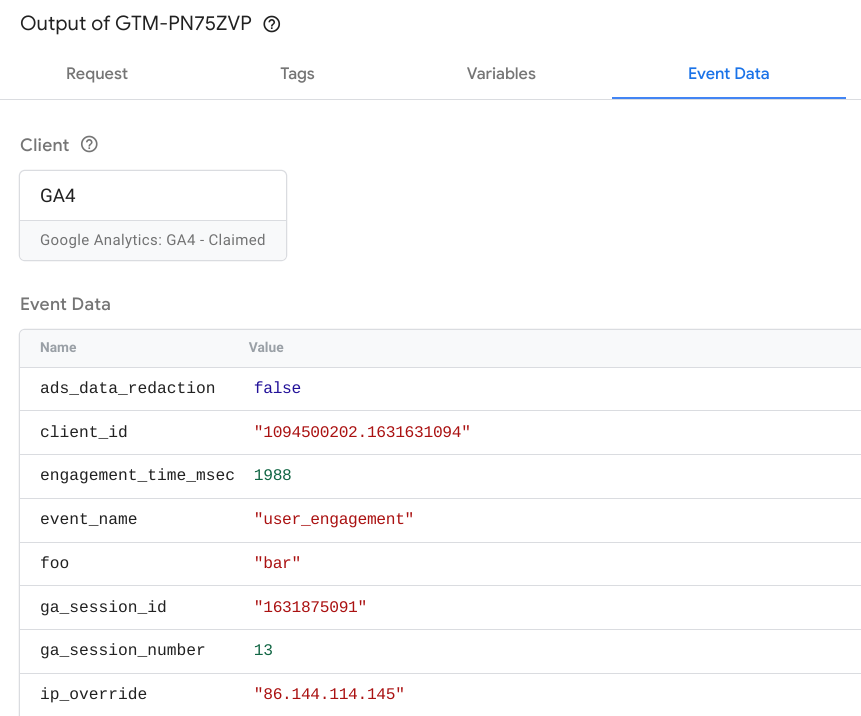
Debug event data
The Event Datatab shows full details about the event. This data is used to set the variable values in the Variablestab .
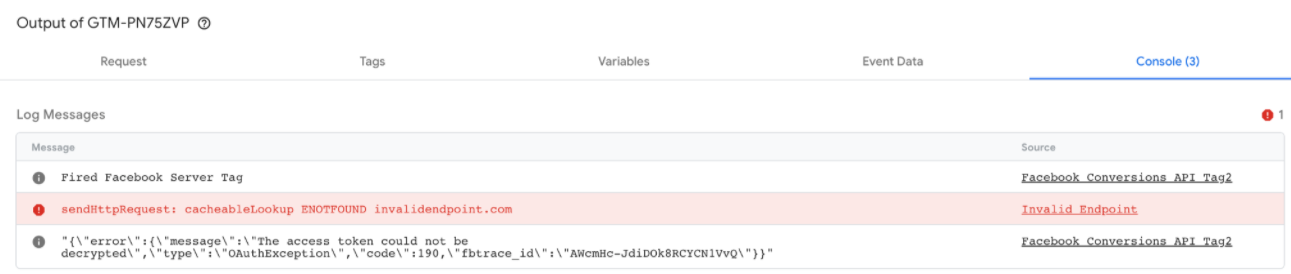
Console
The Consoletab shows all errors originating from fired tags. The log includes each error message and its source, e.g. an invalid endpoint or target API call.