
PR

令和維新
2004年4月から企業を離れ、コンサルタントや情報起業を試行しなが ら、失われた20年を取り戻し、日本再生をめざす私の歩みをみて一人でも多くの後継者が出てくれることを祈りつつ友達から紹 介されたこのホームページの更新を続け、これまでの活動の記録と今やビッグデータ、AI,、IOT,ブロックチェーン、仮想通貨の時代になってしまいましたが、私の現状認識と関連技術を紹介していきたい。
主権通貨国相手に市場は勝てない
ビットコインはちょうど7.6万ドルに達したが、今回は、単独で動いているわけではない。(Bitcoin Just Hit $76K — But This Time, It’s Not Moving Alone)
戦争への懸念が再燃しビットコインが下落 — 市場はトランプ氏のイランに関する発言に反応(Bitcoin Slips as War Fears Return — Markets React to Trump’s Iran Comments)
(3)ここ数年で暗号資産採用の最大の週はあなたが戦争を注視している間に起きていた(The Biggest Week for Crypto Adoption in Years Happened While You were Watching the War)
先端技術情報20260502
「国民を守るために国家のパワーを使え!」円急騰
彼は数分で 6 BTC を失った — Apple のストアに紛れ込んだ偽アプリ(He Lost 6 Bitcoin in Minutes — The Fake App That Slipped into Apple’s Store)
知的な回答はどのように機能するのか: セマンティック検索とコンテンツグラフをわかりやすく解説(How Intelligent Answering Works: Semantic Search and Content Graphs Explained Simply)
(2)ここ数年で暗号資産採用の最大の週はあなたが戦争を注視している間に起きていた(The Biggest Week for Crypto Adoption in Years Happened While You were Watching the War)
Comments
(藻緯羅の庵)[moir…
 New!
藻緯羅さん
New!
藻緯羅さん源氏物語〔34帖 若菜…
New!
USM1さんin と at どっち…
samito07さん上松付近で見たD51形…
GKenさんCategory
カテゴリ未分類
(112)連絡
(24)交流会
(27)セミナー
(29)参考情報
(138)オフ会
(36)on-line報告会
(13)翻訳ビジネス
(8)情報開発
(270)ビッグデータ
(84)ブロックチェーン
(242)人工知能
(480)IOT
(296)仮想通貨
(844)コンテンツ
(120)政治経済
(1860)先端技術
(955)DITA
(50)テレワーク
(28)UX
(0)文書管理
(8)テクニカルライテイング
(17)学習
(9)訓練
(1)XMLソリューション
(3)メタバース
(99)Web3
(66)投資
(172)IoT
(32)投資信託
(1)ビットコイン
(756)イーサリアム
(155)NFT
(41)オンライン
(0)受動収入
(14)ソーシャルメデイア
(0)DAO
(2)DeFi
(69)暗号通貨
(168)トークノミクス
(21)アルトコイン
(223)空中投下
(16)スマート契約
(4)ステーブルコイン
(42)金
(5)生成AI
(5)SCM
(4)ウオレット
(9)不労所得
(57)セキュリテイ
(4)ミームコイン
(50)CBDC
(5)PoS
(3)PoW
(1)ETF
(12)仮想通貨ETF
(1)予言
(7)裁定取引
(1)GameFi
(5)マイニング
(9)RWA
(21)DePIN
(18)SWFT
(1)WLFI
(1)アービトラージ
(7)XRP
(57)大統領選
(4)BCH
(1)取引ボット
(17)トレーデイング
(24)不動産
(1)詐欺
(4)貿易戦争
(1)医療
(1)金融
(2)TEZOS
(1)CARDANO
(2)カルダーノ
(3)ステーキング
(5)チェーンリンク
(1)開発
(0)HEDERA
(1)スマートマネー
(0)流動性
(0)AIエージェント
(8)401k
(1)国際送金
(1)solano
(1)AI
(1)暗号資産
(39)機関投資家
(1)Keyword Search
Freepage List


Shopping List
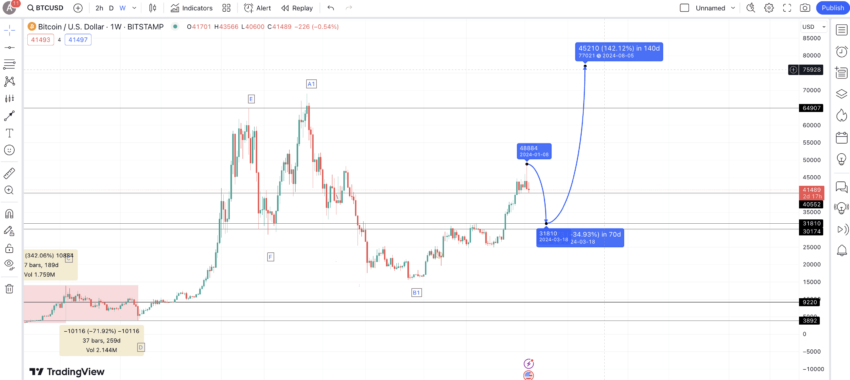
Looking closely, you might notice a similar trend forming with A1-B1-C1 already in. The next set of points would be D1, E1. and F1, which might give us the expected future price of Bitcoin.
よく見ると、
A1-B1-C1
がすでに入っているのと同様の傾向が形成されていることに気付くかもしれません。次のポイントのセットは
D1
、
E1
になります。
F1
は、ビットコインの将来の予想価格を教えてくれるかもしれません。
BTC price prediction and weekly RSI: TradingView
BTC
価格予測と週間
RSI: TradingView
But the question is, how are we sure that C1 is a fixed point and there would be an E1? The answer lies hidden in the RSI.
しかし、問題は、
C1
が不動点であり、
E1
が存在することをどうやって確信できるのかということです。その答えは
RSI
に隠されています。
Notice how the RSI started peaking at C, the first lower high on the chart. Post that, the RSI peaked, and so did the prices after the 2020 halving. At C1, the RSI is now at a similar level, and with the halving event approaching in less than four months, a price surge seems imminent.
RSI
がチャートの最初の低い高値である
C
でピークに達し始めたことに注目してください。その後、
RSI
はピークに達し、
2020
年の半減期後の価格もピークに達しました。
C1
では、
RSI
は現在同様のレベルにあり、半減期が
4
か月以内に近づいているため、価格の急騰が差し迫っているようです。
Calculations for finding key levels
主要水準を見つけるための計算
Now that we have located the points, it is time to find the price hikes and drops between them. That will help us identify the averages.
ポイントを特定したので、ポイント間の価格の上昇と下落を見つける時が来ました。これにより、平均値を特定することができます。
BTC price plots: TradingView
BTC
価格プロット
: TradingView
Levels for the first pattern A-to-F:
最初のパターン
A
から
F
のレベル
:
A to B |
-84.40% in 371 days |
|---|---|
B to C |
342.06% in 189 days |
C to D |
-71.92% in 259 days |
D to E |
1542% in 399 days |
E to F |
-56.03% in 70 days |
F to A1 |
142.25% in 140 days |
Plot 1
プロット1
Levels for the second pattern:
2
番目のパターンのレベル
:
A1 to B1 |
-77.68% in 378 days |
|---|---|
B1 to C1 |
217.90% in 413 days |
Plot 2
プロット2
Now that we have all the crucial levels, here are our inferences:
すべての重要なレベルが揃ったので、ここに推論を示します。
Average price percentage- high to low:-72.51% in 270 days (worst case scenario during bear markets)
平均価格パーセンテージ
-
高から低
:270
日間で
-72.51%(
弱気市場中最悪のシナリオ
)
Average price percentage- low to high:561.05% in 285 days (best case scenario during bull cycles)
平均価格パーセンテージ
-
低いものから高いものへ
:285
日間で
561.05%(
強気サイクル中の最良のシナリオ
)
We shall now use these data points to locate the future price of BTC.
次に、これらのデータポイントを使用して、
BTC
の将来の価格を特定します。
Bitcoin (BTC) price prediction 2024
ビットコイン
(BTC)
価格予測
2024
Outlook:
Bullish
見通し
:
強気
We have the last high or C1. Using the data points from earlier, we can assume that the lowest percentage drop could be 72.51%
from this level. However, now that we are about to
enter a bull market, BTC might not correct that much. Instead, we can assume it will stay near the $31810
mark, which assumes a drop of 35% and works as a strong support level. This could be the minimum price of BTC in 2024.
最後の高値または
C1
があります。先ほどのデータポイントから、このレベルから最も低い低下率は
72.51%
であると仮定できます。しかし、強気市場に突入しようとしている今、
BTC
はそれほど修正されないかもしれません。むしろ、
31810
ドル付近にとどまると想定でき、
35%
の下落を想定し、強力なサポートレベルとして機能します。これは、
2024
年の
BTC
の最低価格になる可能性があります。
Bitcoin price prediction 2024: TradingView
ビットコイン価格予測
2024
年
: TradingView
From this level, we might expect a 142.25%
hike (the lowest price hike percentage from the table above) in 140 days, which also takes the positive halving sentiment into account. Therefore, the maximum price of Bitcoin in 2024 could be $77021.
この水準から、
140
日後に
142.25%
の値上がり
(
上の表から最も低い値上げ率
)
が予想されますが、これも半減期の好調なセンチメントを考慮に入れています。したがって、
2024
年のビットコインの最大価格は
77021
ドルになる可能性があります。
Projected ROI from the current level: 86%
現在のレベルからの予測
ROI: 86%
Bitcoin (BTC) price prediction 2025
ビットコイン
(BTC)
価格予測
2025
Outlook:
Bullish
見通し:強気
Assuming BTC moves to $77021 in 2024, the next low or the minimum price of Bitcoin for 2025 can be expected to take support near the $59537
level mark. And while we have zeroed in on the average price percentage for a drop at 72.51%
, the dips aren’t usually that pronounced at least six to 18 months after a halving.
BTC
が
2024
年に
77021
ドルに移動すると仮定すると、
2025
年のビットコインの次の安値または最低価格は、
59537
ドルのレベルマークの近くでサポートを受けることが期待できます。また、下落の平均価格パーセンテージは
72.51%
に照準を合わせていますが、通常、半減期の少なくとも
6
〜
18
か月後には下落はそれほど顕著ではありません。

Bitcoin price prediction 2025: TradingView
ビットコイン価格予測
2025: TradingView
However, the dip might take the surface quickly, probably towards the early part of 2025. Post this low, you can expect BTC to scale new highs, something that happened 18 months after the 2020 halving event
. While a hike of 561.05%
might not be out of the question, post the ETF launch and, therefore, frequent sell-offs by asset managers, a more conservative hike percentage of 217.90 —the second lowest percentage move from a low to high — is expected.
しかし、この下落は、おそらく
2025
年の初めにかけて、急速に表面化するかもしれません。この安値を投稿すると、
BTC
は
2020
年の半減期から
18
か月後に起こった新しい高値を記録することが期待できます。
561.05%
の利上げも問題外ではないかもしれませんが、
ETF
の立ち上げ後、資産運用会社による頻繁な売りにより、より保守的な利上げ率は
217.90(
安値から高値への移動率としては
2
番目に低い
)
になると予想されています。
Keeping that in mind, BTC can scale a high of $189,313
in 2025. Do note that the dates may differ, and this level might end up surfacing in early 2026.
それを念頭に置いて、
BTC
は
2025
年に
189,313
ドルの高値に達する可能性があります。日付は異なる場合があり、このレベルは
2026
年初頭に浮上する可能性があることに注意してください。
Projected ROI from the current level: 362%
現在のレベルからの予測
ROI: 362%
Bitcoin (BTC) price prediction 2030
2030
年ビットコイン
(BTC)
価格予測
Outlook:
Bullish
見通し:強気
Sponsored
Explore BYDFi: Your Gateway to Private Trading
BYDFi
の詳細
:
プライベート取引へのゲートウェイ
- Trade Without KYC – Complete Anonymity
KYC なしの取引 – 完全な匿名性
- Get a guaranteed welcome bonus up to $2,888
最大 $2,888 のウェルカムボーナスをプレゼント
- Ranked among Top-10 crypto exchanges
トップ 10 の暗号取引所にランクイン
Join BYDFi
BYDFi
に参加
-
ビットコインはちょうど7.6万ドルに達した… 2026.05.03
-
戦争への懸念が再燃しビットコインが下落 … 2026.05.03
-
ビットコイン保有者が、ビットコインを手… 2026.05.01


