


PR
令和維新
2004年4月から企業を離れ、コンサルタントや情報起業を試行しなが ら、失われた20年を取り戻し、日本再生をめざす私の歩みをみて一人でも多くの後継者が出てくれることを祈りつつ友達から紹 介されたこのホームページの更新を続け、これまでの活動の記録と今やビッグデータ、AI,、IOT,ブロックチェーン、仮想通貨の時代になってしまいましたが、私の現状認識と関連技術を紹介していきたい。
国家の安全保障は取引ではない 結局のところ歴史的に「紛争」は続く
暗号資産世界への最新の脅威(Newest Threat to the Crypto World)
無料でサトシ/暗号資産を手に入れるための、実証済みの5つの方法(5 Proven Ways to Get Free Satoshis/Crypto)
(1)2026年にビットコインと暗号資産に本当に何が起こるのかを示す7つのチャート7 Charts That Show What’s Really Coming Next for Bitcoin and Crypto in 2026
先端技術情報20260526
正しい統計知識が正しい政策を導くが、統計知識を全て身に着けている国会議員の人数は、現状、間違いなくゼロに近い
なぜ暗号資産トレーダーにとって時間がなくなってきているのか(そして、私はそれに対して何をしているのか)Why Time is Running Out for Crypto Traders (And What I’m Doing About It)
オーラム(Aurum)
(2)無料でサトシ/暗号資産を手に入れるための、実証済みの5つの方法(5 Proven Ways to Get Free Satoshis/Crypto)
Comments
ANAフーズの”フィ…
 New!
藻緯羅さん
New!
藻緯羅さん源氏物語〔34帖 若菜…
New!
USM1さん函館駅、森駅で見たD…
GKenさんWe went skiing に続…
samito07さんCategory
カテゴリ未分類
(112)連絡
(24)交流会
(27)セミナー
(29)参考情報
(138)オフ会
(36)on-line報告会
(13)翻訳ビジネス
(8)情報開発
(270)ビッグデータ
(85)ブロックチェーン
(244)人工知能
(494)IOT
(298)仮想通貨
(850)コンテンツ
(123)政治経済
(1883)先端技術
(956)DITA
(50)テレワーク
(28)UX
(0)文書管理
(8)テクニカルライテイング
(17)学習
(9)訓練
(1)XMLソリューション
(3)メタバース
(101)Web3
(66)投資
(181)IoT
(32)投資信託
(1)ビットコイン
(772)イーサリアム
(156)NFT
(41)オンライン
(0)受動収入
(14)ソーシャルメデイア
(0)DAO
(2)DeFi
(74)暗号通貨
(168)トークノミクス
(21)アルトコイン
(223)空中投下
(16)スマート契約
(4)ステーブルコイン
(42)金
(5)生成AI
(5)SCM
(4)ウオレット
(9)不労所得
(57)セキュリテイ
(4)ミームコイン
(50)CBDC
(5)PoS
(3)PoW
(1)ETF
(12)仮想通貨ETF
(1)予言
(7)裁定取引
(1)GameFi
(5)マイニング
(9)RWA
(21)DePIN
(18)SWFT
(1)WLFI
(1)アービトラージ
(7)XRP
(57)大統領選
(4)BCH
(1)取引ボット
(17)トレーデイング
(27)不動産
(1)詐欺
(4)貿易戦争
(1)医療
(1)金融
(2)TEZOS
(1)CARDANO
(2)カルダーノ
(3)ステーキング
(5)チェーンリンク
(1)開発
(0)HEDERA
(1)スマートマネー
(0)流動性
(0)AIエージェント
(11)401k
(1)国際送金
(1)solano
(1)AI
(1)暗号資産
(56)機関投資家
(2)量子コンピューター
(2)Keyword Search
Freepage List


Shopping List


7 Charts That Show What’s Really Coming Next for Bitcoin and Crypto in 2026
2026年にビットコインと暗号資産に本当に何が起こるのかを示す7つのチャート
Blend Visions
ブレンドヴィジョンズ
March 16, 2026
2026年03月16日
I’ve been watching crypto markets for years. And right now? The fear is absolutely overwhelming.
私は何年も暗号資産市場をこれまで見てきた。そして今はどうか。恐怖が絶対圧倒的である。
People are panicking. Forums are full of doom. My inbox is flooded with messages asking if Bitcoin is dead. Honestly, I get it.
人々はパニックになっている。フォーラムは悲観一色があふれている。私の受信箱には「ビットコインは死んだのか」というメッセージが殺到している。正直、気持ちはわかる。
The sentiment right now is the worst I’ve seen. Worse than the COVID crash, worse than the FTX collapse, worse than anything before it.
今の地合いは、私が見てきた中で最悪だ。COVIDショックよりも、FTX崩壊よりも、これまでのどんな時よりも悪い。
But here’s the thing. When everyone is scared, I get curious. I start looking at charts. And what I found completely changed my perspective.
だが重要なのはこちらだ。みんなが怖がっているとき、私は逆に好奇心が湧く。チャートを見始める。そして、そこで見つけたものが私の見方を完全に変えた。
Let me walk you through seven charts that paint a very different picture of what comes next for Bitcoin and crypto.
これから、ビットコインと暗号資産の今後をまったく違う絵を描く7つのチャートを紹介しよう。
🛑🛑🛑🛑🛑🛑🛑🛑🛑🛑🛑🛑🛑🛑🛑🛑🛑🛑🛑🛑🛑🛑🛑🛑
Disclaimer: This post is just my personal opinion and ideas. I am not promoting or recommending any cryptocurrency or investment. Please do your own research and be careful when investing. Any decisions you make are at your own risk.
免責事項: この投稿は、あくまで私個人の意見と考えにすぎません。私はいかなる暗号通貨や投資を推奨・推薦しているわけではありません。投資を行う際は、ご自身で調査を行い、十分に注意してください。あなたが下す判断は、すべて自己責任となります。
🛑🛑🛑🛑🛑🛑🛑🛑🛑🛑🛑🛑🛑🛑🛑🛑🛑🛑🛑🛑🛑🛑🛑🛑
Bitcoin Fear Is at Historic Highs—But That’s Actually Bullish
ビットコインの恐怖は歴史的な高水準 ― しかし実は強気材料である
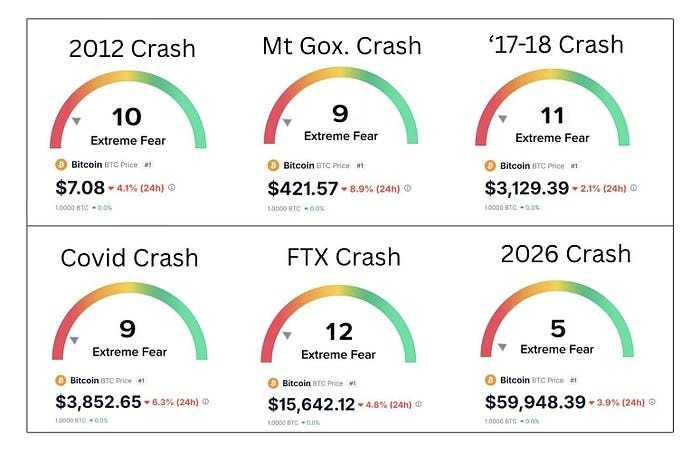
Bitcoin Fear Is at Historic Highs — But That’s Actually Bullish. Chart from @cryptorover
ビットコインの恐怖は歴史的な高水準 ― しかし実は強気材料である。@cryptorover のチャートより
Let me start with the obvious. Bitcoin’s fear and greed index is in extreme fear territory. I mean extreme. We haven’t seen readings like this in the entire recorded history of this market.
まずは明らかなことから話そう。ビットコインの恐怖・強欲指数は極度の恐怖にある。本当に極度だ。市場の記録が残っている限り、これほどの数値は見たことがない。
And you know what? That’s historically one of the best times to pay attention. Not to panic — to pay attention.
そして重要なのはここだ。歴史的に見れば、これは最も注意を払うべきタイミングのひとつだ。パニックになるのではなく、注意を払うべき時だ。
Every major crash in Bitcoin’s history has been followed by a recovery. Every single one.
ビットコインの歴史におけるすべての大暴落は、その後に回復している。例外は一度もない。
The people who bought during peak fear. During COVID, during FTX, during 2018, they didn’t regret it. The ones who sold regret it every day.
COVID、FTX、2018年など、恐怖のピーク中に買った人たちは後悔していない。売った人たちは日ごと後悔している。
I’m not saying pain is over. I’m saying the data says to look closer.
痛みが終わったと言っているわけではない。ただ、データはもっとじっくり見るようにと言っている。
Chart 1: Bitcoin Supply in Profit vs. Loss
チャート1: 利益状態 対 損失状態のビットコイン供給
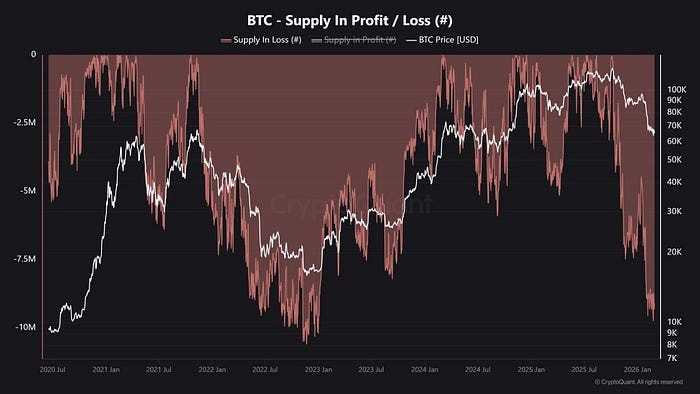
This historically only happens at cycle bottoms. Chart from @QuintenFrancois
これは歴史的に、サイクルの底でしか起こらない。@QuintenFrancois のチャートより
Right now, the ratio of Bitcoin supply in profit versus Bitcoin supply in loss has reached a level that historically only appears at cycle bottoms.
現在、利益にあるビットコイン供給と損失にあるビットコイン供給の比率は、歴史的にサイクル底でしか見られない水準に達している。
Think about what that means. It means the majority of recent buyers are underwater. It means sentiment is crushed.
これは何を意味するのか。最近の買い手の大半が含み損であるということだ。つまり、地合いが打ち砕かれたことを意味する。
And it means, based on every past cycle, we’re likely sitting right at or near a major inflection point.
そして、過去のすべてのサイクルに基づけば、私たちは大きな転換点の真上かすぐ近くにいる可能性が高いということだ。
This isn’t hopeful guessing. This is pattern recognition from over a decade of Bitcoin market history. I look at this chart, and I feel a strange kind of calm.
これは希望的観測ではない。10年以上のビットコイン市場の歴史から導かれるパターン認識だ。このチャートを見ると、私は奇妙な落ち着きを感じる。
Chart 2: Bitcoin’s Cost of Production
チャート2: ビットコインの生産コスト
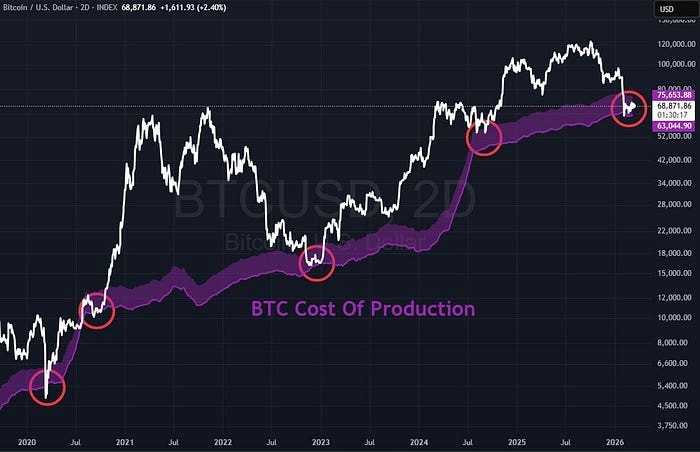
BTC at production cost = buying opportunity. Chart from @QuintenFrancois
ビットコインが生産コストに到達する=買いのチャンス。@QuintenFrancois のチャートより
Bitcoin miners are the backbone of the network. And right now, Bitcoin’s price is touching its cost of production — the level at which mining becomes barely profitable or unprofitable.
ビットコインの採掘者はネットワークの背骨だ。そして今、ビットコイン価格は生産コストに触れている ― 採算がギリギリ、もしくは赤字になる水準だ。
This has only happened a handful of times in Bitcoin’s history. Each time? It marked a major bottom.
これはビットコインの歴史の中で数えるほどしか起きていない。そしてそのたびにどうだったか。それは、大底を示してきた。
When the price touches production cost, weak miners exit. The network adjusts. And historically, that’s been the reset that precedes the next big move upward. I find this chart quietly reassuring.
価格が生産コストに触れると、弱い採掘者が退出する。ネットワークは調整される。そして歴史的に、それが次の大きな上昇の前に起こるリセットだった。このチャートには静かな安心感がある。
Chart 3: Individual Ownership Is Shifting to Institutions
チャート3:個人保有が機関保有へとシフトしている
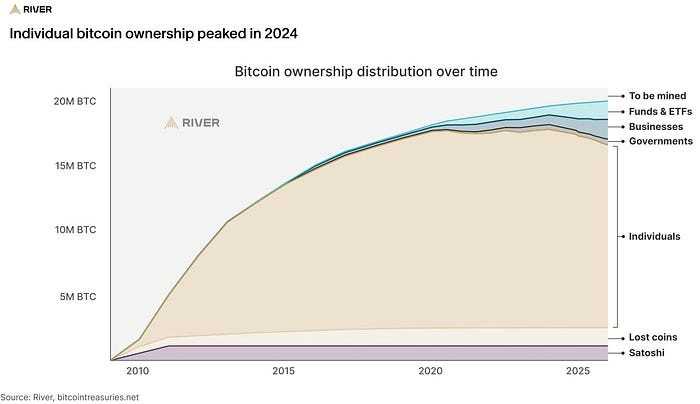
Bitcoin ownership peaked in 2024 and is projected to flip by 2036. Chart 1from @1MarkMoss
ビットコインの個人保有は2024年にピークを迎え、2036年までに逆転すると予測されている。@1MarkMoss のチャート1より
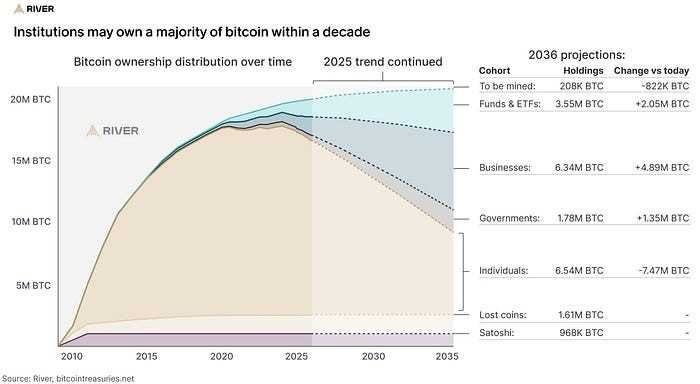
Bitcoin ownership peaked in 2024 and is projected to flip by 2036. Chart 2 from @1MarkMoss
ビットコインの個人保有は2024年にピークを迎え、2036年までに逆転すると予測されている。@1MarkMoss のチャート 2より
Here’s one that actually stopped me in my tracks. Individual Bitcoin ownership peaked in 2024.
これは本当に私の足を止めたデータだ。個人によるビットコイン保有は2024年にピークを迎えた。
And according to projections, by 2036, institutions, governments, funds, and ETFs will hold more Bitcoin than individual retail investors.
そして予測によれば、2036年までに、機関、政府、ファンド、ETFが個人投資家より多くのビットコインを保有するようになる。
That’s a massive structural shift. We’re watching Bitcoin transform from a retail-driven asset to a macro financial instrument.
これは巨大な構造変化だ。私たちは、ビットコインが小口投資家駆動の資産からマクロ金融資産へと変わっていく様子を見守っている。
Central banks are buying. Kazakhstan just became the first central bank to officially add Bitcoin. Pension funds are entering. Endowments are allocating.
中央銀行が買っている。カザフスタンはビットコインを正式に追加した初の中央銀行となった。年金基金も参入している。大学基金も資金配分を始めている。
This isn’t speculation anymore. This is a financial system in transition. And I believe the people who recognize this early will look back on this moment as obvious.
これはもはや憶測ではない。これは移行期にある金融システムだ。そして、これを早く理解した人たちは、この瞬間を振り返って当然だったと思うだろう。===続く===
==============================
インターネット・コンピュータランキング
============================== ネットサービスランキング
==============================
![[商品価格に関しましては、リンクが作成された時点と現時点で情報が変更されている場合がございます。]](https://hbb.afl.rakuten.co.jp/hgb/4fd4a813.157ef50d.4fd4a814.82486a3e/?me_id=1434481&item_id=10000129&pc=https%3A%2F%2Fthumbnail.image.rakuten.co.jp%2F%400_mall%2Ftsk8-shop%2Fcabinet%2F1st%2Fnormal01%2Fti25046.jpg%3F_ex%3D240x240&s=240x240&t=picttext "[商品価格に関しましては、リンクが作成された時点と現時点で情報が変更されている場合がございます。]")
ズワイガニ 半むき身 生冷凍 1200g 1.2kg ズワイ蟹 ずわい蟹 かに 蟹 カニ 生 刺身 鍋用 しゃぶしゃぶ カニ刺し 送料無料 [TAKUMIの逸品] 価格:14,400円(税込、送料無料) (2026/1/8時)

![[商品価格に関しましては、リンクが作成された時点と現時点で情報が変更されている場合がございます。]](https://hbb.afl.rakuten.co.jp/hgb/4fd4a9d0.573d1d85.4fd4a9d1.65b8ce1e/?me_id=1399275&item_id=10000005&pc=https%3A%2F%2Fthumbnail.image.rakuten.co.jp%2F%400_mall%2Fkaito-seafood%2Fcabinet%2F08394230%2Fimgrc0080410169.jpg%3F_ex%3D240x240&s=240x240&t=picttext "[商品価格に関しましては、リンクが作成された時点と現時点で情報が変更されている場合がございます。]")
魚 セット さかな 切り身 詰め合わせ おにぎりの具 冷凍食品 焼き魚 食品 8種セット (約50gx16切入) 【 簡易包装(熨斗はありません)】 敬老の日 お歳暮 クリスマス お正月 ※ 訳あり 骨なし ではありません 価格:3,960円(税込、送料別) (2026/1/8時点)
![[商品価格に関しましては、リンクが作成された時点と現時点で情報が変更されている場合がございます。]](https://hbb.afl.rakuten.co.jp/hgb/1ff2bb79.191d27ac.1ff2bb7a.979bba0e/?me_id=1206032&item_id=14577484&pc=https%3A%2F%2Fthumbnail.image.rakuten.co.jp%2F%400_mall%2Fjism%2Fcabinet%2F0528%2F4529327929000.jpg%3F_ex%3D240x240&s=240x240&t=picttext "[商品価格に関しましては、リンクが作成された時点と現時点で情報が変更されている場合がございます。]")
Titan Army|タイタンアーミー ゲーミング液晶ディスプレイ(27型/FAST IPS/WQHD 2560×1440/320Hz/1ms/HDR1000/HDMI2.1/DP1.4/PBP・PIP対応/VESA)(ブラック) P275MS+ 価格:62,800円(税込、送料別) (2025/8/1時点)
![[商品価格に関しましては、リンクが作成された時点と現時点で情報が変更されている場合がございます。]](https://hbb.afl.rakuten.co.jp/hgb/4ae27d5e.21a3ae23.4ae27d5f.b3ad3ffe/?me_id=1430642&item_id=10000096&pc=https%3A%2F%2Fthumbnail.image.rakuten.co.jp%2F%400_mall%2Fvoguevortex%2Fcabinet%2F11366713%2F11366934%2F11367029%2Fztr.jpg%3F_ex%3D240x240&s=240x240&t=picttext "[商品価格に関しましては、リンクが作成された時点と現時点で情報が変更されている場合がございます。]")

-
(2)市場が数時間であらゆるものを再評価し… 2026.05.24
-
ウォール街はビットコインETFに数十億ドル… 2026.05.23
-
(1)市場が数時間であらゆるものを再評価し… 2026.05.23


